. 2024 Mar 27;21(1):78.
doi: 10.1186/s12974-024-03060-4.

Changes in lipid metabolism track with the progression of neurofibrillary pathology in tauopathies

Affiliations

Changes in lipid metabolism track with the progression of neurofibrillary pathology in tauopathies

Dominika Olešová et al. J Neuroinflammation. .

Abstract

Background: Accumulation of tau leads to neuroinflammation and neuronal cell death in tauopathies, including Alzheimer's disease. As the disease progresses, there is a decline in brain energy metabolism. However, the role of tau protein in regulating lipid metabolism remains less characterized and poorly understood.

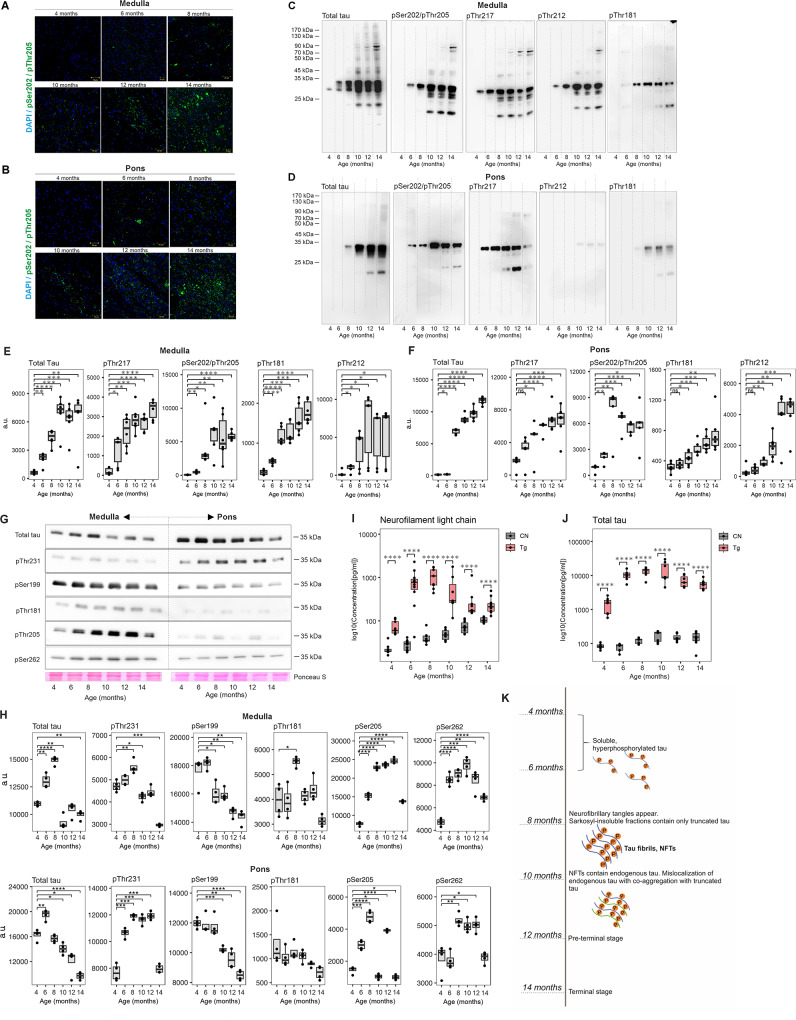
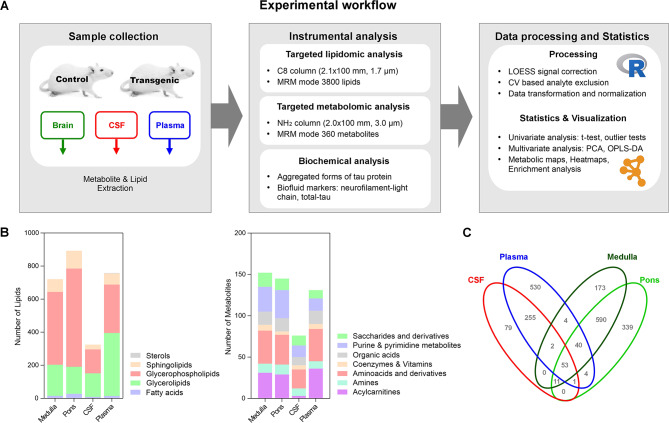
Methods: We used a transgenic rat model for tauopathy to reveal metabolic alterations induced by neurofibrillary pathology. Transgenic rats express a tau fragment truncated at the N- and C-terminals. For phenotypic profiling, we performed targeted metabolomic and lipidomic analysis of brain tissue, CSF, and plasma, based on the LC-MS platform. To monitor disease progression, we employed samples from transgenic and control rats aged 4, 6, 8, 10, 12, and 14 months. To study neuron-glia interplay in lipidome changes induced by pathological tau we used well well-established multicomponent cell model system. Univariate and multivariate statistical approaches were used for data evaluation.

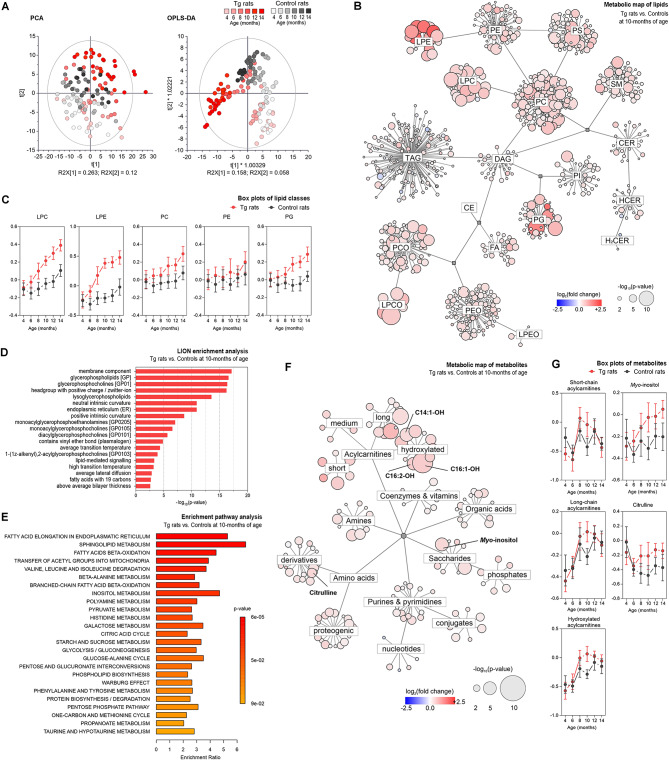
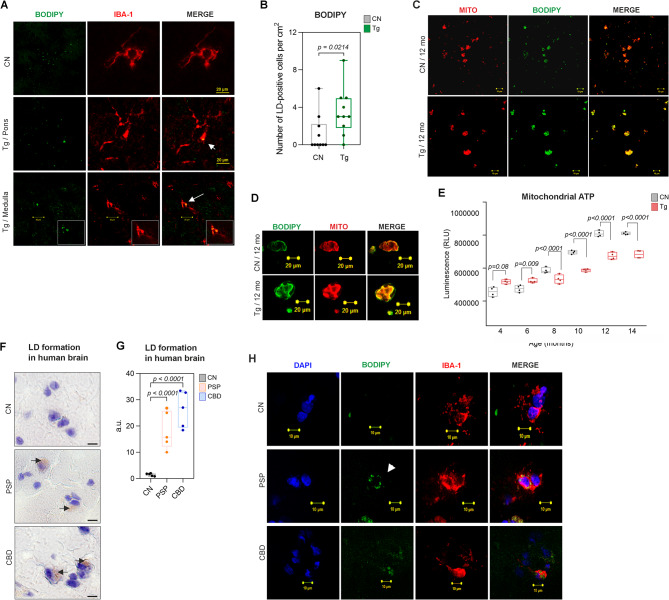
Results: We showed that tau has an important role in the deregulation of lipid metabolism. In the lipidomic study, pathological tau was associated with higher production of lipids participating in protein fibrillization, membrane reorganization, and inflammation. Interestingly, significant changes have been found in the early stages of tauopathy before the formation of high-molecular-weight tau aggregates and neurofibrillary pathology. Increased secretion of pathological tau protein in vivo and in vitro induced upregulated production of phospholipids and sphingolipids and accumulation of lipid droplets in microglia. We also found that this process depended on the amount of extracellular tau. During the later stages of tauopathy, we found a connection between the transition of tau into an insoluble fraction and changes in brain metabolism.

Conclusion: Our results revealed that lipid metabolism is significantly affected during different stages of tau pathology. Thus, our results demonstrate that the dysregulation of lipid composition by pathological tau disrupts the microenvironment, further contributing to the propagation of pathology.

Keywords: Lipid droplets; Lipidomics; Metabolomics; Microglia; Neurodegeneration; SHR24; Tau protein.


Conflict of interest statement

The authors declare no competing interests.

Figures

Fig. 1
Fig. 1
Neurofibrillary pathology progressively increased in an age-dependent manner in the brainstem of Tg rats. A-B, Immunohistochemical staining (DAPI-blue, pSer202/pThr205-green) demonstrated the presence of tau protein phosphorylated at pSer202/pThr205 in the medulla oblongata and pons of Tg rats. C-F, Progressive increase in the levels of sarkosyl-insoluble tau protein complexes in the medulla oblongata and pons of Tg rats. G-H, Increase in soluble hyperphosphorylated truncated tau in medulla and pons of Tg rats. Ontogenesis of soluble tau and sarkosyl-insoluble tau complexes in aging rats from 4 to 14 months (n = 6 for each age) was monitored by Western blot analysis using phosphorylation-dependent anti-tau antibodies against pThr212, pThr181, pThr217, pSer199, pThr231, pSer262 and pSer202/pThr205. Total tau was determined with a DC25 anti-tau antibody. I-J, The levels of biofluid markers (neurofilament and total tau) of tau pathology. K, The summary of changes in tau pathology during the lifespan of the Tg rats. Data are presented as boxplots (Min to Max)
Fig. 2
Fig. 2
Overview of experimental approach, targeted lipidomic and metabolomic analyses, and data processing. A Experimental workflow started with the collection of brain tissue, CSF, and plasma samples of 4, 6, 8, 10, 12, and 14 months-old transgenic (SHR-24) and age-matched controls (SHR). Subsequently, high-coverage lipidomic and metabolomic analyses were performed together with biochemical analysis for tau pathology characterization. Two omics datasets were processed and statistically evaluated together using several approaches. B Overview of several identified lipids and metabolites in brain tissue, CSF, and plasma. Lipids were grouped according to the LIPID maps classification system (fatty acids, glycerolipids, glycerophospholipids, sphingolipids, and sterols). Metabolites were grouped according to their chemical structure into 7 main groups (acylcarnitines, amines, amino acids, and derivatives, coenzymes, and vitamins, organic acids, purine & pyrimidine metabolites, saccharides, and derivatives). C Venn diagram shows the numbers of identified lipids and metabolites in each compartment
Fig. 3
Fig. 3
Metabolic patterns of brain tissue affected by tau pathology. Univariate and multivariate analyses of metabolic patterns found in the medulla oblongata of 10-month-old SHR-24 Tg rats compared with age-matched controls (SHR). A Principal component analysis (PCA) and orthogonal partial least square discriminant analysis (OPLS-DA) B Metabolic map showing results from significance testing for lipids – student’s t-test and fold change. The size of each bubble represents the statistical significance (p-value), and color and shade indicate the level of fold change between SHR-24 Tg and control groups. C Age-related changes of the most distinctive lipid classes (data are presented as median intensities with 95% confidence intervals). E Enrichment pathway analysis of metabolomics data. The biochemical pathways were assessed using statistical significance (p-value) and enrichment ratio. F Metabolic map showing results from significance testing for metabolites– student’s t-test and fold change. G Age-related changes of short-chain, long-chain, and hydroxylated acylcarnitines, myoinositol, and citrulline (data are presented as median intensities with 95% confidence intervals). Abbreviations LPE – lysophosphatidylethanolamines, PE – phosphatidylethanolamines, PS – phosphatidylethanolserines, PC – phosphatidylcholines, LPC – lysophosphatidylcholines, SM – sphingomyelins, CER – ceramides, HCER – hexosyl-ceramides, H2CER – dihexosyl-ceramides, DAG – diacylglycerols, TAG – triacylglycerols, PI – phosphatidylinositols, PG – phosphatidylglycerols, CE – cholesteryl esters, FA – fatty acids, PCO – plasmenyl phosphatidylcholines, LPCO – plasmenyl lysophosphatidylcholines, PEO – plasmenyl phosphatidylethanolamines, LPEO – plasmenyl lysophosphatidylethanolamines
Fig. 4
Fig. 4
Global effects of brain aberrant metabolism on the composition of CSF. Univariate and multivariate analyses of metabolic patterns found in cerebrospinal fluid of 10-month-old SHR-24 Tg rats compared with age-matched controls. A Principal component analysis (PCA), and orthogonal partial least square discriminant analysis (OPLS-DA). B Metabolic map showing results from significance testing for lipids – student’s t-test (p-value and fold change). C Age-related changes of the most distinctive lipid classes (data are presented as median intensities with 95% confidence intervals). D Lipid ontology enrichment analysis. E Metabolic map showing results from significance testing for metabolites – student’s t-test and fold change. F Enrichment pathway analysis of metabolomics data. The biochemical pathways were evaluated using p-value and enrichment ratio. G Age-related changes of metabolites belong to the pathways: purine catabolism (xanthine, uric acid) and analytes of creatine/arginine metabolism (creatine, phosphocreatine, arginine), free carnitine, myoinositol and citrate + isocitrate (data are presented as median intensities with 95% confidence intervals). Abbreviations LPE – lysophosphatidylethanolamines, PE – phosphatidylethanolamines, PS – phosphatidylethanolserines, PC – phosphatidylcholines, LPC – lysophosphatidylcholines, SM – sphingomyelins, CER – ceramides, HCER – hexosyl-ceramides, H2CER – dihexosyl-ceramides, DAG – diacylglycerols, TAG – triacylglycerols, PI – phosphatidylinositols, PG – phosphatidylglycerols, CE – cholesteryl esters, FA – fatty acids, PCO – plasmenyl phosphatidylcholines, LPCO – plasmenyl lysophosphatidylcholines, PEO – plasmenyl phosphatidylethanolamines, LPEO – plasmenyl lysophosphatidylethanolamines
Fig. 5
Fig. 5
Pathological truncated tau protein induced lipid changes and LD formation in brain resident immune cells. A-B Expression of endogenous and truncated tau protein by human SH-SY5Y neuroblastoma cells. C-D Quantification showed that the expression of endogenous tau was not changed in time, however, truncated tau increased (mean ± SD). E-F Analysis of cultivation media demonstrated higher secretion of the proline-rich domain of tau compared to total tau (boxplots with min to max, student’s t-test with p-value). G Cytotoxicity measured by AlamarBlue assay and displayed as boxplots (student’s t-test with p-value). H Principal component analysis (PCA), and orthogonal partial least square discriminant analysis (OPLS-DA). I Metabolic map showing results from significance testing for lipids – student’s t-test (p-value and fold change). J Lipid ontology enrichment analysis. K-L Primary rat microglia were co-cultivated with neuroblastoma cells expressing truncated tau. Representative images of DAPI (blue), BODIPY+ (green), and IBA-1 (red) staining in microglia and quantification of BODIPY + relative fluorescence intensity (24 h: 17.35 ± 1.84; 48 h: 23.21 ± 1.4, 72 h: 25.16 ± 1.33, 33.93 ± 3.9, n = 5; mean ± SD; student’s t-test with p-value). Scale bar 20 μm
Fig. 6
Fig. 6
Tau protein-induced formation of lipid droplets and changes in membrane fluidity. A BV2 mouse-derived microglia were treated with Tau (151–391/3R) protein (500 nM for 24 h). Representative images of DAPI (blue) and BODIPY+ (green) staining in BV2 cells. B Quantification of BODIPY+ relative fluorescence intensity (CN: 23.91 ± 5.62; Tau: 34.41 ± 8.60; p = 0.0013; n = 7; mean ± SD, student’s t-test with p-value). Scale bar 20 μm. C Representative flow cytometry histograms. D Quantification of BODIPY+ mean fluorescence intensity in BV2 cells (CN: 1707 ± 227; Tau: 2325 ± 409; p = 0.0234; n = 4; mean ± SD, student’s t-test with p-value). E Effect of Tau (151–391/3R) protein treatment on BV2 cells membrane fluidity. After incubation, BV2 cells were incubated with lipophilic pyrene probe PDA/Pluronic F127 solution (25 °C, 1 h) which undergoes dimerization after the interaction and exhibits changes in its fluorescent properties. Changes in cell membrane lipid order, between the monomer gel/liquid-ordered phase (fluorescent at 430 ∼ 470 nm) and the excimer liquid phase (fluorescent at 480 ∼ 550 nm) were measured by confocal microscopy. F Representative images of changed membrane fluidity. G Quantification of relative fluorescence intensity of monomer vs. excimer ratio (n = 4, mean ± SD; student’s t-test with p-value). H Representative images of DAPI (blue) and BODIPY+ (green), and MitoTracker (red) staining in BV2. Scale bar 20 μm. I ATP levels were decreased in LDs accumulating BV2 cells (CN: 60,346 ± 1310; Tau: 52,267 ± 1032; p = 0.0029, n = 5, mean ± SD; student’s t-test with p-value)
Fig. 7
Fig. 7
Lipid droplet accumulation in microglia of Tg rats and human tauopathies. A Representative confocal images. LDs accumulate in microglia of SHR-24 Tg rats. BODIPY+(green) and IBA1+(red) in the brainstem (medulla oblongata, pons) of 12-month-old SHR-24 Tg rats. Scale bar 20 μm. B Quantification of BODIPY+ cells (CN: 1.2 ± 1.9; TG: 3.5 ± 2.5; p = 0.0214; n = 10, mean ± SD; student’s t-test with p-value). C-D LDM isolated from brain tissue of control and Tg animals. Representative images of BODIPY+ (green), and Mitotracker (red) staining in LDM. E Luciferase luminescence ATP detection assay showed decreased ATP levels in the LDM sample of Tg rats compared to controls. Data are presented as boxplots (Min to Max), student’s t-test with p-value. F LD formation in human brain tissue of patients with PSP and CBD. Oil Red O staining neutral lipids images. G Quantification (CN: 1.46 ± 0.53; PSP: 18.30 ± 7.27; p < 0.0001 CBD: 26.30 ± 6.96; p < 0.0001; n = 5, student’s t-test with p-value). H Representative images of DAPI (blue), BODIPY+ (green), and IBA+ (red) staining in the human brain. Scale bar 10 μm. Abbreviations: PSP - Progressive supranuclear palsy, CBD - Corticobasal degeneration
Fig. 8
Fig. 8
Tau pathology switches the energy metabolism to fatty acid oxidation. A-B Immunofluorescence staining of neuron-specific glucose transporter 3 (GLUT3) in the medulla oblongata from control and transgenic animals. Representative images of GLUT3 (green), NeuN (red), and DAPI staining (blue). C Representative images of 8-month-old control and transgenic animals. Scale bar 20 μm. D. Quantification of GLUT3 mean fluorescence intensity in brain tissue. Quantification of relative fluorescent intensity showed a decrease of GLUT3 in transgenic animals (8-months old animals: CN: 25.07 ± 1.43, Tg: 20.91 ± 0.54; p = 0.035; 10-month-old animals: CN: 28.37 ± 1.03, Tg: 22.36 ± 1.67; p = 0.022; n = 5; mean ± SD, student’s t-test with p-value). E Changes of long-chain, hydroxylated, short-chain ACs and free carnitine in brain tissue of control and transgenic rats (data are presented as median intensities with 95% confidence intervals)

References

    1. Masters CL, Bateman R, Blennow K, Rowe CC, Sperling RA, Cummings JL. Alzheimer’s disease. Nat Rev Dis Primers. 2015;1:15056. doi: 10.1038/nrdp.2015.56. - DOI - PubMed
    1. Iqbal K, del Alonso C, Chen A, Chohan S, El-Akkad MO, Gong E. C-X, Tau pathology in Alzheimer disease and other tauopathies. Biochimica et Biophysica Acta (BBA) - molecular basis of Disease. 2005;1739:198–210. - PubMed
    1. Avila J. Tau aggregation into fibrillar polymers: taupathies. FEBS Lett. 2000;476:89–92. doi: 10.1016/S0014-5793(00)01676-8. - DOI - PubMed
    1. Cantrelle F-X, Loyens A, Trivelli X, Reimann O, Despres C, Gandhi NS et al. Phosphorylation and O-GlcNAcylation of the PHF-1 epitope of tau protein induce local conformational changes of the C-Terminus and modulate tau self-assembly into Fibrillar aggregates. Front Mol Neurosci. 2021;14. - PMC - PubMed
    1. Kawarabayashi T. Dimeric amyloid protein rapidly accumulates in lipid rafts followed by Apolipoprotein E and Phosphorylated Tau Accumulation in the Tg2576 mouse model of Alzheimer’s Disease. J Neurosci. 2004;24:3801–9. doi: 10.1523/JNEUROSCI.5543-03.2004. - DOI - PMC - PubMed