. 2024 Mar 27;22(1):193.
doi: 10.1186/s12964-024-01560-7.

M1-derived extracellular vesicles polarize recipient macrophages into M2-like macrophages and alter skeletal muscle homeostasis in a hyper-glucose environment

Affiliations

M1-derived extracellular vesicles polarize recipient macrophages into M2-like macrophages and alter skeletal muscle homeostasis in a hyper-glucose environment

Stefano Tacconi et al. Cell Commun Signal. .

Abstract

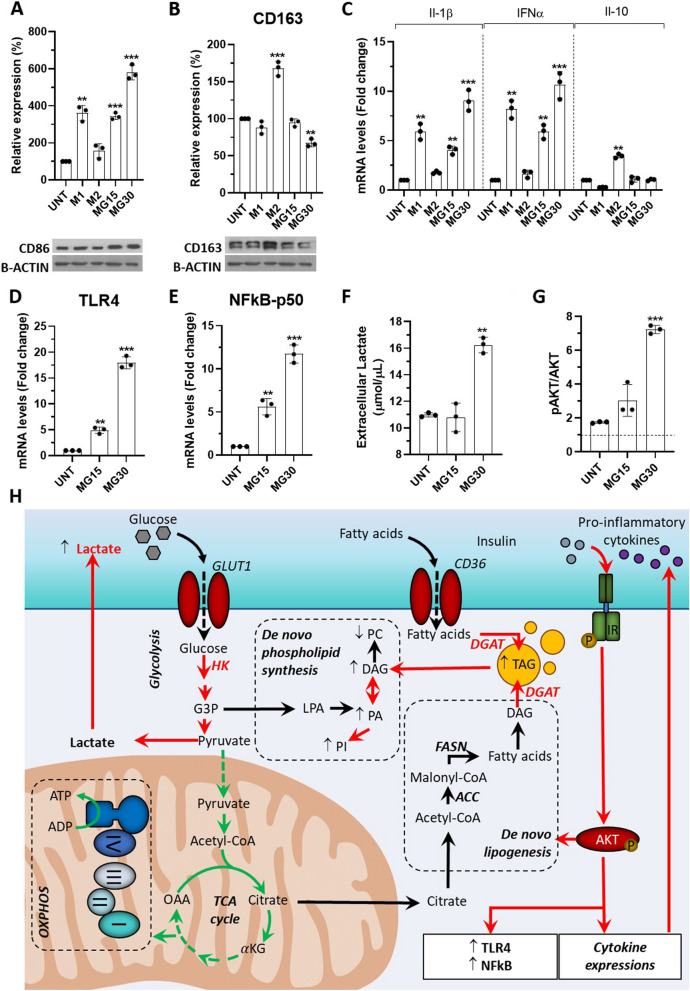
Background: Macrophages release not only cytokines but also extracellular vesicles (EVs). which are small membrane-derived nanovesicles with virus-like properties transferring cellular material between cells. Until now, the consequences of macrophage plasticity on the release and the composition of EVs have been poorly explored. In this study, we determined the impact of high-glucose (HG) concentrations on macrophage metabolism, and characterized their derived-EV subpopulations. Finally, we determined whether HG-treated macrophage-derived EVs participate in immune responses and in metabolic alterations of skeletal muscle cells.

Methods: THP1-macrophages were treated with 15mM (MG15) or 30mM (MG30) glucose. Then, M1/M2 canonical markers, pro- and anti-inflammatory cytokines, activities of proteins involved in glycolysis or oxidative phosphorylation were evaluated. Macrophage-derived EVs were characterized by TEM, NTA, MRSP, and 1H-Nuclear magnetic resonance spectroscopy for lipid composition. Macrophages or C2C12 muscle cells were used as recipients of MG15 and MG30-derived EVs. The lipid profiles of recipient cells were determined, as well as proteins and mRNA levels of relevant genes for macrophage polarization or muscle metabolism.

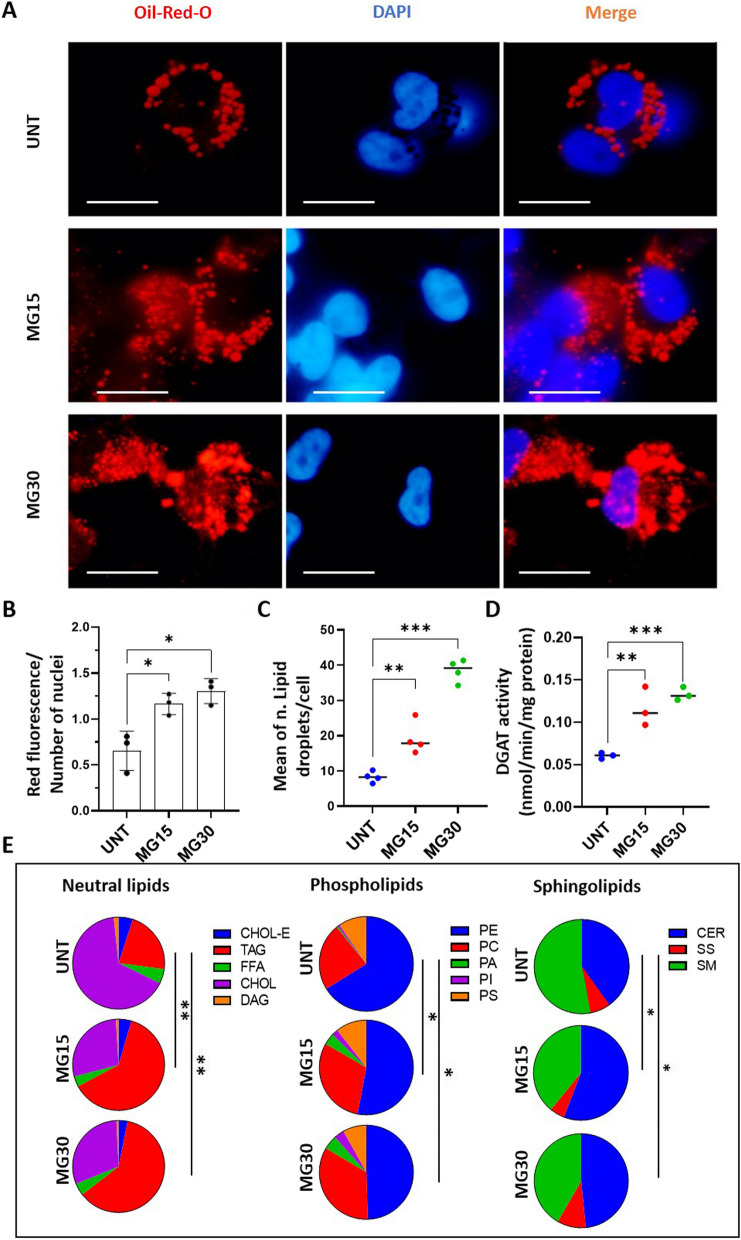
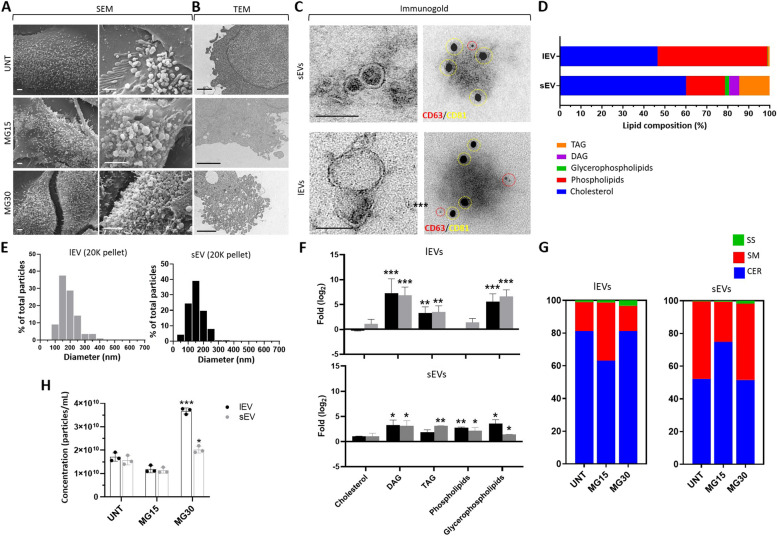
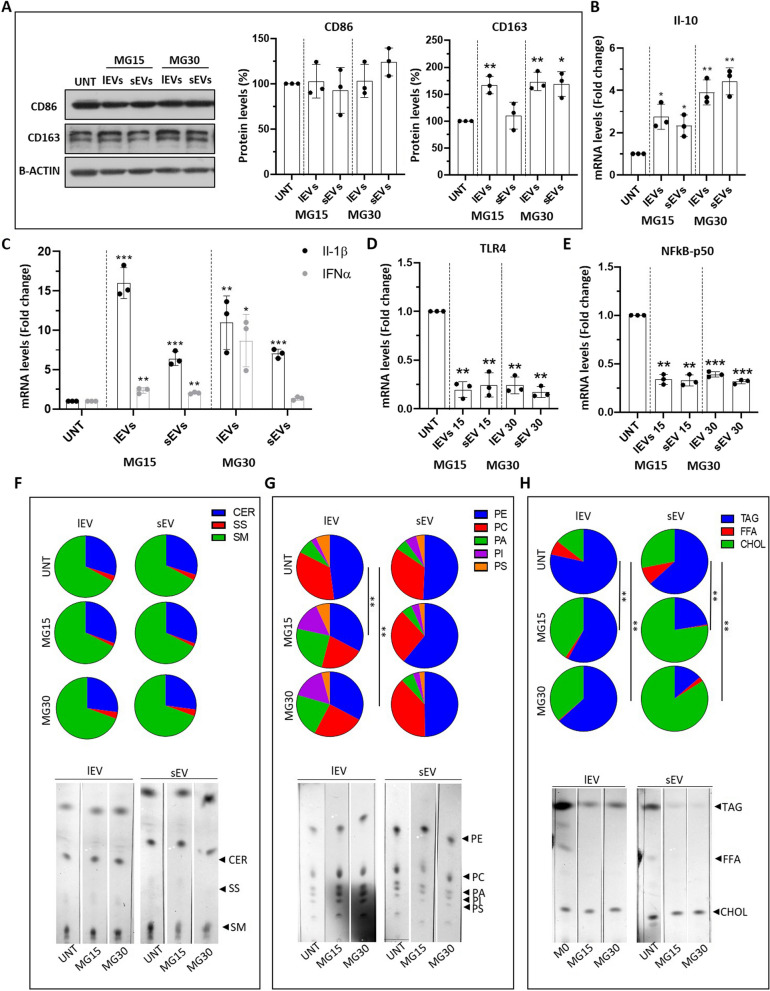
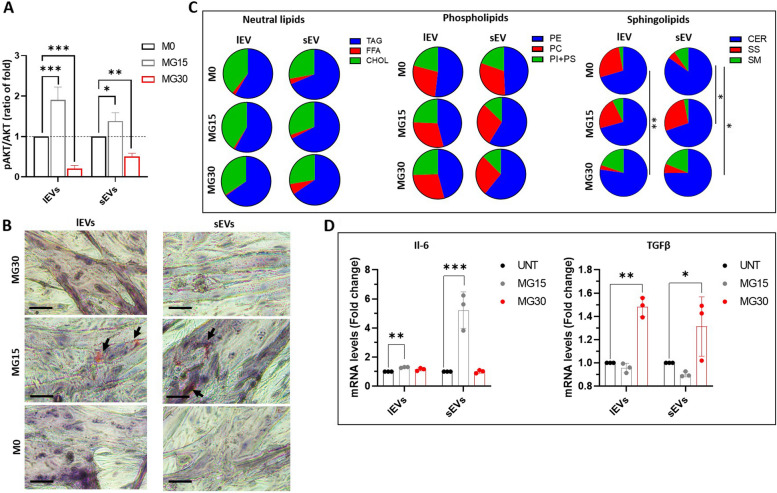
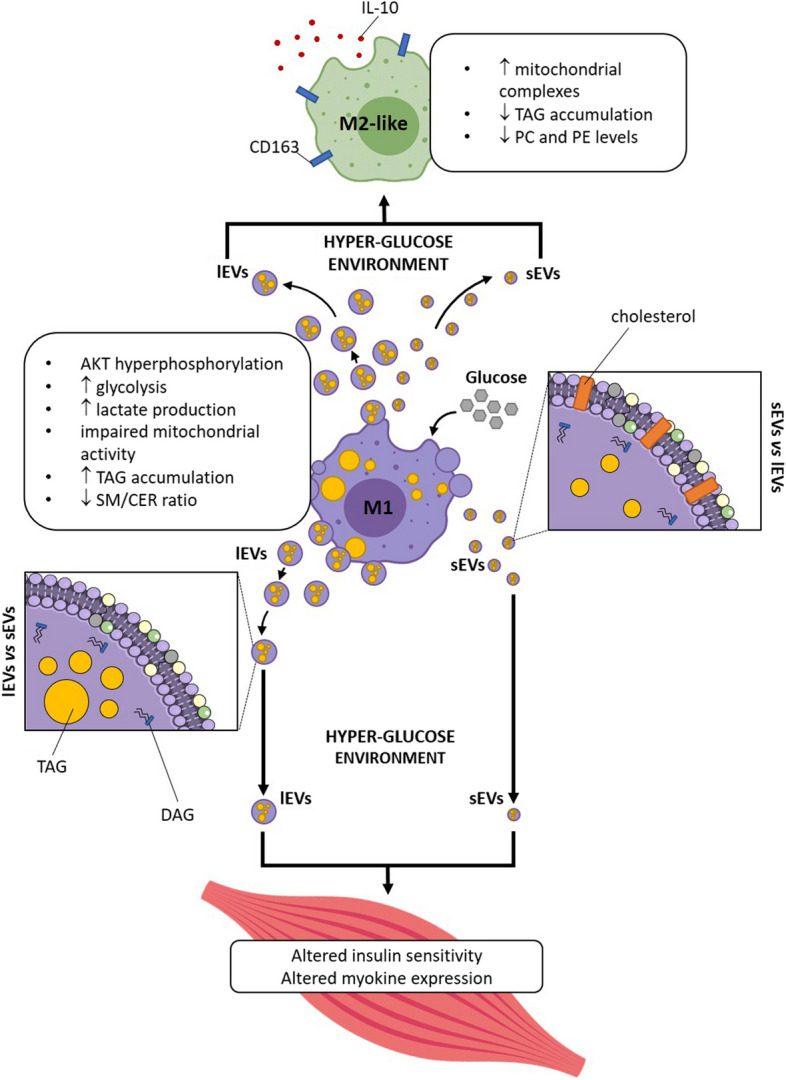
Results: Untreated macrophages released small and large EVs (sEVs, lEVs) with different lipid distributions. Proportionally to the glucose concentration, glycolysis was induced in macrophages, associated to mitochondrial dysfunction, triacylglycerol and cholesterol accumulation. In addition, MG15 and MG30 macrophages had increased level of CD86 and increase release of pro-inflammatory cytokines. HG also affected macrophage sphingolipid and phospholipid compositions. The differences in the lipid profiles between sEVs and lEVs were abolished and reflected the lipid alterations in MG15 and MG30 macrophages. Interestingly, MG15 and MG30 macrophages EVs induced the expression of CD163, Il-10 and increased the contents of triacylglycerol and cholesterol in recipient macrophages. MG15 lEVs and sEVs induced insulin-induced AKT hyper-phosphorylation and accumulation of triacylglycerol in myotubes, a state observed in pre-diabetes. Conversely, MG30 lEVs and sEVs induced insulin-resistance in myotubes.

Conclusions: As inflammation involves first M1 macrophages, then the activation of M2 macrophages to resolve inflammation, this study demonstrates that the dialog between macrophages through the EV route is an intrinsic part of the inflammatory response. In a hyperglycemic context, EV macrophages could participate in the development of muscle insulin-resistance and chronic inflammation.

Keywords: Extracellular vesicles; Hyperglycemia; Lipid metabolism; Macrophage; Oxidative phosphorylation; Skeletal muscle.


Conflict of interest statement

The authors declare no competing interests.

Figures

Fig. 1
Fig. 1
High-glucose induced M1 markers and cytokine production in macrophages. A-B Protein levels of CD86 and CD163 determined by WB. UNT=untreated macrophages, MG15= 15mM glucose, MG30= 30mM glucose. C mRNA levels of Il-1β, IFNα and Il-10. M1=THP-1-derived macrophages treated with IFNγ and lipopolysaccharide (LPS) were used as a positive control of M1 polarization, M2=THP-1-derived macrophages treated with IL-4, used as a positive control of M2 polarization. D toll-like receptor 4 (TLR4) and (E) subunit p-50-nuclear factor kappa-light-chain-enhancer of activated B cells (p50-NFkB) in macrophages. All RT-PCR data normalized to glyceraldehyde 3-phosphate dehydrogenase (GAPDH) mRNA level, then expressed as fold changes of untreated macrophages. F Lactate concentration in the macrophage-conditioned medium. G WB of phospho AKT in response to insulin, normalized to total AKT. H Summary of the effect of glucose treatement on macrophage lipid metabolism. In red, the reactions that are up-regulated and in green, the reactions that are down-regulated, in a glucose dependent manner, and validated in this study values are means ± SD (n = 3); p values are from student t-test (treated vs untreated), (*) p<0.05, (**) p<0.01, (***) p<0.001. ACC: acetyl-CoA carboxylase; aKG: α-ketoglutaric acid; AKT: protein kinase B; ADP: adenosine diphosphate; ATP: adenosine triphosphate; CD36: Cluster Determinant 36; DAG: diacylglycerol; DGAT: diacylglycerol acyltransferase 1/2; FASN: fatty acid synthase; G3P: glyceraldehyde 3 phosphate; GLUT1: glucose transporter 1; HK: hexokinase; IR: insulin receptor; LPA: lysophosphatidic acid; OAA: oxaloacetic acid; PA: phosphatidic acid; PC: phosphatidylcholine; PI: phosphatidylinositol; TAG: triacylglycerol; TCA: tricarboxylic acid
Fig. 2
Fig. 2
High-glucose concentrations modified macrophage lipid distribution. A Oil-red oil and DAPI staining of untreated macrophages (UNT) and MG15 and MG30 macrophages (scale bar=10mm). B Quantification of fluorescence intensity normalized to the number of nuclei. Three 3 images were taken per replicate and each dot in the graph is the mean these 3 image counts. C Number of lipid droplets per cells (n = 4), determined according to [32]. D Quantification of DGAT activity by using radio-labelled substrated. E Distribution of neutral lipids, phospholipids, and sphingolipids in untreated macrophages (UNT), and in MG15 and MG30 macrophages. Data are expressed as % of total lipids. Significantly different lipid distributions were identified with chi-squared tests. CHOL-E: cholesterol ester; TAG: triacylglycerol; FFA: free fatty acid; CHOL: cholesterol; DAG: diacylglycerol; PE: phosphatidylethanolamine; PC: phosphatidylcholine; PA: phosphatidic acid; PI: phosphatidylinositol; PS: phosphatidylserine; CER: ceramide; SS: sphingosine; SM: sphingomyelin; DGAT: diacylglycerol acyltransferase
Fig. 3
Fig. 3
Macrophage-released EV lipid composition and biogenesis are altered by HG treatments. A Representative SEM images of the surface of macrophages. B Representative TEM images of the membranes of macrophages (scale bar= 500nm). C TEM images of lEVs and sEVs released from untreated macrophages (left). C right, immunogold labelling of macrophage-derived EVs to detect CD63 and CD81 at the EV surface. Red= CD63, 5nm gold particles, yellow= CD81, 15nm gold particles (scale bar=100 nm). D Lipid distribution in lEVs and sEVs from untreated macrophages determined by 1H-NMR Spectroscopy. DAG: diacylglycerol; TAG: triacylglycerol. E Size distributions of lEVs and sEVs determined by Nanotracking Analyses (NTA) normalized to the total number of detected nanoparticles. F Lipid enrichment determined by1H-NMR, in lEVs and sEVs released from MG15 and MG30 macrophages compared to untreated macrophages. Values are expressed as log2 ratios of untreated macrophages. A representative 1H-NMR spectrum obtained at 600 MHz of CD3OD/CDCl3 lipid extracts of lEVs and sEVs is shown in Additional Fig. 4A-B. G Sphingolipid profile of lEVs and sEVs from untreated macrophages, MG15 and MG30 macrophages performed by thin layer chromatography. Representative TLC runs are shown in Additional Fig. 4C. H NTA quantification of lEVs and sEVs, expressed as particle/ml, released from untreated macrophages (UNT), MG15 and MG30 macrophages. Values are means ± SD (n = 3); p values are from student t-test (stimulated vs untreated), (*) p < 0.05, (**) p < 0.01, (***) p< 0.001. MG15=15 mM glucose, MG30=30 mM glucose
Fig. 4
Fig. 4
EVs from HG-treated macrophages affect macrophage polarization and lipid composition. A Quantification of CD86 and CD163 by WB. mRNA levels of interleukin 10 (Il-10) (B), interleukin 1β (Il-1β) interleukin 6 (Il-6), interferon α (INFα) (C), toll-like receptor 4 (TLR4) (D), and subunit p-50-nuclear factor kappa-light-chain-enhancer of activated B cell (p50-NFkB) (E), in macrophages treated with lEVs and sEV released from MG15 and MG30 macrophages. Data are normalized to glyceraldehyde 3-phosphate dehydrogenase (GAPDH) mRNA level and expressed as control. Values are means ± SD (n = 3); p values are from student t-test (EV treated vs untreated), (*) p < 0.05, (**) p< 0.01, (***) p< 0.001. (F) % of neutral lipids, (G) phospholipids and (H) sphingolipids in EV-treated macrophages. Significant distributions were identified by a chi-squared test. CER: ceramide; SS: sphingosine; SM: sphingomyelin; PE: phosphatidylethanolamine; PC: phosphatidylcholine; PA: phosphatidic acid; PI: phosphatidylinositol; PS: phosphatidylserine; TAG: triacylglycerol; FFA: free fatty acid; CHOL: cholesterol
Fig. 5
Fig. 5
EVs from high glucose-treated macrophages modulate muscle homeostasis. A Quantification of insulin-induced phosphorylated AKT in C2C12 myotubes pre-treated with lEVs and sEVs from untreated , MG15, or MG30 macrophages. Data are expressed as ratios (pAKT/AKT)EV treated/(pAKT/AKT)untreated. Images of the blot are shown in Additional file 5. B Lipid droplets detected by Oil-O-Red in C2C12 myotubes pre-treated with lEVs and sEVs from untreated, MG15 and MG30 macrophages (scale bar = 40µm). C TLC analyses of neutral lipids, phospholipids, and sphingolipids of C2C12 myotubes treated with lEVs and sEVs from untreated, MG15 and MG30 macrophages. Significant lipid distributions were identified by a chi-squared test. TAG: triacylglycerol; FFA: free fatty acid; CHOL: cholesterol; PE: phosphatidylethanolamine; PC: phosphatidylcholine; PI+PS: phosphatidylinositol+phosphatidylserine; CER: ceramide; SS: sphingosine; SM: sphingomyelin. D mRNA level of interleukin 6 (Il-6) and (E) of transforming growth factor β (TGFβ), in C2C12 myotubes treated with lEVs and sEVs from untreated, MG15, and MG30 macrophages. Data are normalized to TBP mRNA level, then are expressed as fold of controls. Values are means ± SD (n = 3); p values are from student t-test (EV treated vs untreated), (*) p< 0.05, (**) p< 0.01, (***) p< 0.001
Fig. 6
Fig. 6
Graphical summary of the main results of this study

References

    1. Buzas EI. The roles of extracellular vesicles in the immune system. Nat Rev Immunol. 2023;23:236–50. doi: 10.1038/s41577-022-00763-8. - DOI - PMC - PubMed
    1. Théry C, Witwer KW, Aikawa E, Alcaraz MJ, Anderson JD, Andriantsitohaina R et al. Minimal information for studies of extracellular vesicles 2018 (MISEV2018): a position statement of the International Society for Extracellular Vesicles and update of the MISEV2014 guidelines. J Extracell Vesicles. 2018;7(1):1535750. - PMC - PubMed
    1. Fordjour FK, Guo C, Ai Y, Daaboul GG, Gould SJ. A shared, stochastic pathway mediates exosome protein budding along plasma and endosome membranes. J Biol Chem. 2022;298(10):102394. - PMC - PubMed
    1. Durcin M, Fleury A, Taillebois E, Hilairet G, Krupova Z, Henry C, et al. Characterisation of adipocyte-derived extracellular vesicle subtypes identifies distinct protein and lipid signatures for large and small extracellular vesicles. J Extracell Vesicles. 2017;6:1305677. doi: 10.1080/20013078.2017.1305677. - DOI - PMC - PubMed
    1. Haraszti RA, Didiot MC, Sapp E, Leszyk J, Shaffer SA, Rockwell HE, et al. High-resolution proteomic and lipidomic analysis of exosomes and microvesicles from different cell sources. J Extracell Vesicles. 2016;5:32570. - PMC - PubMed

Publication types