. 2024 Feb 29;14(3):235.
doi: 10.3390/brainsci14030235.

Sensitivity and Specificity of Qualitative Visual Field Tests for Screening Visual Hemifield Deficits in Right-Brain-Damaged Stroke Patients

Affiliations

Sensitivity and Specificity of Qualitative Visual Field Tests for Screening Visual Hemifield Deficits in Right-Brain-Damaged Stroke Patients

Maria De Luca et al. Brain Sci. .

Abstract

A timely detection of visual hemifield deficits (VHFDs; hemianopias or quadrantanopias) is critical for both the diagnosis and treatment of stroke patients. The present study determined the sensitivity and specificity of four qualitative visual field tests, including face description, confrontation tests (finger wiggle), and kinetic boundary perimetry, to screen large and dense VHFDs in right-brain-damaged (RBD) stroke patients. Previously, the accuracy of qualitative visual field tests was examined in unselected samples of patients with heterogeneous aetiology, in which stroke patients represented a very small fraction. Building upon existing tests, we introduced some procedural ameliorations (incl. a novel procedure for kinetic boundary perimetry) and provided a scoresheet to facilitate the grading. The qualitative visual field tests' outcome of 67 consecutive RBD stroke patients was compared with the standard automated perimetry (SAP; i.e., reference standard) outcome to calculate sensitivity and specificity, as well as positive and negative predictive values (PPV and NPV), both for each individual test and their combinations. The face description test scored the lowest sensitivity and NPV, while the kinetic boundary perimetry scored the highest. No test returned false positives. Combining the monocular static finger wiggle test (by quadrants) and the kinetic boundary perimetry returned the highest sensitivity and specificity, in line with previous studies, but with higher accuracy (100% sensitivity and specificity). These findings indicate that the combination of these two tests is a valid approach with RBD stroke patients, prompting referral for a formal visual field examination, and representing a quick, easy-to-perform, and inexpensive tool for improving their care and prognosis.

Keywords: confrontation tests; hemianopia; kinetic boundary perimetry; quadrantanopia; right-brain stroke; sensitivity; specificity; visual field.


Conflict of interest statement

The authors declare no conflicts of interest.

Figures
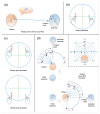
Figure 1
Figure 1
Sketch of the four qualitative visual field tests for illustrative purposes. (a) Face description test (performed separately for the right and left eye). (b) Binocular finger wiggle test. The panel shows the wiggling finger(s) at the height of the horizontal meridian, targeting the left and right hemifields from the patient’s perspective (who watches with both eyes open). (c) Monocular finger wiggle test. For either eye, the top panel shows the wiggling finger targeting the upper left quadrant from the patient’s perspective, while the bottom panel shows the wiggling finger targeting the lower left quadrant. Both the upper and lower quadrants are assessed in monocular vision. (d) Kinetic boundary perimetry. The test is performed separately for the right and left eye. Left panel—Bird’s-eye view of the patient’s position and visual field (blue arc). The red points (A, B, and C) illustrate exemplary positions of the red target (90°, 30°, and 0°, respectively; in blue) while testing a patient along the horizontal left meridian (180°; in green). Bottom panel—Side view of the patient’s position and visual field (blue arc). The red points (D and E) represent exemplary positions of the red target (90° and 60°, respectively; in blue) while testing a patient along the vertical upper meridian (90°; in green). Right panel—Projections of the target positions onto the scoring grid. The red points on the grid correspond to the red target positions shown in the left panel (points A, B, and C for the horizontal meridian 180°; in green), and in the bottom panel (points D and E for the vertical meridian 90°; in green). The patient’s head is shown to get a sense of the chief examiner’s perspective.
Figure 2
Figure 2
Sensitivity, specificity, PPV, and NPV for the combination of the Monocular finger wiggle test with the Kinetic boundary perimetry in the whole sample. The combination of these two qualitative visual field tests (sketched on the left) was used to screen visual hemifield deficits (VHFDs) in right-brain-damaged (RBD) stroke patients. When either screening test detected a deficit (green tick marks), the outcome was “presence of a VHFD” (VHFD+). When neither detected a deficit (red crosses), the outcome was “absence of a VHFD” (VHFD−). The screening outcome (VHFD+ or VHFD− by rows) was compared with the standard automated perimetry (SAP; reference standard) outcome (VHFD+ and VHFD− by columns) to determine the number of true/false positive/negative cases (shown in the four boxes), on which the four metrics of screening accuracy (sensitivity, specificity, PPV, and NPV) were computed. Sensitivity and specificity pertain to the screening tests, and represent the probability that their outcome corresponds to the reference standard outcome. Positive and negative predictive values (PPV and NPV) pertain to the patient level, and refer to the clinical performance of a screening test (i.e., the likelihood that a patient truly affected is screened as affected, and that a truly unaffected patient is screened as unaffected, respectively; e.g., [36]). The combination of these qualitative visual field tests achieved values equal to 100% for all the four metrics.

References

    1. Cassidy T.P., Bruce D.W., Gray C.S. Visual field loss after stroke: Confrontation and perimetry in the assessment of recovery. J. Stroke Cerebrovasc. Dis. 2001;10:113–117. doi: 10.1053/jscd.2001.25457. - DOI - PubMed
    1. Jariyakosol S., Jaru-Ampornpan P., Manassakorn A., Itthipanichpong R., Hirunwiwatkul P., Tantisevi V., Somkijrungroj T., Rojanapongpun P. Sensitivity and specificity of new visual field screening software for diagnosing hemianopia. Eye Brain. 2021;13:231–238. doi: 10.2147/EB.S315403. - DOI - PMC - PubMed
    1. Rowe F.J., Wright D., Brand D., Jackson C., Harrison S., Maan T., Scott C., Vogwell L., Peel S., Akerman N., et al. A prospective profile of visual field loss following stroke: Prevalence, type, rehabilitation, and outcome. Biomed. Res. Int. 2013;2013:719096. doi: 10.1155/2013/719096. - DOI - PMC - PubMed
    1. Rowe F.J., VIS writing Group Vision in stroke cohort: Profile overview of visual impairment. Brain Behav. 2017;7:e00771. doi: 10.1002/brb3.771. - DOI - PMC - PubMed
    1. Suchoff I.B., Kapoor N., Ciuffreda K.J., Rutner D., Han E., Craig S. The frequency of occurrence, types, and characteristics of visual field defects in acquired brain injury: A retrospective analysis. Optometry. 2008;79:259–265. doi: 10.1016/j.optm.2007.10.012. - DOI - PubMed

LinkOut - more resources