

Simvastatin-Mediated Nrf2 Activation Induces Fetal Hemoglobin and Antioxidant Enzyme Expression to Ameliorate the Phenotype of Sickle Cell Disease
- PMID: 38539870
- PMCID: PMC10968127
- DOI: 10.3390/antiox13030337
Simvastatin-Mediated Nrf2 Activation Induces Fetal Hemoglobin and Antioxidant Enzyme Expression to Ameliorate the Phenotype of Sickle Cell Disease
Abstract
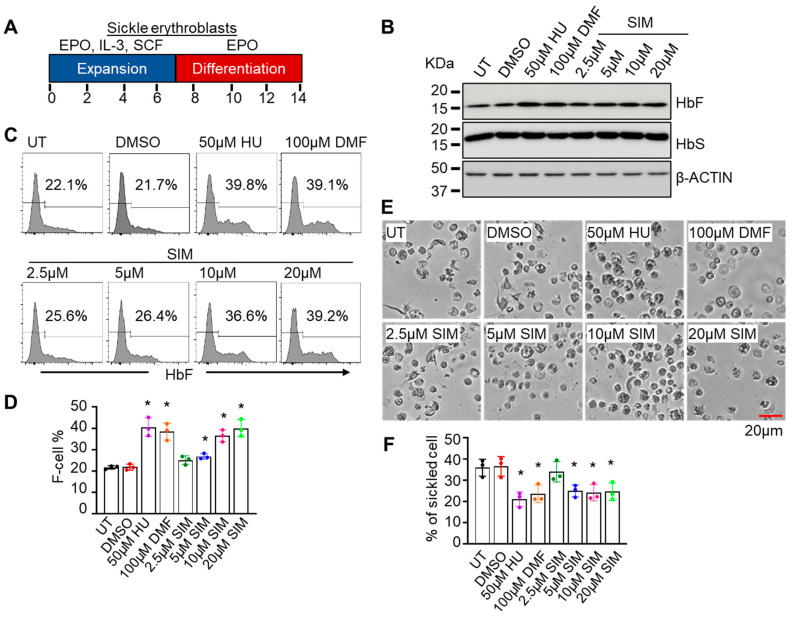
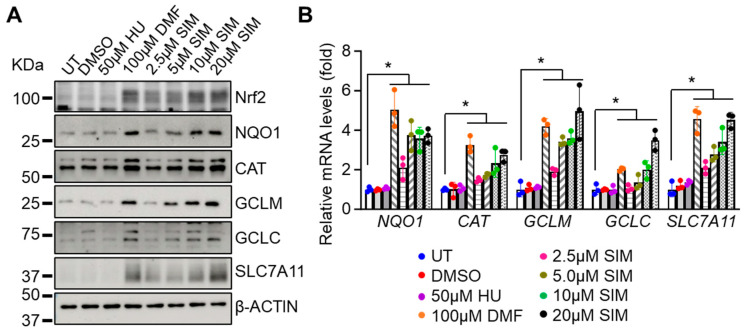
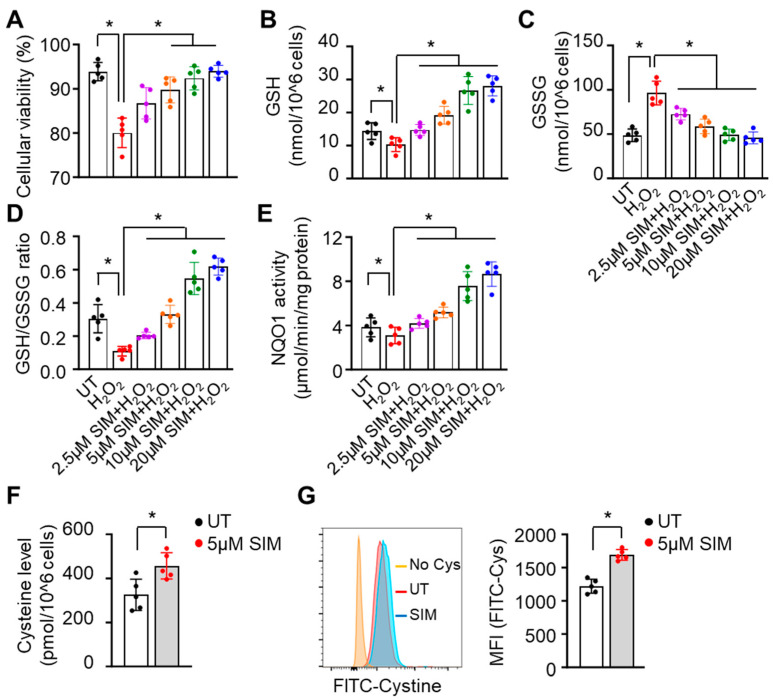
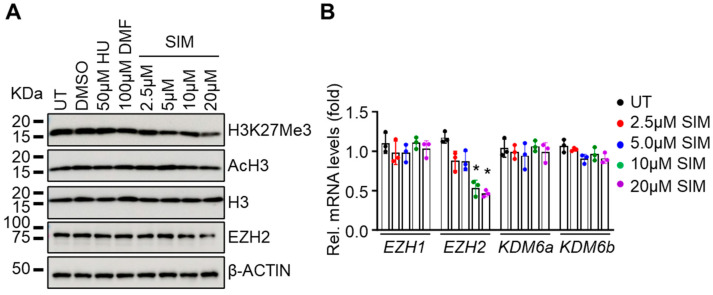
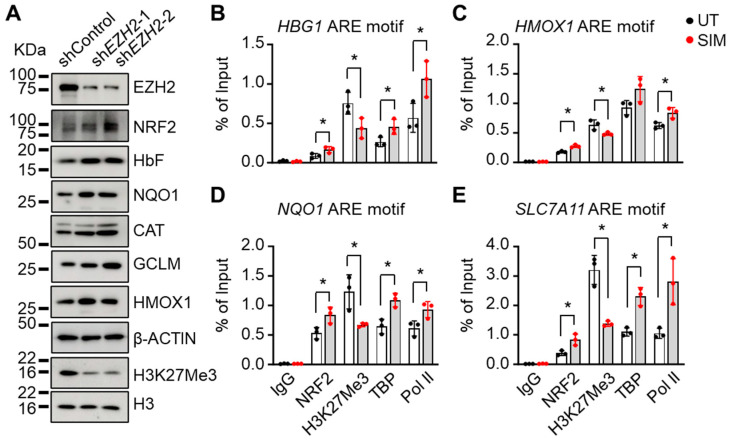
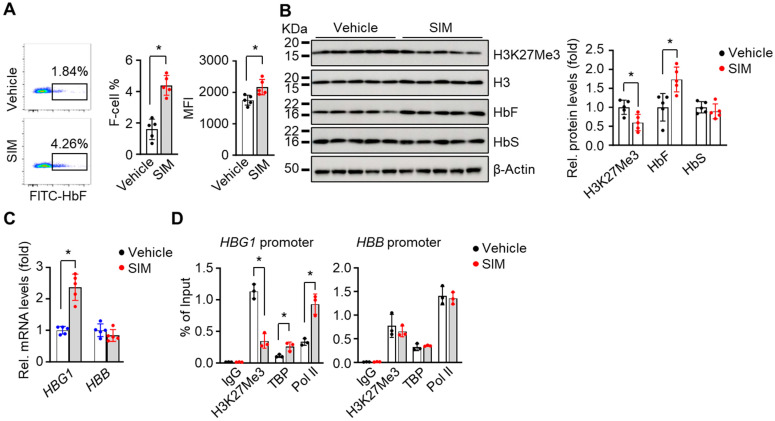
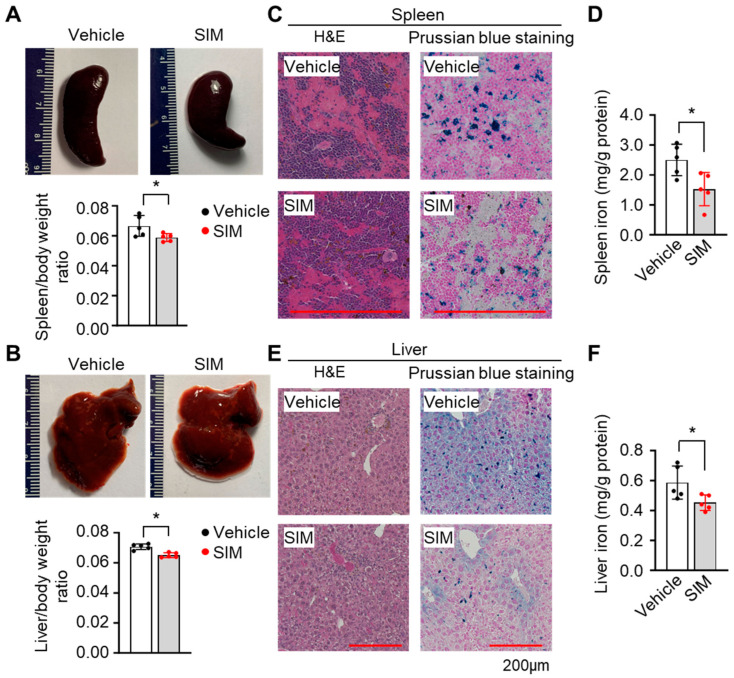
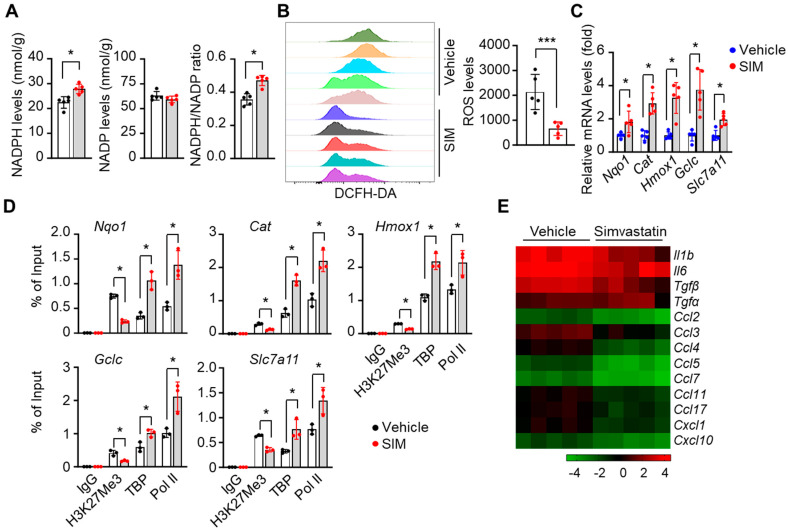
Sickle cell disease (SCD) is a pathophysiological condition of chronic hemolysis, oxidative stress, and elevated inflammation. The transcription factor Nrf2 is a master regulator of oxidative stress. Here, we report that the FDA-approved oral agent simvastatin, an inhibitor of hydroxymethyl-glutaryl coenzyme A reductase, significantly activates the expression of Nrf2 and antioxidant enzymes. Simvastatin also induces fetal hemoglobin expression in SCD patient primary erythroid progenitors and a transgenic mouse model. Simvastatin alleviates SCD symptoms by decreasing hemoglobin S sickling, oxidative stress, and inflammatory stress in erythroblasts. Particularly, simvastatin increases cellular levels of cystine, the precursor for the biosynthesis of the antioxidant reduced glutathione, and decreases the iron content in SCD mouse spleen and liver tissues. Mechanistic studies suggest that simvastatin suppresses the expression of the critical histone methyltransferase enhancer of zeste homolog 2 to reduce both global and gene-specific histone H3 lysine 27 trimethylation. These chromatin structural changes promote the assembly of transcription complexes to fetal γ-globin and antioxidant gene regulatory regions in an antioxidant response element-dependent manner. In summary, our findings suggest that simvastatin activates fetal hemoglobin and antioxidant protein expression, modulates iron and cystine/reduced glutathione levels to improve the phenotype of SCD, and represents a therapeutic strategy for further development.
Keywords: Nrf2; enhancer of zeste homolog 2; fetal hemoglobin; histone methylation; oxidative stress; sickle cell disease; simvastatin.
Conflict of interest statement
The authors declare no conflicts of interest.
Figures
Similar articles
-
Mechanisms of NRF2 activation to mediate fetal hemoglobin induction and protection against oxidative stress in sickle cell disease.Exp Biol Med (Maywood). 2019 Feb;244(2):171-182. doi: 10.1177/1535370219825859. Epub 2019 Jan 23. Exp Biol Med (Maywood). 2019. PMID: 30674214 Free PMC article. Review.
-
Loss of NRF2 function exacerbates the pathophysiology of sickle cell disease in a transgenic mouse model.Blood. 2018 Feb 1;131(5):558-562. doi: 10.1182/blood-2017-10-810531. Epub 2017 Dec 18. Blood. 2018. PMID: 29255069 Free PMC article.
-
Keap1-Nrf2 Heterodimer: A Therapeutic Target to Ameliorate Sickle Cell Disease.Antioxidants (Basel). 2023 Mar 17;12(3):740. doi: 10.3390/antiox12030740. Antioxidants (Basel). 2023. PMID: 36978988 Free PMC article. Review.
-
Dimethyl fumarate increases fetal hemoglobin, provides heme detoxification, and corrects anemia in sickle cell disease.JCI Insight. 2017 Oct 19;2(20):e96409. doi: 10.1172/jci.insight.96409. JCI Insight. 2017. PMID: 29046485 Free PMC article.
-
Proteasome inhibition induces both antioxidant and hb f responses in sickle cell disease via the nrf2 pathway.Hemoglobin. 2014;38(3):188-95. doi: 10.3109/03630269.2014.898651. Epub 2014 Mar 26. Hemoglobin. 2014. PMID: 24670032 Clinical Trial.
Cited by
-
Bioactive Compounds Protect Mammalian Reproductive Cells from Xenobiotics and Heat Stress-Induced Oxidative Distress via Nrf2 Signaling Activation: A Narrative Review.Antioxidants (Basel). 2024 May 13;13(5):597. doi: 10.3390/antiox13050597. Antioxidants (Basel). 2024. PMID: 38790702 Free PMC article. Review.
-
Innovations in Drug Discovery for Sickle Cell Disease Targeting Oxidative Stress and NRF2 Activation-A Short Review.Int J Mol Sci. 2025 Apr 28;26(9):4192. doi: 10.3390/ijms26094192. Int J Mol Sci. 2025. PMID: 40362428 Free PMC article. Review.
References
-
- Rodgers G.P., Walker E.C., Podgor M.J. Mortality in sickle cell disease. N. Engl. J. Med. 1994;331:1022–1023. - PubMed
-
- Silva D.G.H., Belini Junior E., de Almeida E.A., Bonini-Domingos C.R. Oxidative stress in sickle cell disease: An overview of erythrocyte redox metabolism and current antioxidant therapeutic strategies. Free Radic. Biol. Med. 2013;65:1101–1109. doi: 10.1016/j.freeradbiomed.2013.08.181. - DOI - PubMed
Grants and funding
LinkOut - more resources
Full Text Sources
Other Literature Sources
