

Estimating Mineral Requirements of Wild Herbivores: Modelling Arctic Caribou (Rangifer tarandus granti) in Summer
- PMID: 38539965
- PMCID: PMC10967348
- DOI: 10.3390/ani14060868
Estimating Mineral Requirements of Wild Herbivores: Modelling Arctic Caribou (Rangifer tarandus granti) in Summer
Abstract
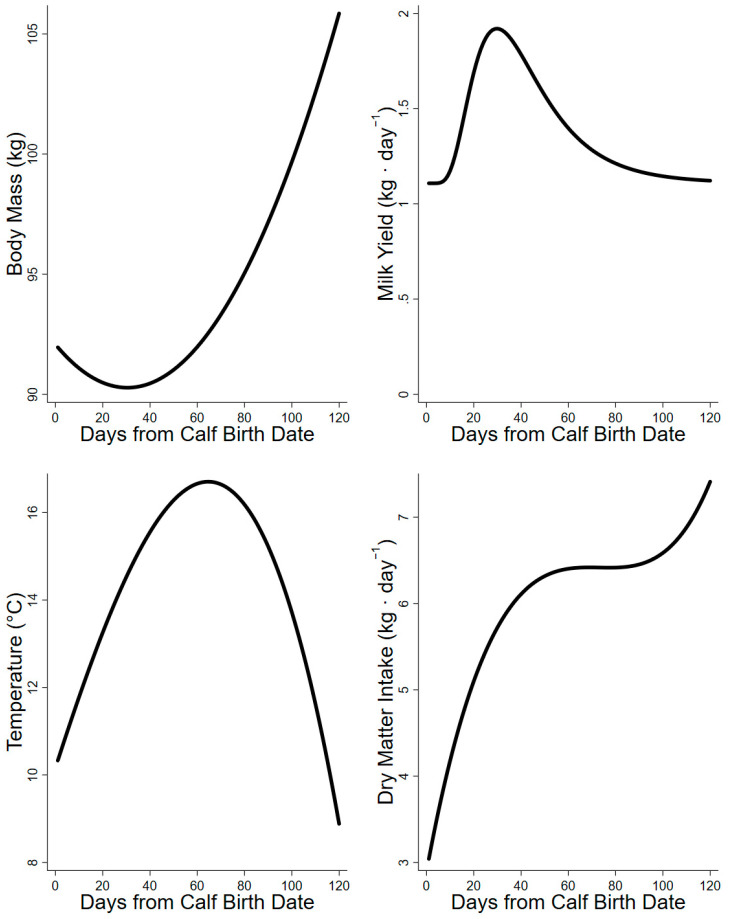
Mineral requirements are poorly described for most wildlife. Consequently, the role of forage minerals in movement and productivity are poorly understood for sedentary and migratory ungulates, such as reindeer and caribou (Rangifer tarandus). We applied estimates of maintenance, lactation, body mass change, and antler growth to production curves (body mass, daily intake, and milk yield) for female caribou to calculate their mineral requirements over summer. The total requirements (mg or g·d-1) were divided by the daily intake (kg·d-1) to estimate the minimum concentration of minerals required in the diet (mg or g·kg-1) to balance demand. The daily requirements (mg·d-1) of all minerals increased from parturition to the end of summer. The minimum dietary concentrations (mg·kg-1) of macro-minerals (Ca, P, Mg, Na, K) declined as food intake (kg·d-1) increased over summer. The minimum dietary concentrations (Fe, Mn, Cu, Zn) were heavily influenced by body mass gain, which increased through late lactation even though food intakes rose. Our modeling framework can be applied to other wild ungulates to assess the impacts of changing forage phenology, plant community compositions, or environmental disturbances on movement and productivity.
Keywords: factorial model; nutritional ecology; production; reproduction; ungulate.
Conflict of interest statement
The authors declare no conflicts of interests related to the development of this work. Any use of trade, firm, or product names is for descriptive purposes only and does not imply endorsement by either the authors of their institutions.
Figures


References
-
- Suttle N.F. Mineral Nutrition of Livestock. 4th ed. CABI; Wallingford, UK: 2010. p. 587.
-
- Kaspari M. The invisible hand of the periodic table: How micronutrients shape ecology. Annu. Rev. Ecol. Evol. Syst. 2021;52:199–219. doi: 10.1146/annurev-ecolsys-012021-090118. - DOI
-
- McDowell L.R. Minerals in Animal and Human Nutrition. Elsevier Science; Amsterdam, The Netherland: 2003.
-
- Barboza P.S., Parker K.L., Hume I.D. Integrative Wildlife Nutrition. Springer; Heidelberg, Germany: 2009. p. 342. 119 illustrations.
-
- Spears J.W. Minerals in forages. In: Fahey G.C.J., editor. Forage Quality, Evaluation, and Utilization. American Society of Agronomy; Madison, WI, USA: 1994. pp. 281–317.
Grants and funding
LinkOut - more resources
Full Text Sources
