. 2024 Mar 13;12(3):633.
doi: 10.3390/biomedicines12030633.

Immune Analysis Using Vitreous Optical Coherence Tomography Imaging in Rats with Steroid-Induced Glaucoma

Affiliations

Immune Analysis Using Vitreous Optical Coherence Tomography Imaging in Rats with Steroid-Induced Glaucoma

Maria J Rodrigo et al. Biomedicines. .

Abstract

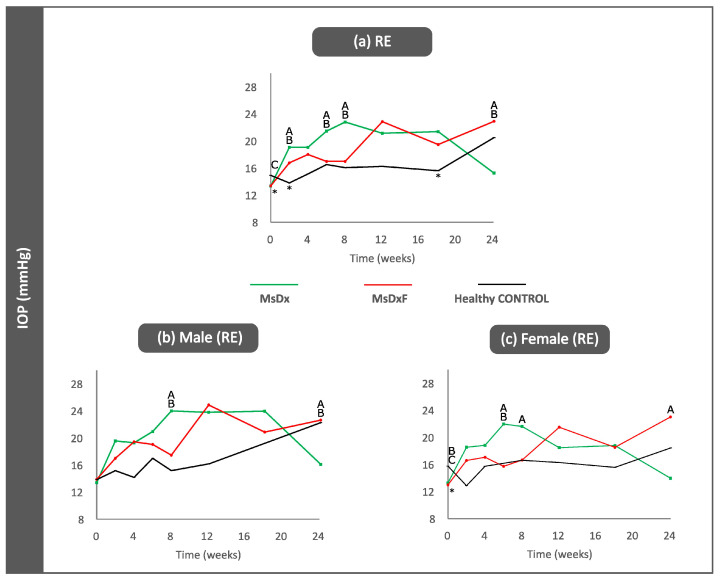
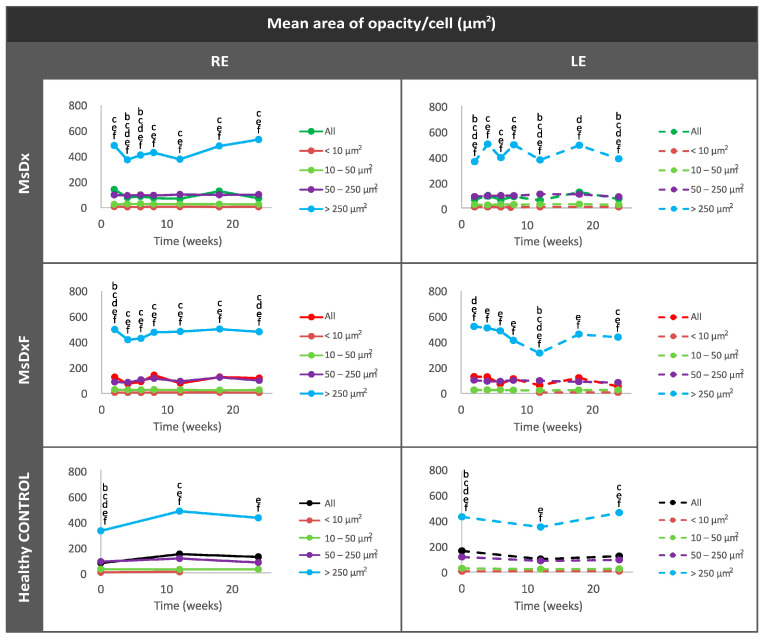
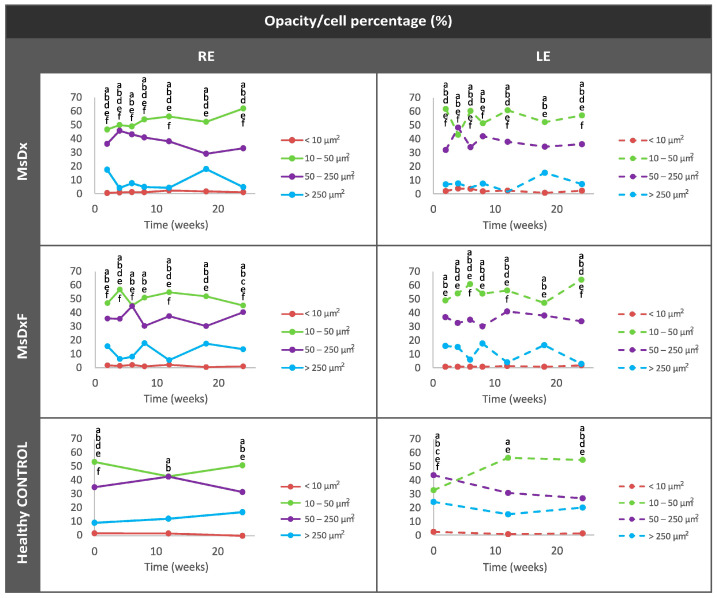
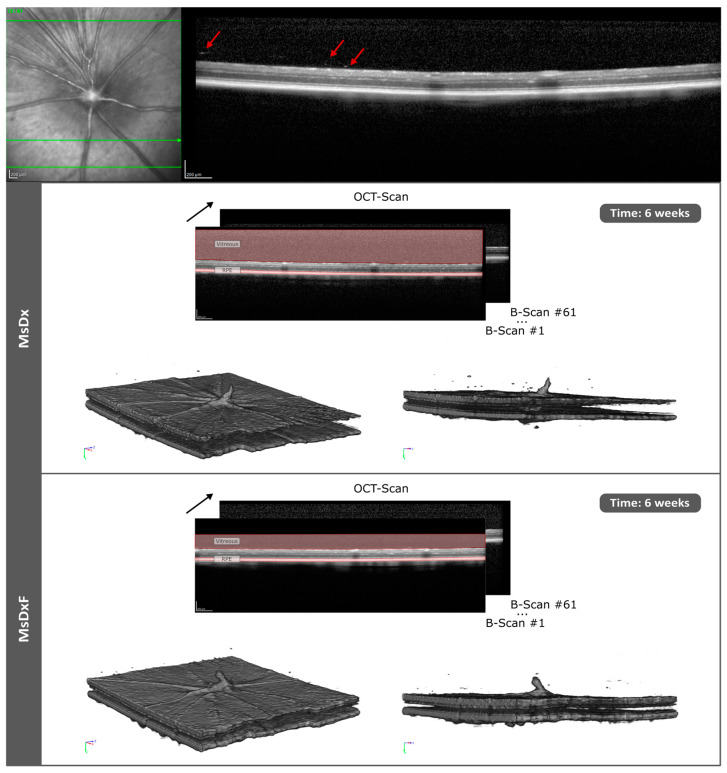
Glaucoma is a multifactorial pathology involving the immune system. The subclinical immune response plays a homeostatic role in healthy situations, but in pathological situations, it produces imbalances. Optical coherence tomography detects immune cells in the vitreous as hyperreflective opacities and these are subsequently characterised by computational analysis. This study monitors the changes in immunity in the vitreous in two steroid-induced glaucoma (SIG) animal models created with drug delivery systems (microspheres loaded with dexamethasone and dexamethasone/fibronectin), comparing both sexes and healthy controls over six months. SIG eyes tended to present greater intensity and a higher number of vitreous opacities (p < 0.05), with dynamic fluctuations in the percentage of isolated cells (10 µm2), non-activated cells (10-50 µm2), activated cells (50-250 µm2) and cell complexes (>250 µm2). Both SIG models presented an anti-inflammatory profile, with non-activated cells being the largest population in this study. However, smaller opacities (isolated cells) seemed to be the first responder to noxa since they were the most rounded (recruitment), coinciding with peak intraocular pressure increase, and showed the highest mean Intensity (intracellular machinery), even in the contralateral eye, and a major change in orientation (motility). Studying the features of hyperreflective opacities in the vitreous using OCT could be a useful biomarker of glaucoma.

Keywords: animal models; glaucoma; inflammation; optical coherence tomography; vitreous body.


Conflict of interest statement

Authors L.E.P. and M.S. were employed by the company Biotech Vision SLP (Spin-Off Company). The remaining authors declare that the research was conducted in the absence of any commercial or financial relationships that could be construed as potential conflicts of interest. The funders had no role in the design of the study; in the collection, analyses, or interpretation of data; in the writing of the manuscript; or in the decision to publish the results.

Figures

Figure 2
Figure 2
Intraocular pressure curves (right eyes) in two steroid-induced glaucoma models and healthy controls for all right eyes (a), for the right eyes of the males (b) and for the right eyes of the females (c). Abbreviations: MsDx: cohort with microspheres loaded with dexamethasone; MsDxF: cohort with microspheres loaded with dexamethasone and fibronectin injected into the anterior chamber; IOP: intraocular pressure (data extracted from [37,38]). *: statistical significance (p < 0.05) between glaucoma models and healthy controls (ANOVA); A: significant differences between MsDx and MsDxF; B: significant differences between MsDx and healthy controls; C: significant differences between MsDxF and healthy controls.
Figure 3
Figure 3
VIT/RPE signal intensity. (a) Right eye from both sexes; (b) Left eye from both sexes; (c) males; (d) females. Abbreviations: RE: right eye; LE: left eye; MsDx: cohort with microspheres loaded with dexamethasone (green); MsDxF: cohort with microspheres loaded with dexamethasone and fibronectin injected into the anterior chamber (red); healthy CONTROL: cohort of healthy animals non intervented (black); VIT: vitreous; RPE: retinal pigment epithelium. A: significant differences between MsDx and MsDxF.
Figure 4
Figure 4
Changes in total immune response (a) and cellular quantification (b) in both steroid-induced glaucoma and healthy control animals. Abbreviations: RE: right eye; LE: left eye; MsDx: cohort with microspheres loaded with dexamethasone; MsDxF: cohort with microspheres loaded with dexamethasone and fibronectin injected into the anterior chamber; n: number; *: statistical significance (p < 0.05), using ANOVA test.
Figure 5
Figure 5
Cell subdivisions based on the mean area of vitreous opacities measured using OCT. Statistically significant differences (p < 0.05) were highlighted with alphabetic markers as follows: a (group 1–group 2), b (group 1–group 3), c (group 1–group 4), d (group 2–group 3), e (group 2–group 4) and f (group 3–group 4). Abbreviations: MsDx: cohort with microspheres loaded with dexamethasone; MsDxF: cohort with microspheres loaded with dexamethasone and fibronectin injected into the anterior chamber; isolated cells: < 10 µm2 (group 1); non-activated cells: 10–50 µm2 (group 2); activated cells: 50–250 µm2 (group 3); cell complexes: >250 µm2 (group 4).
Figure 6
Figure 6
Changes in the vitreous immune population (opacities) in both steroid-induced glaucoma and healthy control animals throughout 6 months. Abbreviations: MsDx: cohort with microspheres loaded with dexamethasone; MsDxF: cohort with microspheres loaded with dexamethasone and fibronectin injected into the anterior chamber; isolated cells: opacities < 10 µm2 (group 1); non-activated cells: 10–50 µm2 (group 2); activated cells: 50–250 µm2 (group 3); cell complexes: >250 µm2 (group 4). Data represented as percentages. Statistically significant differences (p < 0.05) were highlighted with alphabetic markers as follows: a (group 1–group 2), b (group 1–group 3), c (group 1–group 4), d (group 2–group 3), e (group 2–group 4) and f (group 3–group 4).
Figure 7
Figure 7
Mean eccentricity of vitreous opacity detected using in vivo OCT, according to size, in both steroid-induced glaucoma and healthy control animals. Indirect study of cell soma morphology. Abbreviations: MsDx: cohort with microspheres loaded with dexamethasone; MsDxF: cohort with microspheres loaded with dexamethasone and fibronectin injected into anterior chamber; isolated cells: opacities < 10 µm2 (group 1); non-activated cells: 10–50 µm2 (group 2); activated cells: 50–250 µm2 (group 3); cell complexes: >250 µm2 (group 4). Statistically significant differences (p < 0.05) were highlighted with alphabetic markers as follows: a (group 1–group 2), b (group 1–group 3), c (group 1–group 4), d (group 2–group 3), e (group 2–group 4) and f (group 3–group 4).
Figure 8
Figure 8
Mean intensity of opacities/cells based on size in both steroid-induced glaucoma and healthy control animals. Abbreviations: MsDx: cohort with microspheres loaded with dexamethasone; MsDxF: cohort with microspheres loaded with dexamethasone and fibronectin injected into the anterior chamber; isolated cells: opacities < 10 µm2; non-activated cells: 10–50 µm2; activated cells: 50–250 µm2; cell complexes: >250 µm2. Statistically significant differences (p < 0.05) were highlighted with alphabetic markers as follows: a (group 1–group 2), b (group 1–group 3) and c (group 1–group 4). Mean Orientation of the Opacities/Cells.
Figure 9
Figure 9
Mean orientation of vitreous opacity detected using OCT, according to size, in both steroid-induced glaucoma and healthy control animals. In vivo analysis for motility. Abbreviations: MsDx: cohort with microspheres loaded with dexamethasone; MsDxF: cohort with microspheres loaded with dexamethasone and fibronectin injected into the anterior chamber; isolated cells: opacities < 10 µm2 (group 1); non-activated cells: 10–50 µm2 (group 2); activated cells: 50–250 µm2 (group 3); cell complexes: >250 µm2 (group 4). Statistically significant differences (p < 0.05) were highlighted with alphabetic markers as follows: a (group 1–group 2), b (group 1–group 3), c (group 1–group 4), e (group 2–group 4) and f (group 3–group 4).
Figure 1
Figure 1
OCT scan and 3D reconstruction of 61 right-eye B-scans in two models of steroid-induced glaucoma at 6 weeks’ follow-up. The black arrow indicates image sequencing by optical coherence tomography (serial slices). Abbreviations: MsDx: cohort with microspheres loaded with dexamethasone; MsDxF: cohort with microspheres loaded with dexamethasone and fibronectin injected into the anterior chamber; OCT: optical coherence tomography; RPE: retinal pigment epithelium. Red arrows show the vitreous opacities.

Similar articles

References

    1. Quigley H., Broman A.T. The number of people with glaucoma worldwide in 2010 and 2020. Br. J. Ophthalmol. 2006;90:262–267. doi: 10.1136/bjo.2005.081224. - DOI - PMC - PubMed
    1. Yang X., Zeng Q., Göktaş E., Gopal K., Al-Aswad L., Blumberg D.M., Cioffi G.A., Liebmann J.M., Tezel G. T-Lymphocyte Subset Distribution and Activity in Patients With Glaucoma. Investig. Ophthalmol. Vis. Sci. 2019;60:877–888. doi: 10.1167/iovs.18-26129. - DOI - PMC - PubMed
    1. Jiang S., Kametani M., Chen D.F. Adaptive Immunity: New Aspects of Pathogenesis Underlying Neurodegeneration in Glaucoma and Optic Neuropath. Front. Immunol. 2020;11:65. doi: 10.3389/fimmu.2020.00065. - DOI - PMC - PubMed
    1. Jonas J.B., Aung T., Bourne R.R., Bron A.M., Ritch R., Panda-Jonas S. Glaucoma. Lancet. 2017;390:2183–2193. doi: 10.1016/S0140-6736(17)31469-1. - DOI - PubMed
    1. Lau L.I., Liu C.J.L., Chou J.C.K., Hsu W.M., Liu J.H. Patterns of visual field defects in chronic angle-closure glaucoma with different disease severity. Ophthalmology. 2003;110:1890–1894. doi: 10.1016/S0161-6420(03)00666-3. - DOI - PubMed

LinkOut - more resources