

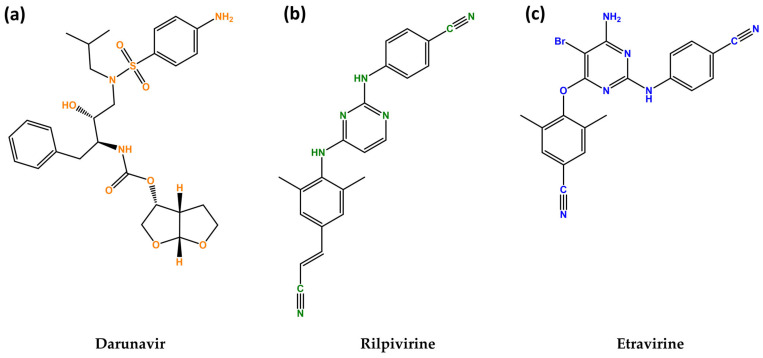
Exploring Darunavir, Rilpivirine and Etravirine as Potential Therapies for Bladder Cancer: Efficacy and Synergistic Effects
- PMID: 38540260
- PMCID: PMC10968266
- DOI: 10.3390/biomedicines12030647
Exploring Darunavir, Rilpivirine and Etravirine as Potential Therapies for Bladder Cancer: Efficacy and Synergistic Effects
Abstract
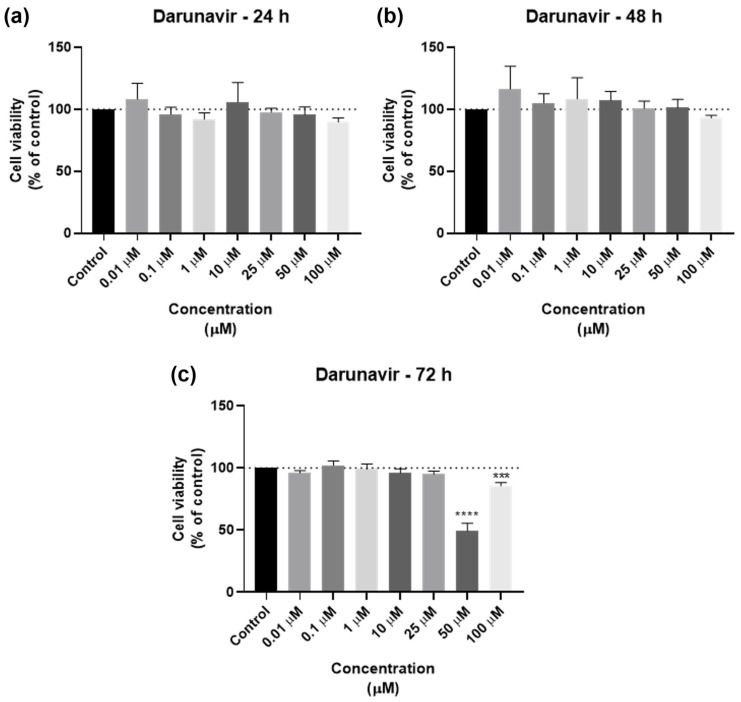
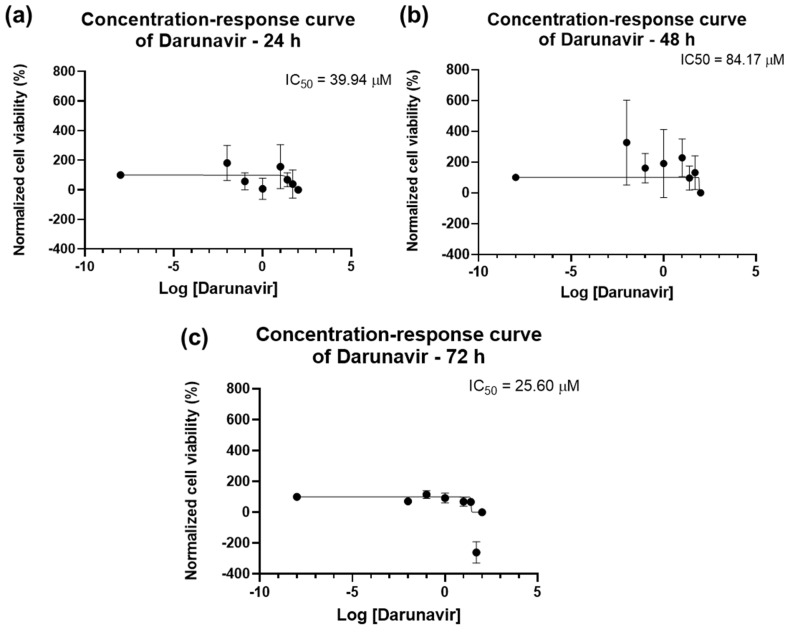
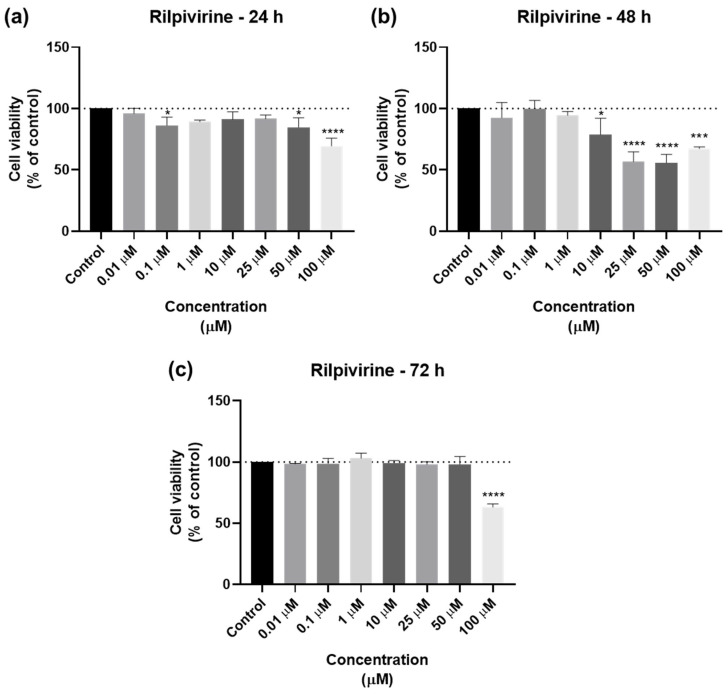
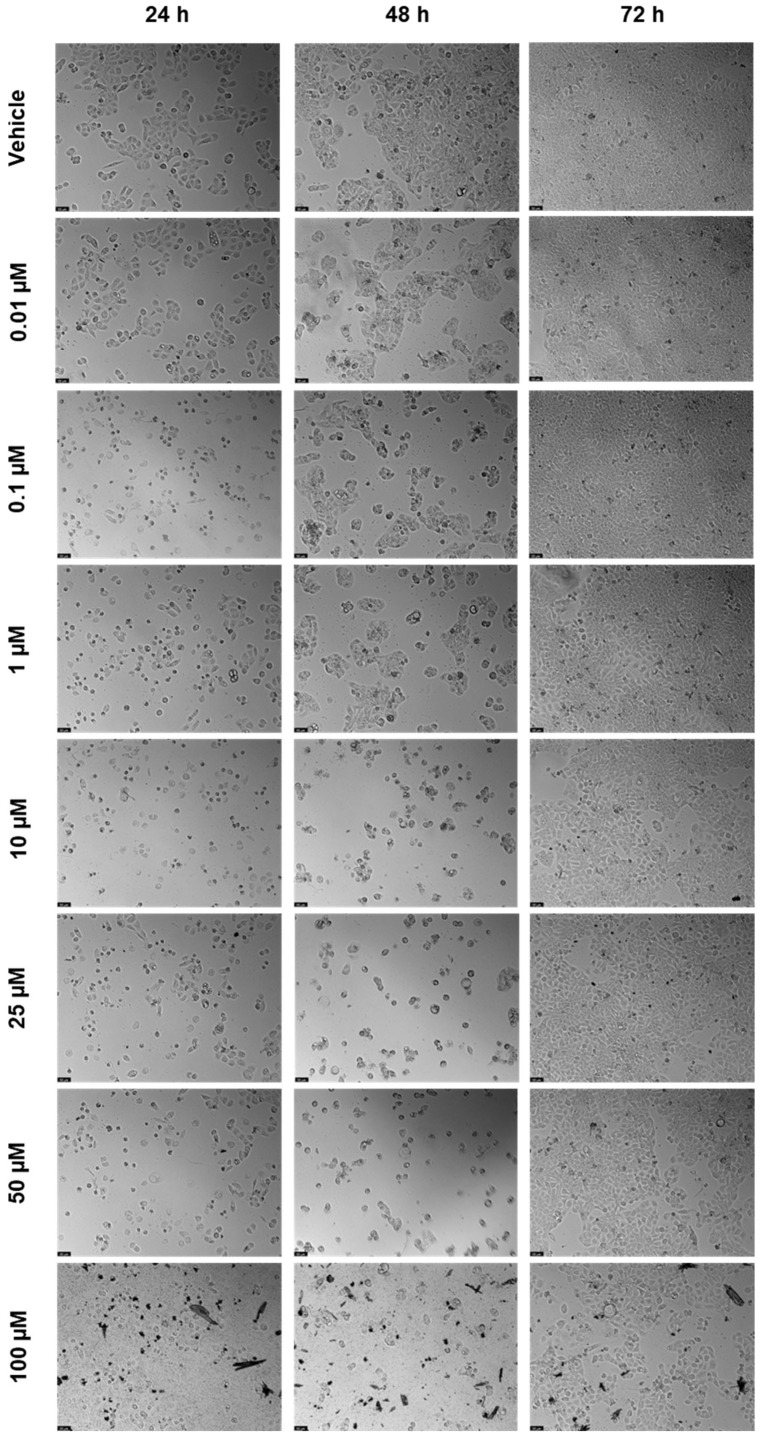
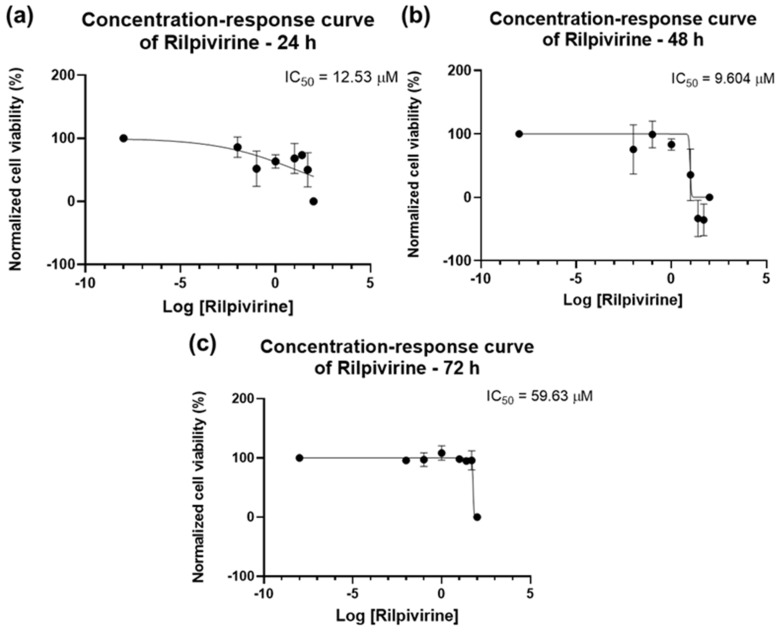
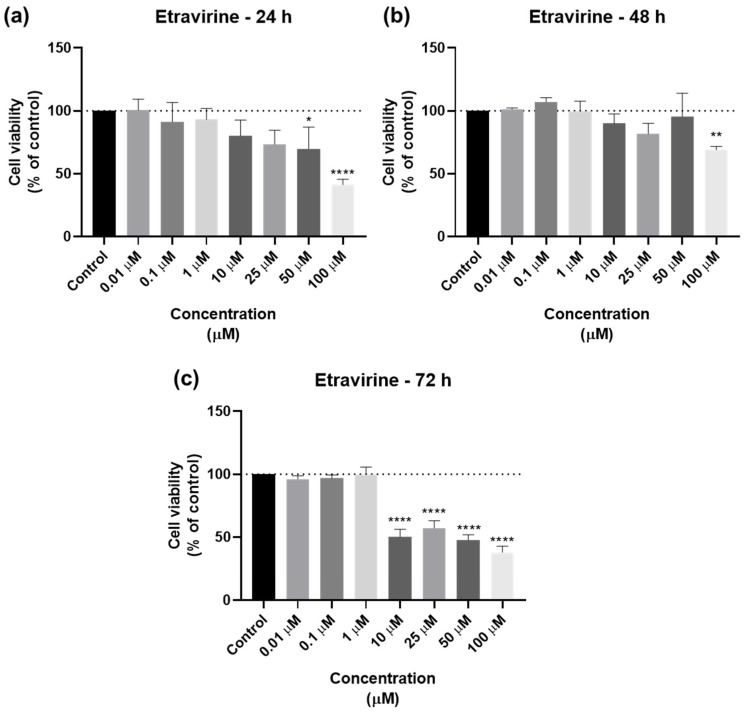
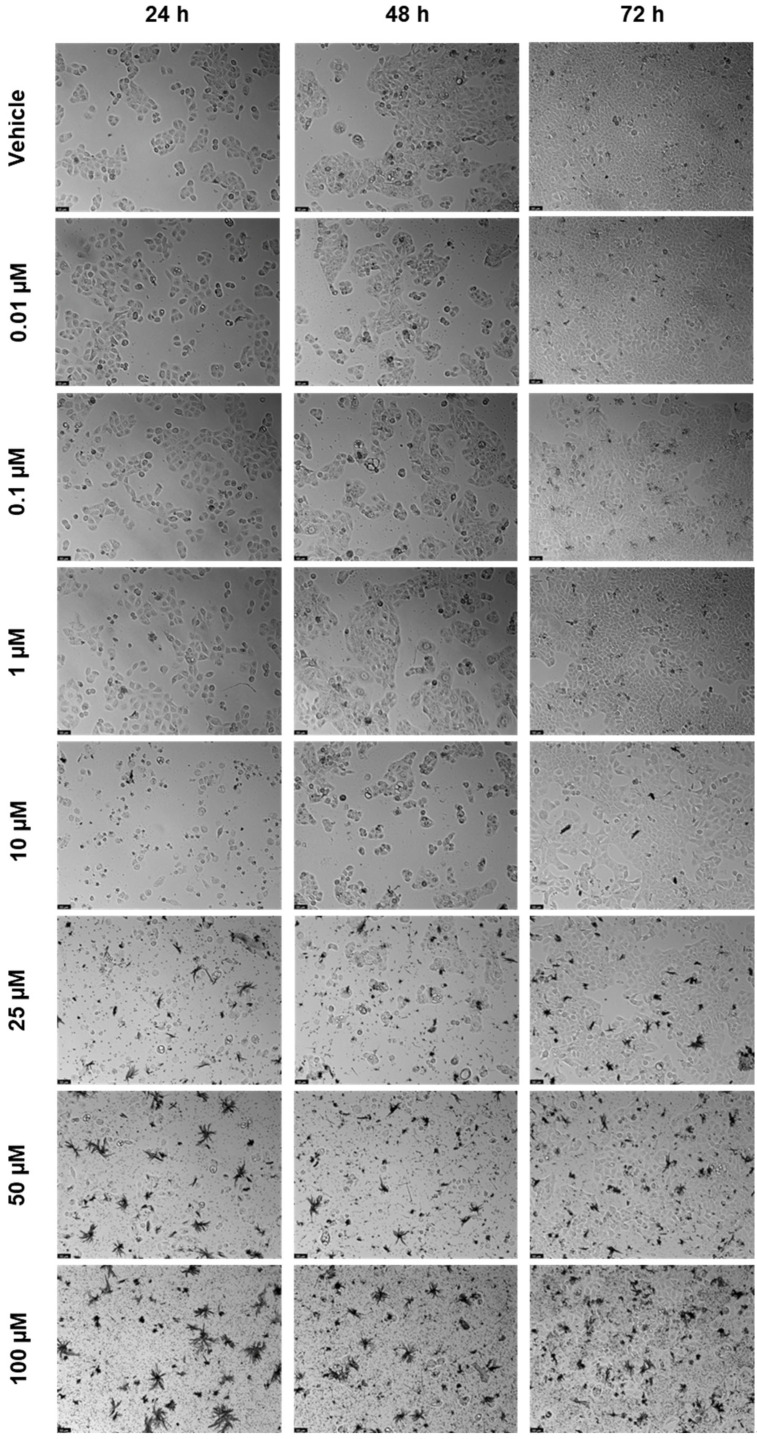
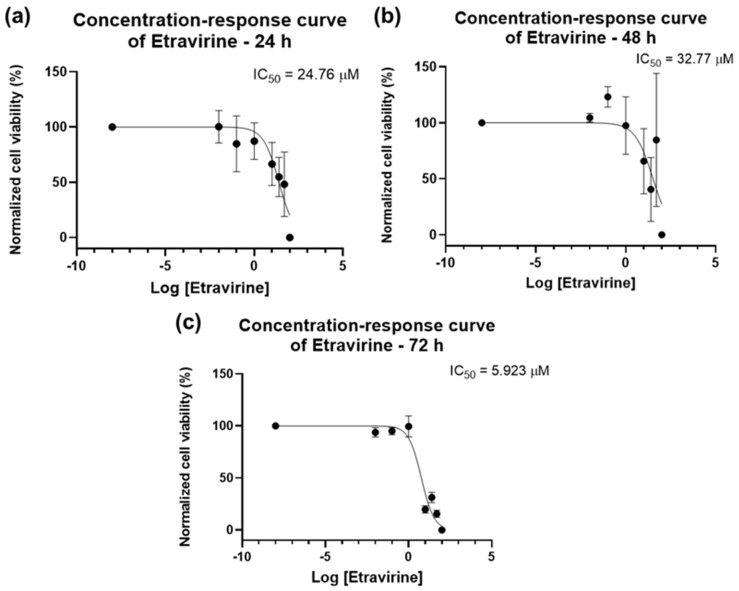
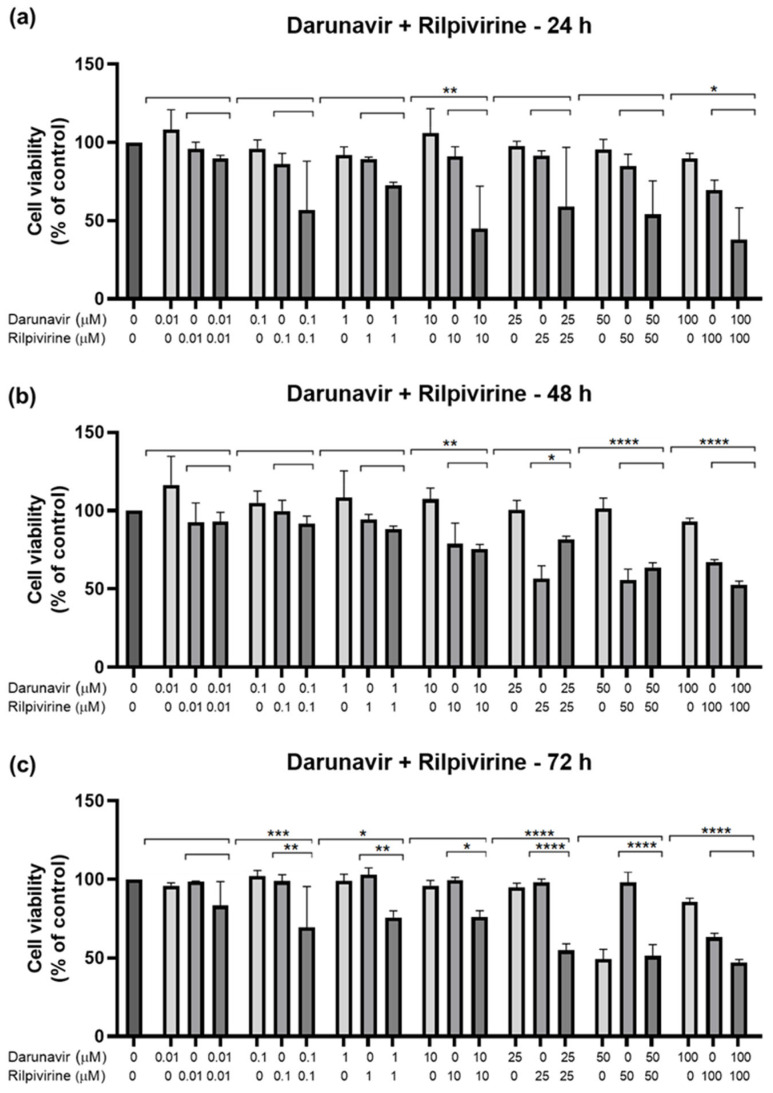
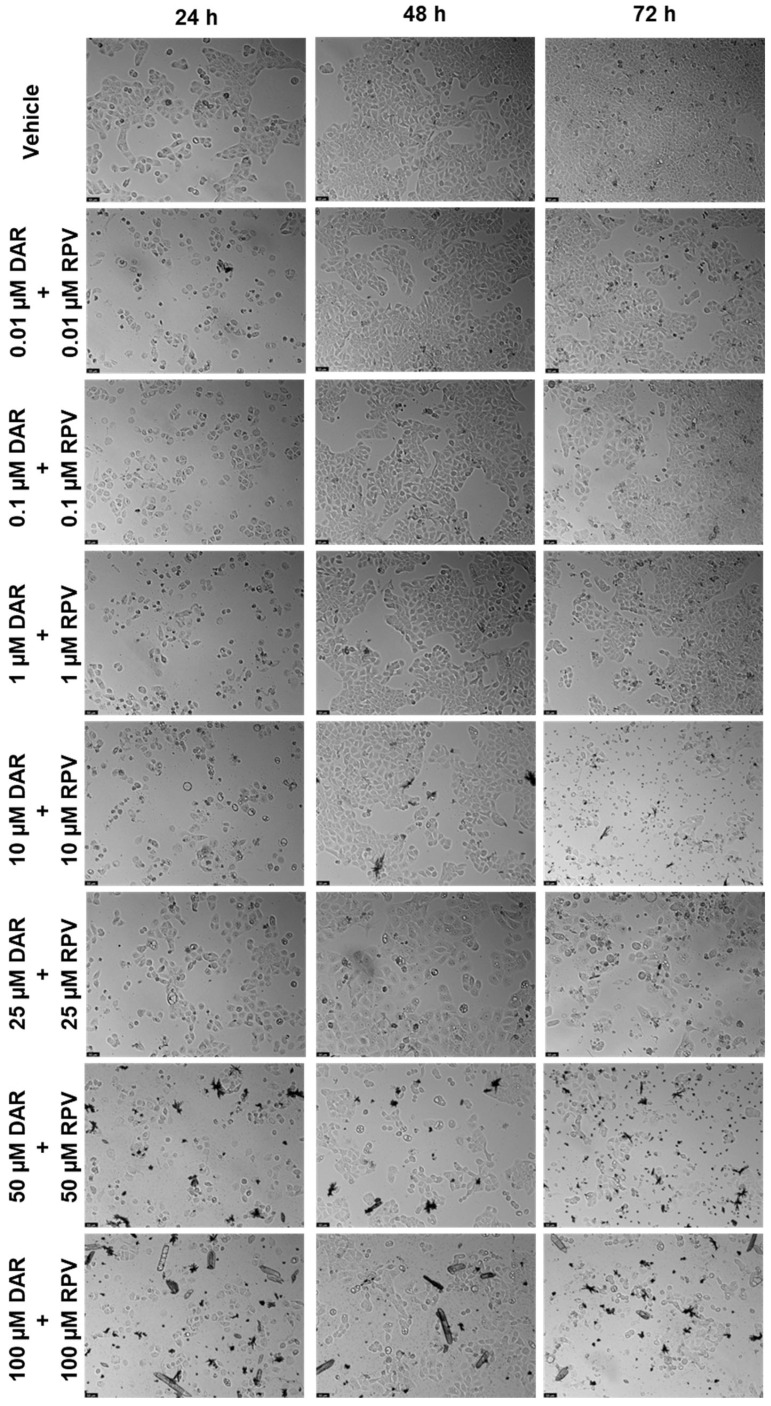
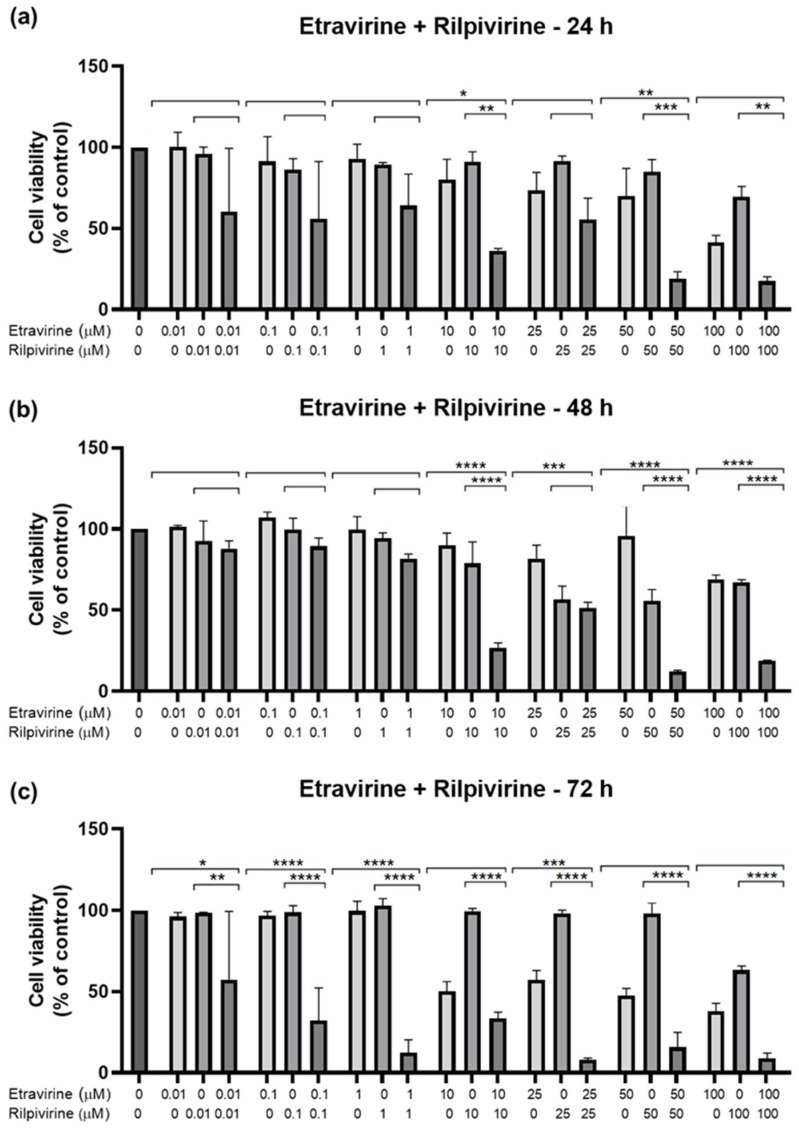
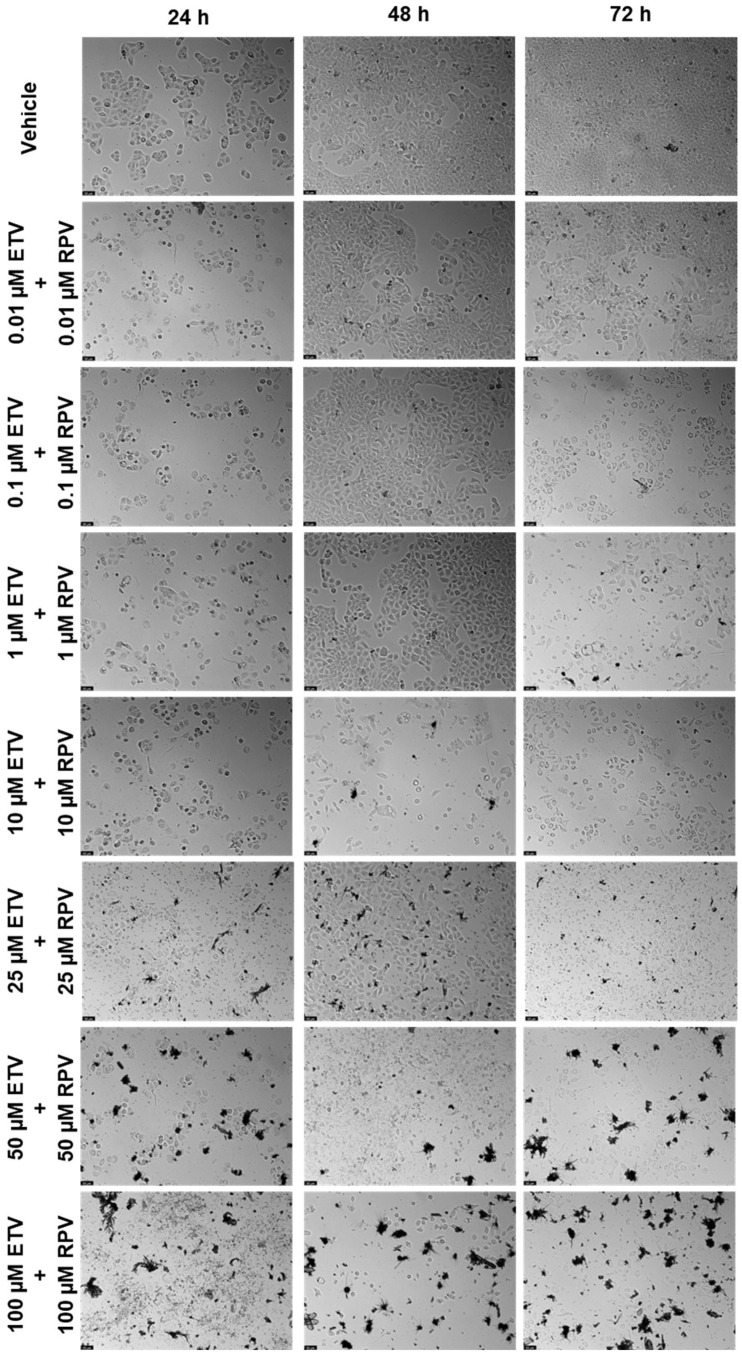
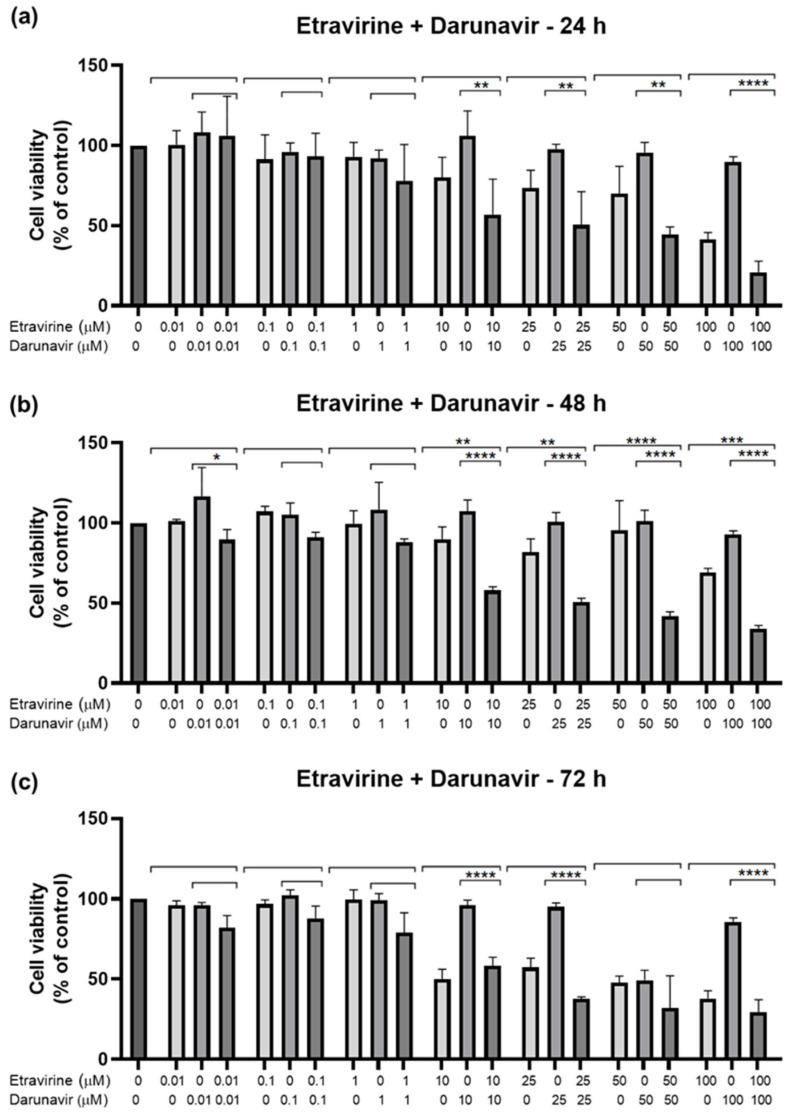
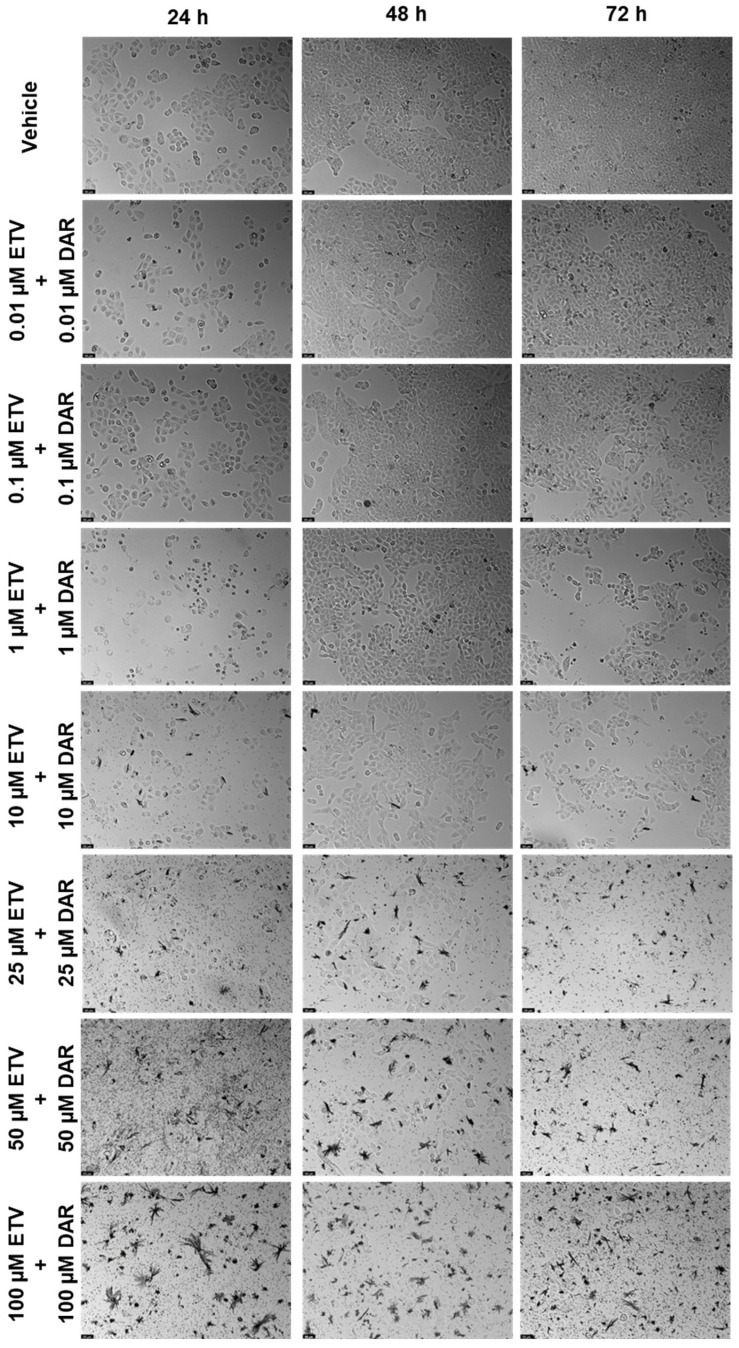
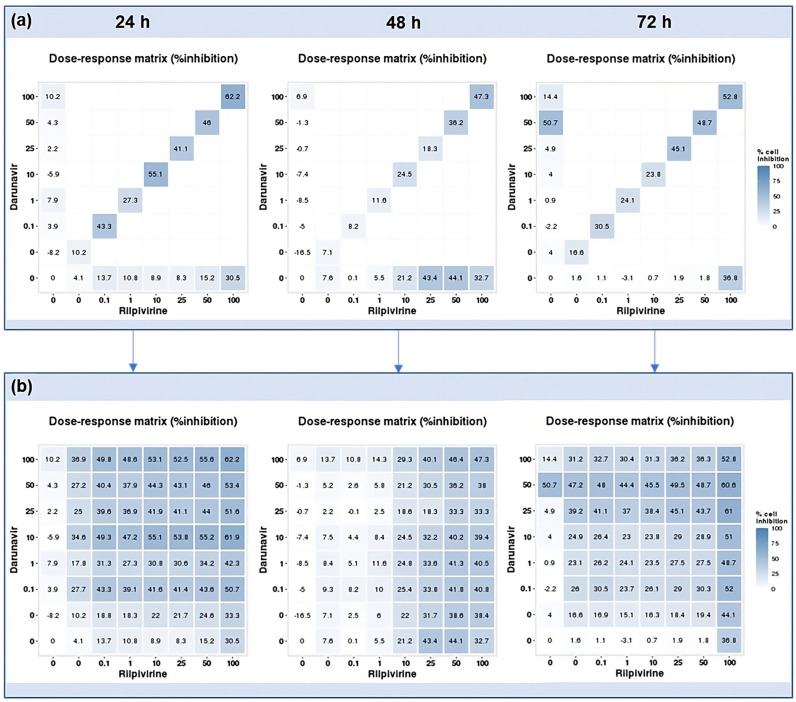
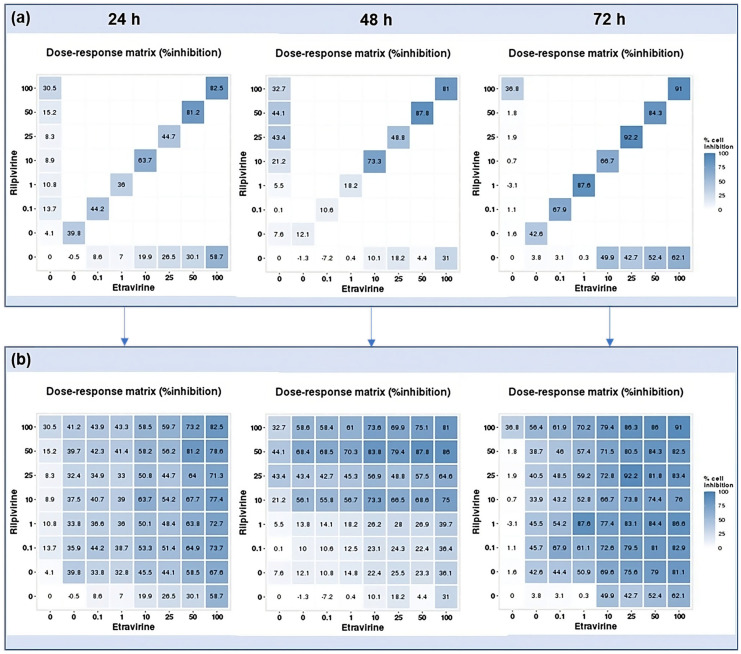
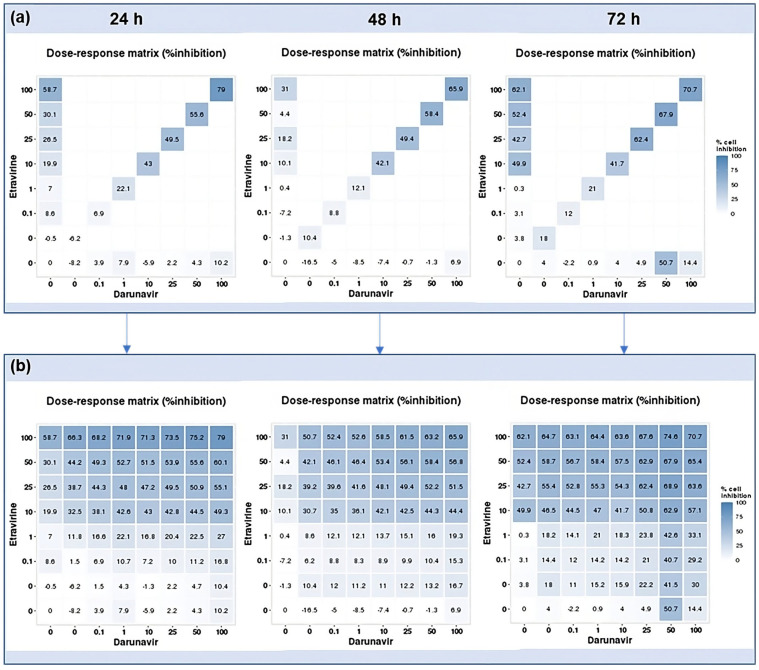
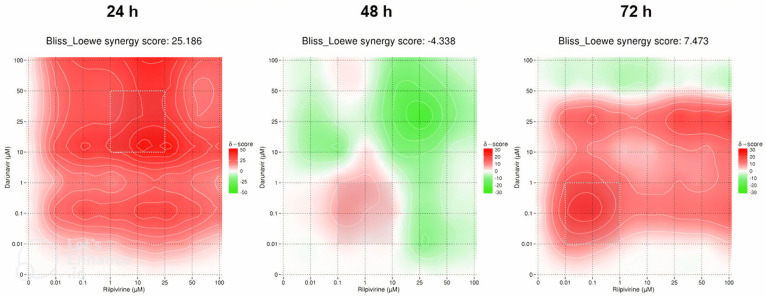
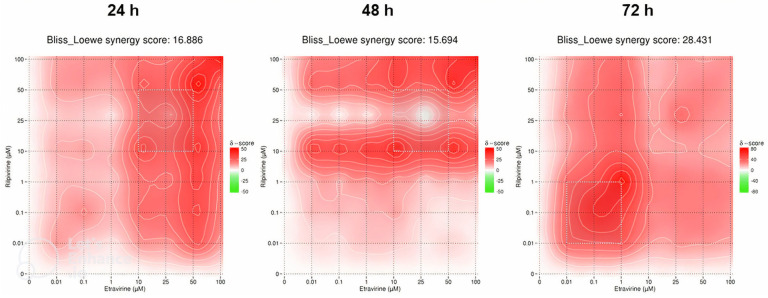
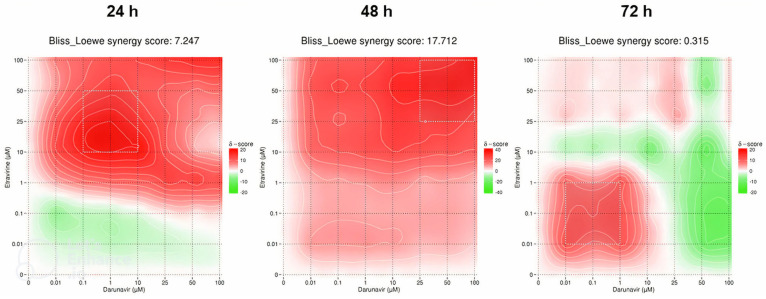
This research explores the therapeutic efficacy of Darunavir (DRV), Rilpivirine (RPV), and Etravirine (ETV) against UM-UC-5 bladder cancer cells, addressing the critical need for innovative treatments in bladder cancer research. Through a comprehensive assessment of their individual and combined effects across diverse time intervals, ETV emerges as the most potent drug, with a lowest IC50 of 5.9 µM, closely followed by RPV (lowest IC50 of 9.6 µM), while DRV exhibits the least effectiveness (lowest IC50 of 25.6 µM). Notably, a significant synergistic effect is evident in the ETV and RPV combination, especially at 48 and 72 h for low concentrations. Synergies are also observed with ETV and DRV, albeit to a lesser extent and primarily at 48 h. Conversely, the DRV and RPV combination yields minimal effects, predominantly additive in nature. In summary, this pre-clinical investigation underscores the promising therapeutic potential of ETV and RPV, both as standalone treatments and in combination, hinting at repurposing opportunities in bladder cancer therapy, which could give a new treatment method for this disease that is faster and without as severe side effects as anticancer drugs. These findings represent a substantial stride in advancing personalized medicine within cancer research and will be further scrutinized in forthcoming studies.
Keywords: antiretroviral drugs; bladder cancer; efficacy evaluation; etravirine; personalized medicine; repurposing possibilities; synergy.
Conflict of interest statement
The authors declare no conflicts of interest.
Figures
References
-
- Observatory G.C. Cancer Fact Sheets—Bladder (C67) [(accessed on 31 May 2023)]. Available online: https://gco.iarc.fr/today/fact-sheets-cancers.
-
- Observatory G.C. Age-Standardized Rate (World) per 100,000, Incidence, Males and Females, in 2012. [(accessed on 31 May 2023)]. Available online: https://gco.iarc.fr/overtime/en/dataviz/bars?sexes=1_2&sort_by=value2&ca....
-
- Barone B., Finati M., Cinelli F., Fanelli A., Del Giudice F., De Berardinis E., Sciarra A., Russo G., Mancini V., D’Altilia N., et al. Bladder Cancer and Risk Factors: Data from a Multi-Institutional Long-Term Analysis on Cardiovascular Disease and Cancer Incidence. J. Pers Med. 2023;13:512. doi: 10.3390/jpm13030512. - DOI - PMC - PubMed
LinkOut - more resources
Full Text Sources
