. 2024 Mar 7;15(3):342.
doi: 10.3390/genes15030342.

Optical Genome Mapping as a Potential Routine Clinical Diagnostic Method

Affiliations

Optical Genome Mapping as a Potential Routine Clinical Diagnostic Method

Hayk Barseghyan et al. Genes (Basel). .

Abstract

Chromosome analysis (CA) and chromosomal microarray analysis (CMA) have been successfully used to diagnose genetic disorders. However, many conditions remain undiagnosed due to limitations in resolution (CA) and detection of only unbalanced events (CMA). Optical genome mapping (OGM) has the potential to address these limitations by capturing both structural variants (SVs) resulting in copy number changes and balanced rearrangements with high resolution. In this study, we investigated OGM's concordance using 87 SVs previously identified by CA, CMA, or Southern blot. Overall, OGM was 98% concordant with only three discordant cases: (1) uncalled translocation with one breakpoint in a centromere; (2) uncalled duplication with breakpoints in the pseudoautosomal region 1; and (3) uncalled mosaic triplication originating from a marker chromosome. OGM provided diagnosis for three previously unsolved cases: (1) disruption of the SON gene due to a balanced reciprocal translocation; (2) disruption of the NBEA gene due to an inverted insertion; (3) disruption of the TSC2 gene due to a mosaic deletion. We show that OGM is a valid method for the detection of many types of SVs in a single assay and is highly concordant with legacy cytogenomic methods; however, it has limited SV detection capabilities in centromeric and pseudoautosomal regions.

Keywords: CA; CMA; OGM; SV; chromosomal microarray analysis; chromosomal rearrangements; chromosome analysis; copy number variant CNV; optical genome mapping; structural variant.


Conflict of interest statement

H.B. owns stock shares and options in Bionano.

Figures

Figure 1
Figure 1
Genomic structure solved by OGM. (A) Defining the size of chromosomal segments in a reciprocal translocation carrier: case 64. Visualization of the balanced translocation by OGM copy number profiles for chromosomes 14 and 22 (top) and molecule map assemblies (bottom). As evident from the copy number variant track, there are no gains or losses throughout either chromosome. The map assemblies (map 1 and map 2) show alignments to both chromosome 14 and 22, indicating a reciprocal exchange of the terminal material between the q arms of chr14:102,525,956 and chr22:41,439,633 (4.5 Mbp and 9.4 Mbp in size, respectively). The resultant derivative chromosome compositions are written on top of maps 1 and 2. The smaller maps that span the breakpoints indicate the presence of a normal chromosome. (B) Deciphering the underlying genomic structure of two copy number gains: case 21. The OGM CNV track (top) shows two gains of chromosome segments 2q31.1q33.1 and 2q33.2q33.3, 27 Mbp and 2 Mbp in size, respectively. The zoom-in around the red rectangle shows the maps and the corresponding breakpoints that were used to solve the resultant genomic structure (bottom). Both duplications are inserted downstream in the same orientation.
Figure 2
Figure 2
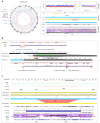
Novel findings provided by OGM. (A) Identification of disease-causing gene disruption due to a reciprocal translocation: case 61. OGM circos plot showing a fusion line between chromosome 6 and 21 (left). The corresponding CNV plots (top right) show no change in the copy number of either chromosome indicating that the exchange is likely balanced. The fusion is evidenced by an assembled map alignment to both chromosomes (middle right). The targeted long-read nanopore sequencing confirms the translocation by showing read alignments (arrows) on each side of the chromosome 21 breakpoint and misalignment in the middle (red line). Mismatched sequences from reads spanning the breakpoint map to 6q14.1 and the breakpoint on chromosome 21 disrupts SON gene (chromosome 21q22.11) within intron 6. (B) Identification of disease-causing gene disruption due to an inverted insertion: case 51. OGM CNV plots of both chromosomes 18 and 13 are demonstrated at the top and bottom. Chromosome 18 does not have any copy number changes; however, CNV plot of chromosome 13 shows CNV loss (chr13q22.2q31.1) adjacent to which there is an insertion breakpoint with inverted map alignment to chromosome 18. Another breakpoint on chromosome 13 (chr13q13.3) overlaps with NBEA gene which has a phenotypic overlap with the clinical presentation of the patient. Moreover, a segment on chromosome 18 that overlaps the insertion breakpoint is inverted but does not seem to overlap a clinically significant gene. The derivative chromosome 18 map assembled with OGM is shown in the middle with corresponding alignments to chromosomes 13 and 18. (C) Detection of a disease-causing gene disruption due to a mosaic deletion: case 11. OGM CNV plot shows no change in copy number around TSC2 and PKD1 genes; however, the OGM map assemblies show two normal alignments to the reference (maps 1 and 2) and, most importantly, a third map (map 3) that shows a deletion overlapping these two genes. The third map assembly indicates that the deletion is mosaic with an estimated molecule support of allele fraction at 12%. The OGM map indicates a wide range for breakpoint localization, requiring orthogonal validation to identify more precise deletion locations. Targeted nanopore sequencing showed that TSC2-PKD1 contiguous gene deletion spans 32.6 kbp. Realignment of the mismatched sequences reveals the breakpoints within intron 30 of the TSC2 gene and intron 11 of the PDK1 gene.

References

    1. Amberger J.S., Bocchini C.A., Schiettecatte F., Scott A.F., Hamosh A. OMIM.org: Online Mendelian Inheritance in Man (OMIM®), an online catalog of human genes and genetic disorders. Nucleic Acids Res. 2015;43:D789–D798. doi: 10.1093/nar/gku1205. - DOI - PMC - PubMed
    1. Waggoner D., Wain K.E., Dubuc A.M., Conlin L., Hickey S.E., Lamb A.N., Martin C.L., Morton C.C., Rasmussen K., Schuette J.L., et al. Yield of additional genetic testing after chromosomal microarray for diagnosis of neurodevelopmental disability and congenital anomalies: A clinical practice resource of the American College of Medical Genetics and Genomics (ACMG) Genet. Med. 2018;20:1105–1113. doi: 10.1038/s41436-018-0040-6. - DOI - PMC - PubMed
    1. Chaisson M.J.P., Sanders A.D., Zhao X., Malhotra A., Porubsky D., Rausch T., Gardner E.J., Rodriguez O.L., Guo L., Collins R.L. Multi-platform discovery of haplotype-resolved structural variation in human genomes. Nat. Commun. 2019;10:1784. doi: 10.1038/s41467-018-08148-z. - DOI - PMC - PubMed
    1. Levy-Sakin M., Pastor S., Mostovoy Y., Li L., Leung A.K.Y., McCaffrey J., Young E., Lam E.T., Hastie A.R., Wong K.H.Y. Genome maps across 26 human populations reveal population-specific patterns of structural variation. Nat. Commun. 2019;10:1025. doi: 10.1038/s41467-019-08992-7. - DOI - PMC - PubMed
    1. Bocklandt S., Hastie A., Cao H. Bionano Genome Mapping: High-Throughput, Ultra-Long Molecule Genome Analysis System for Precision Genome Assembly and Haploid-Resolved Structural Variation Discovery. Adv. Exp. Med. Biol. 2019;1129:97–118. - PubMed

Publication types

LinkOut - more resources