Transcriptome Analysis of miRNA and mRNA in Porcine Skeletal Muscle following Glaesserella parasuis Challenge
- PMID: 38540418
- PMCID: PMC10970282
- DOI: 10.3390/genes15030359
Transcriptome Analysis of miRNA and mRNA in Porcine Skeletal Muscle following Glaesserella parasuis Challenge
Abstract
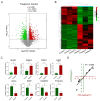
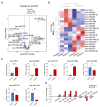
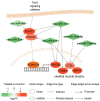
Glaesserella parasuis (G. parasuis) causes systemic infection in pigs, but its effects on skeletal muscle and underlying mechanisms are poorly understood. We investigated G. parasuis infection in colostrum-deprived piglets, observing decreased daily weight gain and upregulation of inflammatory factors in skeletal muscle. Muscle fiber area and diameter were significantly reduced in the treated group (n = 3) compared to the control group (n = 3), accompanied by increased expression of FOXO1, FBXO32, TRIM63, CTSL, and BNIP3. Based on mRNA and microRNA (miRNA) sequencing, we identified 1642 differentially expressed (DE) mRNAs and 19 known DE miRNAs in skeletal muscle tissues between the two groups. We predicted target genes with opposite expression patterns to the 19 miRNAs and found significant enrichment and activation of the FoxO signaling pathway. We found that the upregulated core effectors FOXO1 and FOXO4 were targeted by downregulated ssc-miR-486, ssc-miR-370, ssc-miR-615, and ssc-miR-224. Further investigation showed that their downstream upregulated genes involved in protein degradation were also targeted by the downregulated ssc-miR-370, ssc-miR-615, ssc-miR-194a-5p, and ssc-miR-194b-5p. These findings suggest that G. parasuis infection causes skeletal muscle atrophy in piglets through accelerated protein degradation mediated by the "miRNAs-FOXO1/4" axis, while further research is necessary to validate the regulatory relationships. Our results provide new insights into the understanding of systemic inflammation growth mechanisms caused by G. parasuis and the role of miRNAs in bacterial infection pathogenesis.
Keywords: G. parasuis; miRNAs; pig; skeletal muscle atrophy; transcriptome.
Conflict of interest statement
The authors declare that there are no conflicts of interest.
Figures


Similar articles
-
Comparative study of the effects of baicalin and probenecid on microRNA expression profiles in porcine aortic vascular endothelial cells infected by Glaesserella parasuis.BMC Vet Res. 2025 Apr 2;21(1):237. doi: 10.1186/s12917-025-04702-2. BMC Vet Res. 2025. PMID: 40176019 Free PMC article.
-
Expression profiles of miRNAs in the lung tissue of piglets infected with Glaesserella parasuis and the roles of ssc-miR-135 and ssc-miR-155-3p in the regulation of inflammation.Comp Immunol Microbiol Infect Dis. 2024 Aug;111:102214. doi: 10.1016/j.cimid.2024.102214. Epub 2024 Jul 2. Comp Immunol Microbiol Infect Dis. 2024. PMID: 39002176
-
Analysis of MicroRNA Expression Profiles in Weaned Pig Skeletal Muscle after Lipopolysaccharide Challenge.Int J Mol Sci. 2015 Sep 16;16(9):22438-55. doi: 10.3390/ijms160922438. Int J Mol Sci. 2015. PMID: 26389897 Free PMC article.
-
Comparative Transcriptomic Analysis of mRNAs, miRNAs and lncRNAs in the Longissimus dorsi Muscles between Fat-Type and Lean-Type Pigs.Biomolecules. 2022 Sep 13;12(9):1294. doi: 10.3390/biom12091294. Biomolecules. 2022. PMID: 36139132 Free PMC article.
-
Identification of different myofiber types in pigs muscles and construction of regulatory networks.BMC Genomics. 2024 Apr 24;25(1):400. doi: 10.1186/s12864-024-10271-9. BMC Genomics. 2024. PMID: 38658807 Free PMC article.
Cited by
-
The Molecular Mechanism by Which miR-129a-3p Targets the TLR4/NF-κB Signaling Pathway to Regulate Inflammatory Damage in 3D4/21 Cells Infected with Glaesserella parasuis.Animals (Basel). 2025 May 8;15(10):1355. doi: 10.3390/ani15101355. Animals (Basel). 2025. PMID: 40427234 Free PMC article.
References
Publication types
MeSH terms
Substances
LinkOut - more resources
Full Text Sources
Research Materials
Miscellaneous

