

HIIT Promotes M2 Macrophage Polarization and Sympathetic Nerve Density to Induce Adipose Tissue Browning in T2DM Mice
- PMID: 38540669
- PMCID: PMC10968334
- DOI: 10.3390/biom14030246
HIIT Promotes M2 Macrophage Polarization and Sympathetic Nerve Density to Induce Adipose Tissue Browning in T2DM Mice
Abstract
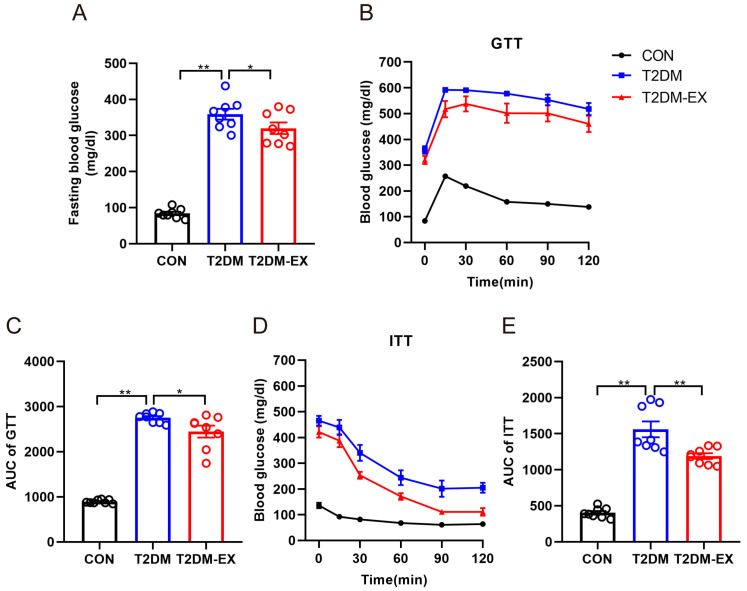
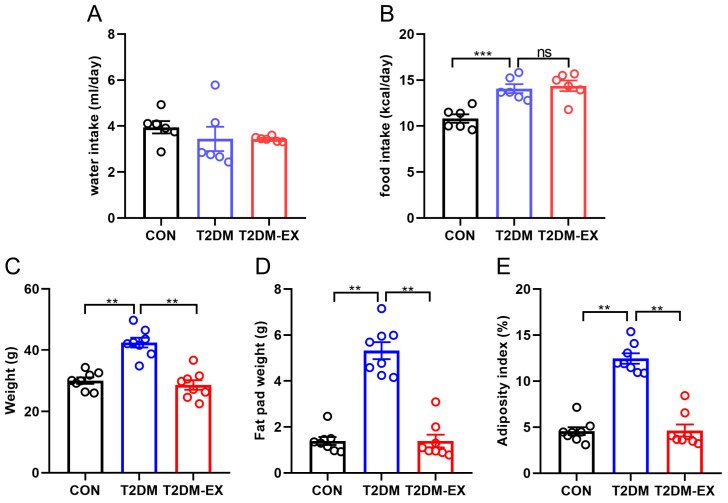
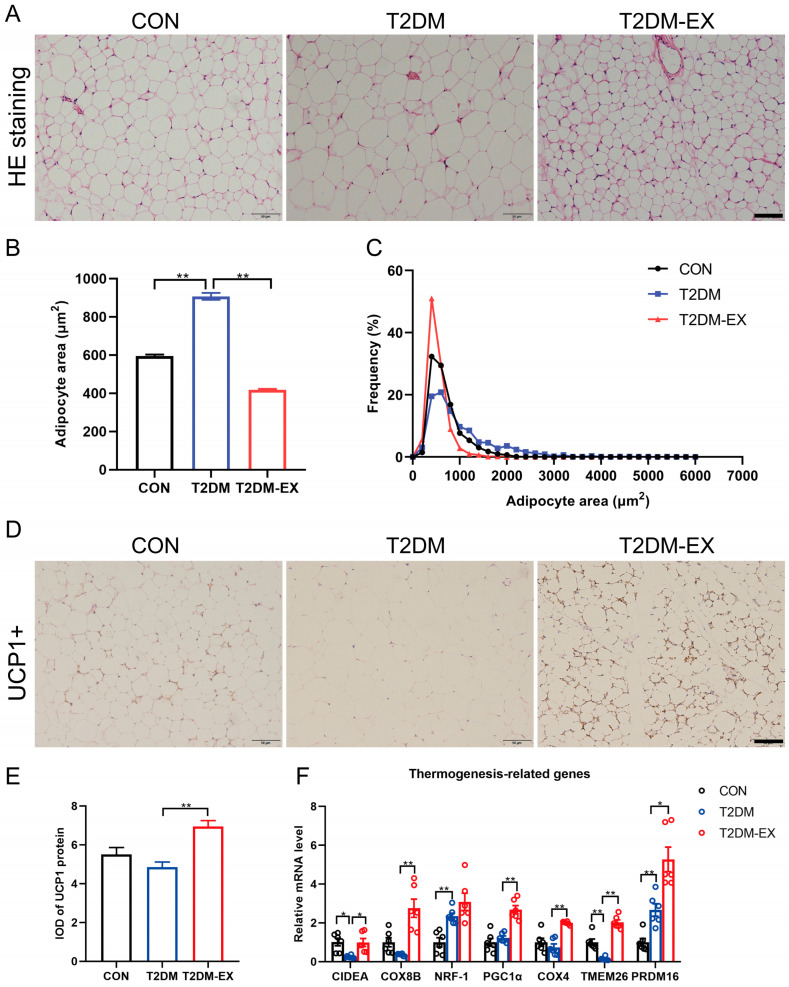
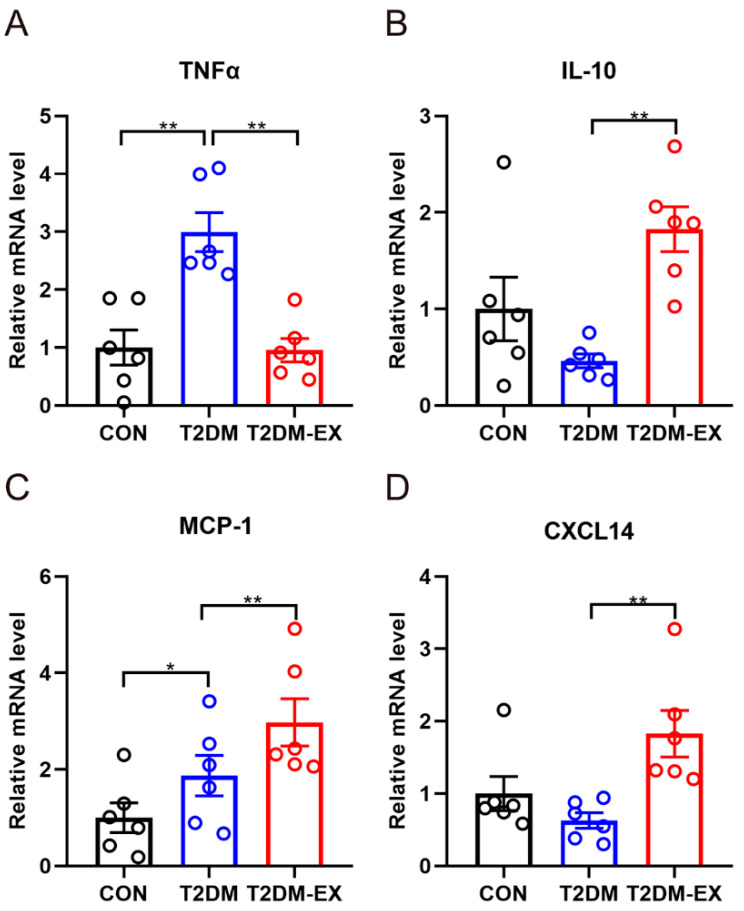
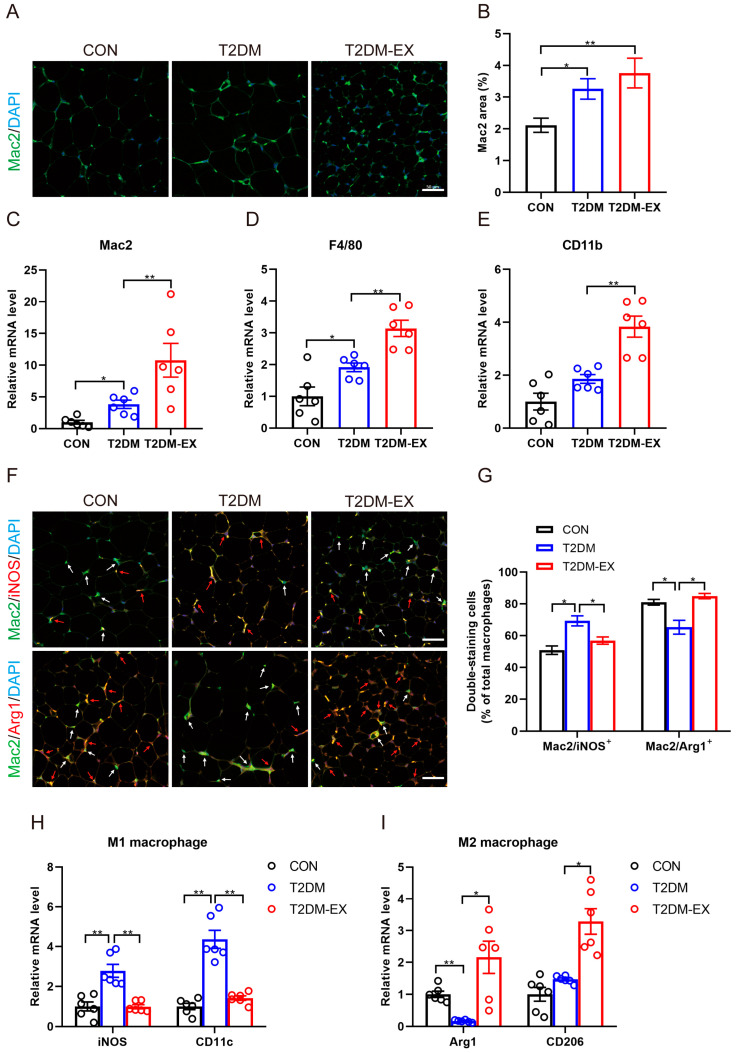
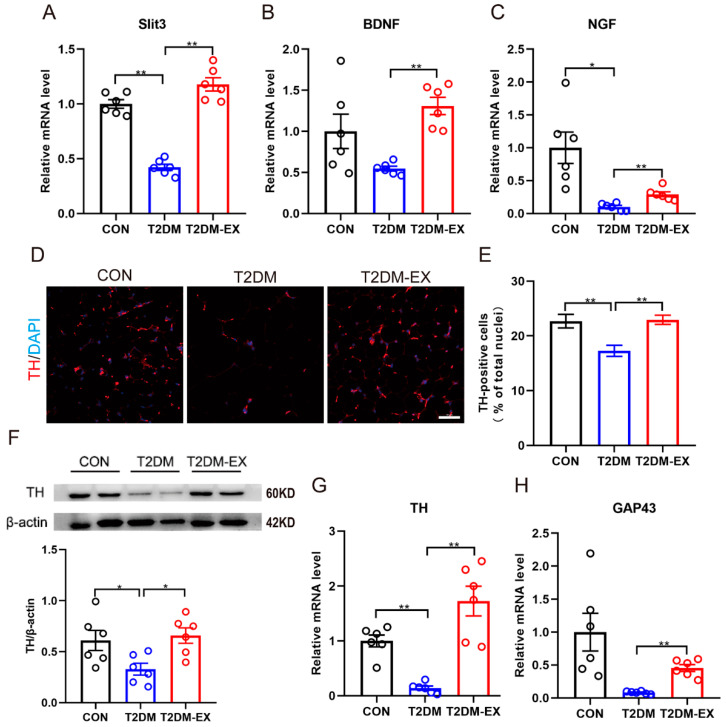
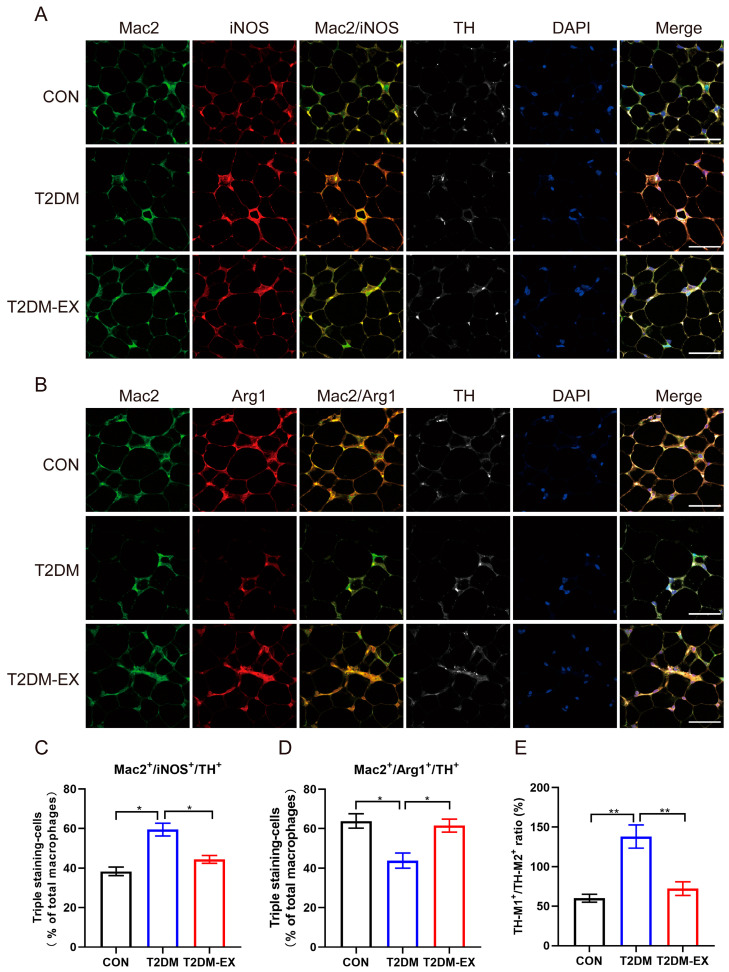
Browning of white adipose tissue (WAT) is a focus of research in type 2 diabetes mellitus (T2DM) and metabolism, which may be a potential molecular mechanism for high-intensity interval training (HIIT) to improve T2DM. In this study, male C57BL/6J wild-type mice were subjected to an 8-week HIIT regimen following T2DM induction through a high-fat diet (HFD) combined with streptozotocin (STZ) injection. We found that HIIT improved glucose metabolism, body weight, and fat mass in T2DM mice. HIIT also decreased adipocyte size and induced browning of WAT. Our data revealed a decrease in TNFα and an increase in IL-10 with HIIT, although the expression of chemokines MCP-1 and CXCL14 was increased. We observed increased pan-macrophage infiltration induced by HIIT, along with a simultaneous decrease in the expression of M1 macrophage markers (iNOS and CD11c) and an increase in M2 macrophage markers (Arg1 and CD206), suggesting that HIIT promotes M2 macrophage polarization. Additionally, HIIT upregulated the expression of Slit3 and neurotrophic factors (BDNF and NGF). The expression of the sympathetic marker tyrosine hydroxylase (TH) and the nerve growth marker GAP43 was also increased, demonstrating the promotion of sympathetic nerve growth and density by HIIT. Notably, we observed macrophages co-localizing with TH, and HIIT induced the accumulation of M2 macrophages around sympathetic nerves, suggesting a potential association between M2 macrophages and increased density of sympathetic nerves. In conclusion, HIIT induces adipose tissue browning and improves glucose metabolism in T2DM mice by enhancing M2 macrophage polarization and promoting sympathetic nerve growth and density.
Keywords: high-intensity interval training; innervation; macrophage; sympathetic nervous system; type 2 diabetes mellitus; white adipose tissue browning.
Conflict of interest statement
The authors declare that the research was conducted in the absence of any commercial or financial relationships that could be construed as a potential conflict of interest.
Figures
Similar articles
-
Shengmai San formula alleviates high-fat diet-induced obesity in mice through gut microbiota-derived bile acid promotion of M2 macrophage polarization and thermogenesis.Phytomedicine. 2024 Oct;133:155938. doi: 10.1016/j.phymed.2024.155938. Epub 2024 Aug 8. Phytomedicine. 2024. PMID: 39163753
-
Exercise training inhibits inflammation in adipose tissue via both suppression of macrophage infiltration and acceleration of phenotypic switching from M1 to M2 macrophages in high-fat-diet-induced obese mice.Exerc Immunol Rev. 2010;16:105-18. Exerc Immunol Rev. 2010. PMID: 20839495
-
HIIT Ameliorates Inflammation and Lipid Metabolism by Regulating Macrophage Polarization and Mitochondrial Dynamics in the Liver of Type 2 Diabetes Mellitus Mice.Metabolites. 2022 Dec 21;13(1):14. doi: 10.3390/metabo13010014. Metabolites. 2022. PMID: 36676939 Free PMC article.
-
Calorie Restriction Combined with High-Intensity Interval Training Promotes Browning of White Adipose Tissue by Activating the PPARγ/PGC-1α/UCP1 Pathway.Altern Ther Health Med. 2023 Apr;29(3):134-139. Altern Ther Health Med. 2023. PMID: 36735710 Clinical Trial.
-
[Research progress of traditional Chinese medicines and active ingredients targeting M1/M2 macrophage polarization balance in intervening obese with type 2 diabetes].Zhongguo Zhong Yao Za Zhi. 2024 Jul;49(13):3441-3451. doi: 10.19540/j.cnki.cjcmm.20240205.703. Zhongguo Zhong Yao Za Zhi. 2024. PMID: 39041116 Review. Chinese.
Cited by
-
The Effects of Different Types of Exercise on Pulmonary Inflammation and Fibrosis in Mice with Type 2 Diabetes Mellitus.Cells. 2025 Jul 4;14(13):1026. doi: 10.3390/cells14131026. Cells. 2025. PMID: 40643547 Free PMC article.
-
High-intensity interval training or lactate administration combined with aerobic training enhances visceral fat loss while promoting VMH neuroplasticity in female rats.Lipids Health Dis. 2024 Dec 18;23(1):405. doi: 10.1186/s12944-024-02397-2. Lipids Health Dis. 2024. PMID: 39696579 Free PMC article.
-
The Role of Exercise in Regulating the Generation of Extracellular Vesicles in Cardiovascular Diseases.Rev Cardiovasc Med. 2024 Nov 4;25(11):392. doi: 10.31083/j.rcm2511392. eCollection 2024 Nov. Rev Cardiovasc Med. 2024. PMID: 39618876 Free PMC article. Review.
References
-
- Magliano D.J., Boyko E.J. IDF Diabetes Atlas. International Diabetes Federation; Brussels, Belgium: 2021. Committee International Diabetes Federation.
-
- Kanaley J.A., Colberg S.R., Corcoran M.H., Malin S.K., Rodriguez N.R., Crespo C.J., Kirwan J.P., Zierath J.R. Exercise/Physical Activity in Individuals with Type 2 Diabetes: A Consensus Statement from the American College of Sports Medicine. Med. Sci. Sports Exerc. 2022;54:353–368. doi: 10.1249/MSS.0000000000002800. - DOI - PMC - PubMed
-
- Whitehead A., Krause F.N., Moran A., MacCannell A.D.V., Scragg J.L., McNally B.D., Boateng E., Murfitt S.A., Virtue S., Wright J., et al. Brown and beige adipose tissue regulate systemic metabolism through a metabolite interorgan signaling axis. Nat. Commun. 2021;12:1905. doi: 10.1038/s41467-021-22272-3. - DOI - PMC - PubMed
MeSH terms
Substances
Grants and funding
- 32371185/the National Natural Science Foundation of China
- 23010504200/the Shanghai Science and Technology Plan Project
- 20SG50/Shanghai Education Development Foundation and Shanghai Municipale Education Commission
- YJSCX-2023-018/the Research and Innovation Grant for Graduate Students, Shanghai University of Sport
- 2022KF001/the Key Lab of Exercise and Health Sciences of Ministry of Education (Shanghai University of Sport)
LinkOut - more resources
Full Text Sources
Medical
Research Materials
Miscellaneous
