

Identifying Proteins and Amino Acids Associated with Liver Cancer Risk: A Study Utilizing Mendelian Randomization and Bulk RNA Sequencing Analysis
- PMID: 38541004
- PMCID: PMC10970996
- DOI: 10.3390/jpm14030262
Identifying Proteins and Amino Acids Associated with Liver Cancer Risk: A Study Utilizing Mendelian Randomization and Bulk RNA Sequencing Analysis
Abstract
Background: Primary liver cancer (PLC) ranks third in terms of fatality rate among all malignant tumors worldwide. Proteomics and metabolomics have become widely utilized in identifying causes and diagnostic indicators of PLC. Nevertheless, in studies aiming to identify proteins/metabolites that experienced significant changes before PLC, the potential impact of reverse causation and confounding variables still needs to be fully addressed.
Methods: This study thoroughly investigated the causal relationship between 4719 blood proteins, 21 amino acids, and the risk of PLC using the Mendelian randomization (MR) method. In addition, through a comprehensive analysis of the TCGA-LIHC cohort and GEO databases, we evaluated the differentially expressed genes (DEGs) related to serine metabolism in diagnosing and predicting the prognosis of patients with PLC.
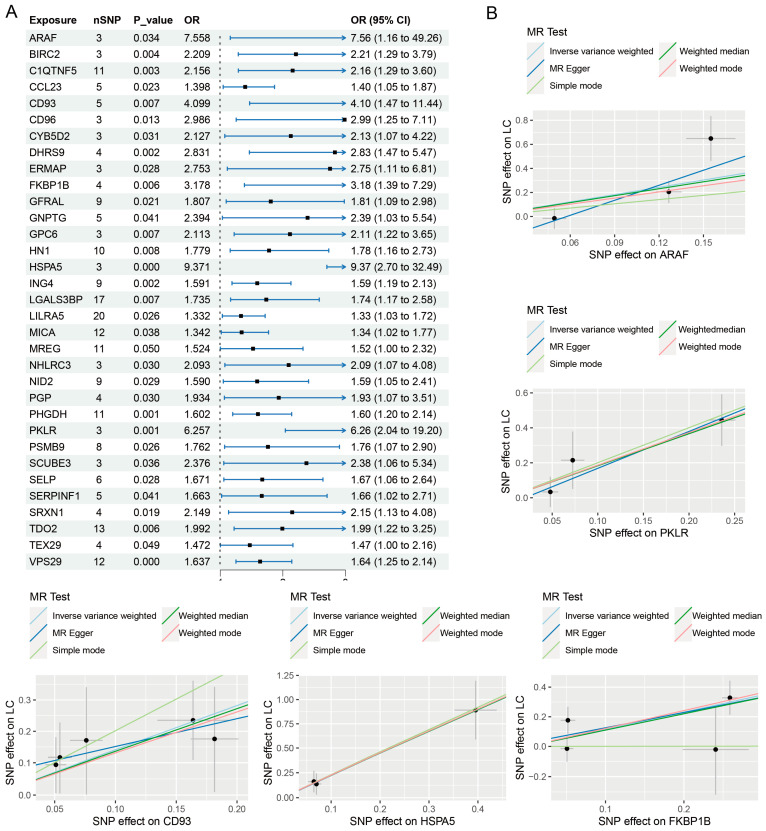
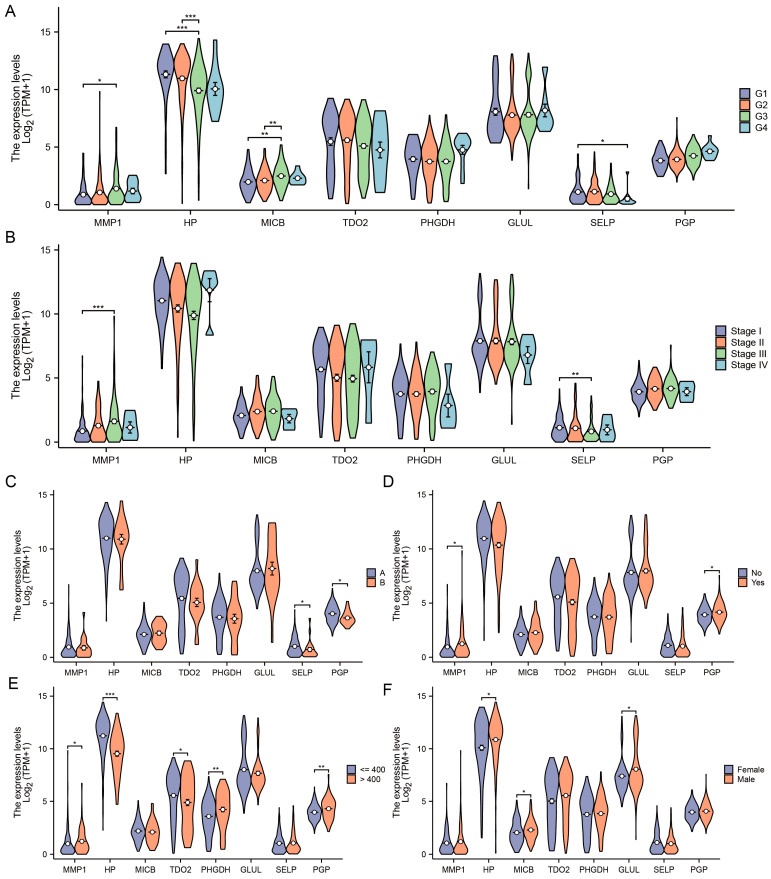
Results: A total of 63 proteins have been identified as connected to the risk of PLC. Additionally, there has been confirmation of a positive cause-effect between PLC and the concentration of serine. The integration of findings from both MR analyses determined that the protein associated with PLC risk exhibited a significant correlation with serine metabolism. Upon careful analysis of the TCGA-LIHC cohort, it was found that eight DEGs are linked to serine metabolism. After thoroughly validating the GEO database, two DEGs, TDO2 and MICB, emerged as potential biomarkers for diagnosing PLC.
Conclusions: Two proteins involved in serine metabolism, MICB and TDO2, are causally linked to the risk of PLC and could potentially be used as diagnostic indicators.
Keywords: amino acid; liver cancer; mendelian randomization; protein; risk.
Conflict of interest statement
The authors declare no conflicts of interest.
Figures


Similar articles
-
Integrated multiple-microarray analysis and mendelian randomization to identify novel targets involved in diabetic nephropathy.Front Endocrinol (Lausanne). 2023 Jul 10;14:1191768. doi: 10.3389/fendo.2023.1191768. eCollection 2023. Front Endocrinol (Lausanne). 2023. PMID: 37492198 Free PMC article.
-
The Effects of Fatty Acids on Primary Liver Cancer: A Two-Sample Mendelian Randomization Study.Nutr Cancer. 2023;75(7):1560-1570. doi: 10.1080/01635581.2023.2216914. Epub 2023 Jun 8. Nutr Cancer. 2023. PMID: 37289106
-
Association between serum iron status and primary liver cancer risk: a Mendelian randomization analysis.Ann Transl Med. 2021 Oct;9(20):1533. doi: 10.21037/atm-21-4608. Ann Transl Med. 2021. PMID: 34790739 Free PMC article.
-
Exploring the potential causal relationship between gut microbiota and heart failure: A two-sample mendelian randomization study combined with the geo database.Curr Probl Cardiol. 2024 Feb;49(2):102235. doi: 10.1016/j.cpcardiol.2023.102235. Epub 2023 Nov 30. Curr Probl Cardiol. 2024. PMID: 38040216 Review.
-
Causal relationship between gut microbiota and polycystic ovary syndrome: a literature review and Mendelian randomization study.Front Endocrinol (Lausanne). 2024 Feb 1;15:1280983. doi: 10.3389/fendo.2024.1280983. eCollection 2024. Front Endocrinol (Lausanne). 2024. PMID: 38362275 Free PMC article. Review.
Cited by
-
Tryptophan-2,3-Dioxygenase as a Therapeutic Target in Digestive System Diseases.Biology (Basel). 2025 Mar 15;14(3):295. doi: 10.3390/biology14030295. Biology (Basel). 2025. PMID: 40136551 Free PMC article. Review.
References
Grants and funding
LinkOut - more resources
Full Text Sources
