. 2024 Feb 20;14(3):282.
doi: 10.3390/life14030282.

Anticancer Potential of Pyridoxine-Based Doxorubicin Derivatives: An In Vitro Study

Affiliations

Anticancer Potential of Pyridoxine-Based Doxorubicin Derivatives: An In Vitro Study

Rawdah Karwt et al. Life (Basel). .

Abstract

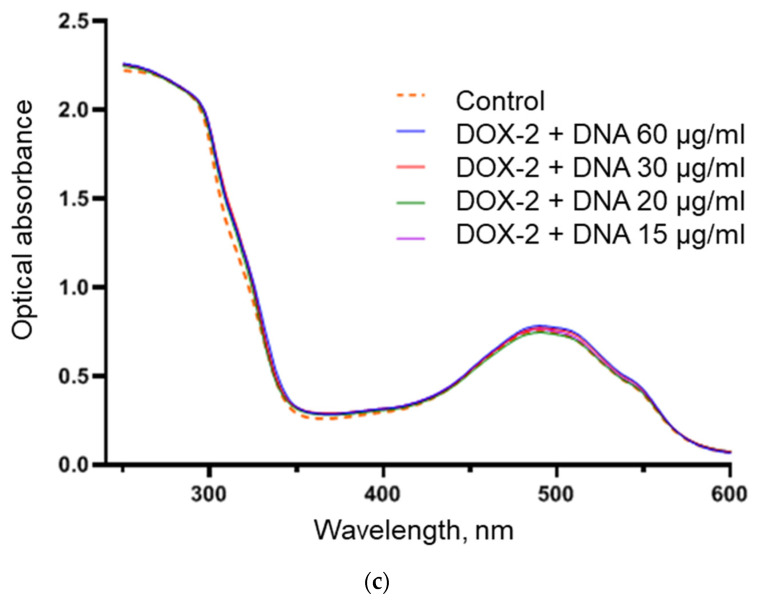
Doxorubicin (DOX) is a prevalent anticancer agent; however, it is unfortunately characterized by high cardiotoxicity, myelosuppression, and multiple other side effects. To overcome DOX limitations, two novel pyridoxine-derived doxorubicin derivatives were synthesized (DOX-1 and DOX-2). In the present study, their antitumor activity and mechanism of action were investigated. Of these two compounds, DOX-2, in which the pyridoxine fragment is attached to the doxorubicin molecule via a C3 linker, revealed higher selectivity against specific cancer cell types compared to doxorubicin and a promising safety profile for conditionally normal cells. However, the compound with a C1 linker (DOX-1) was not characterized by selectivity of antitumor action. It was revealed that DOX-2 obstructs cell cycle progression, induces apoptosis via the mitochondrial pathway without the development of necrosis, and showcases antioxidant capabilities, underlining its cell-regulatory roles. In contrast to doxorubicin's DNA-centric mechanism, DOX-2 does not interact with nuclear DNA. Given these findings, DOX-2 presents a new promising direction in cancer therapeutics, which is deserving of further in vivo exploration.

Keywords: DNA intercalation; anticancer agents; antioxidants; apoptosis induction; cell-cycle arrest; doxorubicin; doxorubicin derivatives; pyridoxine; vitamin B6.


Conflict of interest statement

The authors declare no conflicts of interest.

Figures

Scheme 1
Scheme 1
The synthesis of pyridoxine and doxorubicin derivatives linked by a peptide bond. Reagents and reaction conditions: (i) Me2CO, HCl; (ii) KMnO4, H2O/Me2CO; (iii) doxorubicin, DIPEA, HATU, DCM; (iv) MnO2, CH2Cl2; (v) (2-Ethoxy-2-oxoethyl)triphenylphosphonium chloride, Et3N, DCM; (vi) K2CO3, MeOH/H2O.
Figure 1
Figure 1
The chemical structure of Doxorubicin (DOX) and its derivatives DOX-1 and DOX-2. Bonds in bold black represent the pyridoxine moiety in the compounds; bonds in bold red represent a linker.
Figure 2
Figure 2
The distribution of MCF-7 tumor cells across cell cycle phases ((a) G0/G1 phase, (b) S phase, (c) G2/M phase) when treated with doxorubicin (blue columns) and its derivatives DOX-2 (red columns) for 72 h using Hoechst 33342 dye as an indicator. p > 0.05 (ns), 0.05–0.01 (*), 0.01–0.001 (**), 0.001–0.0001 (***), <0.0001 (****). The experiment was independently repeated three times in duplicate. This figure displays data from the most representative experiment.
Figure 2
Figure 2
The distribution of MCF-7 tumor cells across cell cycle phases ((a) G0/G1 phase, (b) S phase, (c) G2/M phase) when treated with doxorubicin (blue columns) and its derivatives DOX-2 (red columns) for 72 h using Hoechst 33342 dye as an indicator. p > 0.05 (ns), 0.05–0.01 (*), 0.01–0.001 (**), 0.001–0.0001 (***), <0.0001 (****). The experiment was independently repeated three times in duplicate. This figure displays data from the most representative experiment.
Figure 3
Figure 3
The distribution of MCF-7 cells into apoptosis phases after DOX-2 treatment for 72 h according to Annexin V-FITC/DAPI staining. Treatment with Triton X-100—24 h. The figures present the average data derived from two independent experiments conducted in duplicate.
Figure 4
Figure 4
Percentage of cells with reduced mitochondrial potential ΔΨ (cells with low Rh123 fluorescence) when treated with doxorubicin (red columns) and its derivatives (DOX-1 ((a), green columns) and DOX-2 ((b), blue columns)) for 72 h. p > 0.05 (ns), 0.05–0.01 (*), 0.01–0.001 (**), 0.001–0.0001 (***), <0.0001 (****). The figures present the average data derived from two independent experiments conducted in triplicate.
Figure 5
Figure 5
MCF-7 (A) and HCT-116 (B) tumor cells treated with doxorubicin and its derivatives DOX-1 and DOX-2, as well as with Hoechst 33342 dye for nucleus visualization. DOX-1 and DOX-2—5 μM, 24 h incubation; DOX—50 μM, 2 h incubation. The experiment was independently repeated three times in triplicate. The figures display data from the most representative experiment.
Figure 5
Figure 5
MCF-7 (A) and HCT-116 (B) tumor cells treated with doxorubicin and its derivatives DOX-1 and DOX-2, as well as with Hoechst 33342 dye for nucleus visualization. DOX-1 and DOX-2—5 μM, 24 h incubation; DOX—50 μM, 2 h incubation. The experiment was independently repeated three times in triplicate. The figures display data from the most representative experiment.
Figure 6
Figure 6
Absorption spectra of doxorubicin (a) and its derivatives DOX-1 (b) and DOX-2 (c) when interacting with chicken erythrocyte genomic DNA. The experiment was independently repeated two times in duplicate. The figures display averaged spectra.
Figure 6
Figure 6
Absorption spectra of doxorubicin (a) and its derivatives DOX-1 (b) and DOX-2 (c) when interacting with chicken erythrocyte genomic DNA. The experiment was independently repeated two times in duplicate. The figures display averaged spectra.
Figure 7
Figure 7
Electrophoregram of genomic DNA compositions with doxorubicin (DOX) and its derivatives DOX-1 (a) and DOX-2 (b). Red fluorescence corresponds to doxorubicin (emission at 532 nm) and green represents DNA stained with SYBR Green (emission at 473 nm). The experiment was independently repeated two times.
Figure 8
Figure 8
Tumor cells, intact and treated with H2O2 1 mM (20 min), DOX (0.5 and 1.1 μM, 72 h), DOX-1 (6.1 and 11.3 μM, 72 h), DOX-2 (10 and 20 μM, 72 h). Agarose gel electrophoresis, SYBR Green I staining. The experiment was independently repeated two times in triplicate.
Figure 9
Figure 9
Polymerization kinetics of highly purified porcine neuronal tubulin in the presence of doxorubicin and its derivatives DOX-1 and DOX-2, negative (vinblastine) and positive (paclitaxel) controls. The experiment was independently repeated two times. The figures display data from the most representative experiment.

Similar articles

Cited by

References

    1. Dönnes P., Höglund A. Predicting protein subcellular localization: Past, present, and future. Genom. Proteom. Bioinform. 2004;2:209–215. doi: 10.1016/S1672-0229(04)02027-3. - DOI - PMC - PubMed
    1. Sun J., Wei Q., Zhou Y., Wang J., Liu Q., Xu H. A systematic analysis of FDA-approved anticancer drugs. BMC Syst. Biol. 2017;11:87. doi: 10.1186/s12918-017-0464-7. - DOI - PMC - PubMed
    1. Tewey K.M., Rowe T.C., Yang L., Halligan B.D., Liu L.F. Adriamycin-induced DNA damage mediated by mammalian DNA topoisomerase II. Science. 1984;226:466–468. doi: 10.1126/science.6093249. - DOI - PubMed
    1. Kawano M., Tanaka K., Itonaga I., Iwasaki T., Miyazaki M., Ikeda S., Tsumura H. Dendritic cells combined with doxorubicin induces immunogenic cell death and exhibits antitumor effects for osteosarcoma. Oncol. Lett. 2016;11:2169–2175. doi: 10.3892/ol.2016.4175. - DOI - PMC - PubMed
    1. Doroshow J.H. Role of hydrogen peroxide and hydroxyl radical formation in the killing of Ehrlich tumor cells by anticancer quinones. Proc. Natl. Acad. Sci. USA. 1986;83:4514–4518. doi: 10.1073/pnas.83.12.4514. - DOI - PMC - PubMed

LinkOut - more resources