. 2024 Mar 13;25(6):3251.
doi: 10.3390/ijms25063251.

Trimetazidine Improves Mitochondrial Dysfunction in SOD1G93A Cellular Models of Amyotrophic Lateral Sclerosis through Autophagy Activation

Affiliations

Trimetazidine Improves Mitochondrial Dysfunction in SOD1G93A Cellular Models of Amyotrophic Lateral Sclerosis through Autophagy Activation

Illari Salvatori et al. Int J Mol Sci. .

Abstract

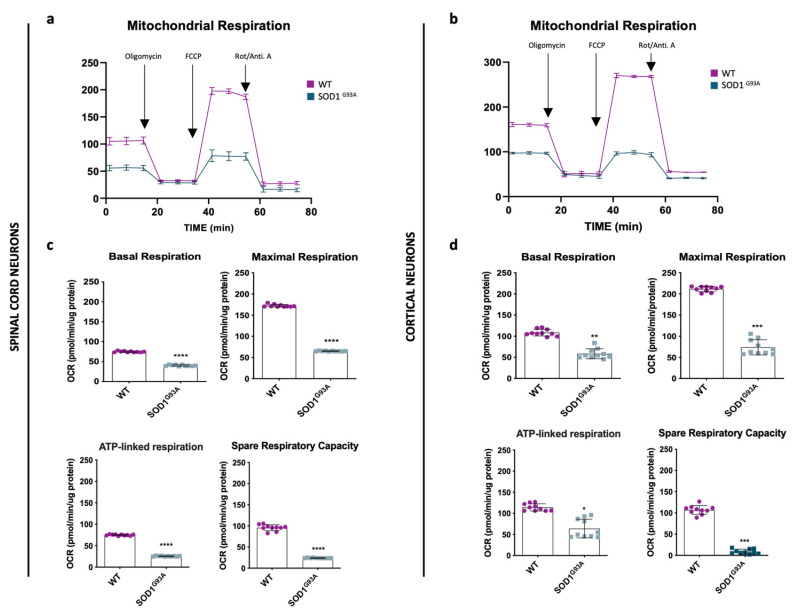
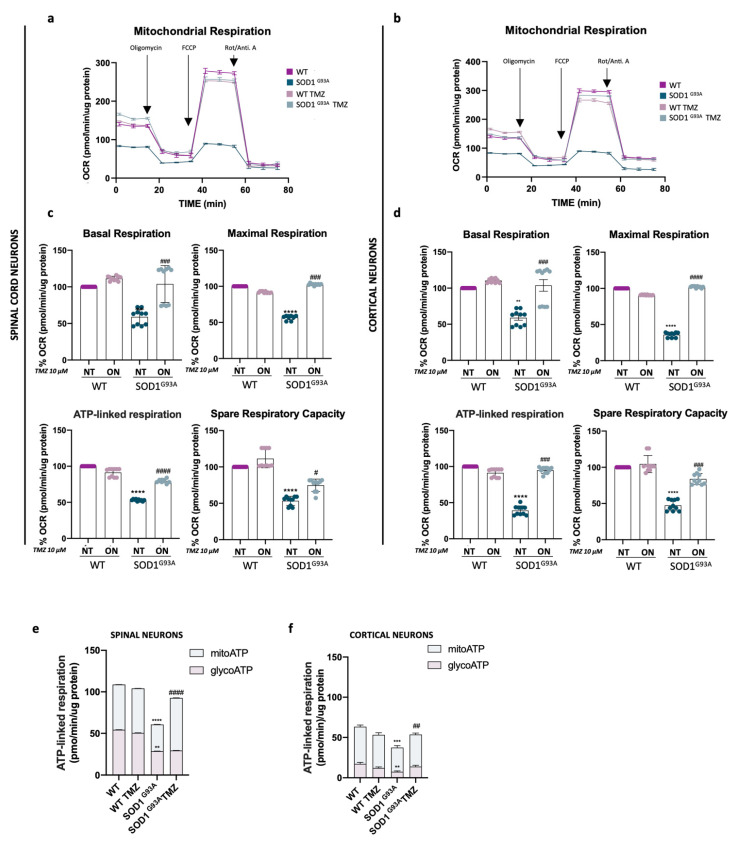
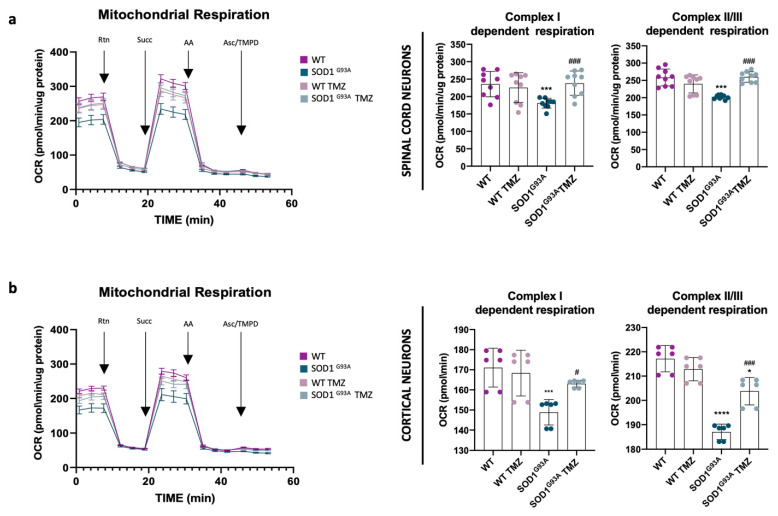
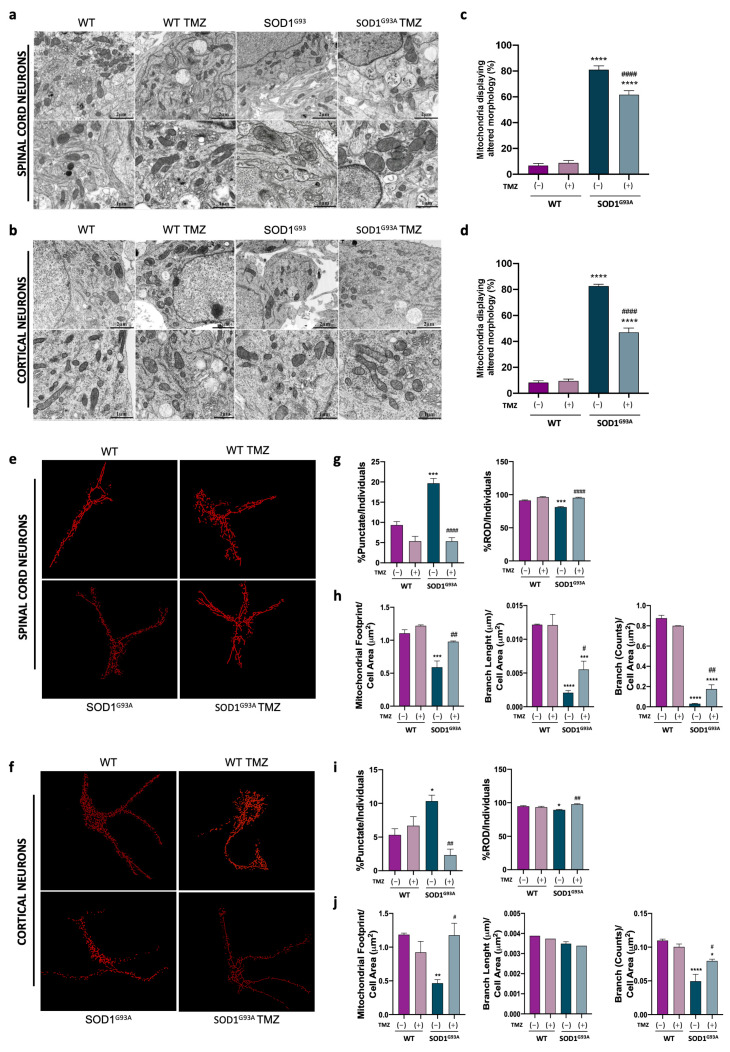
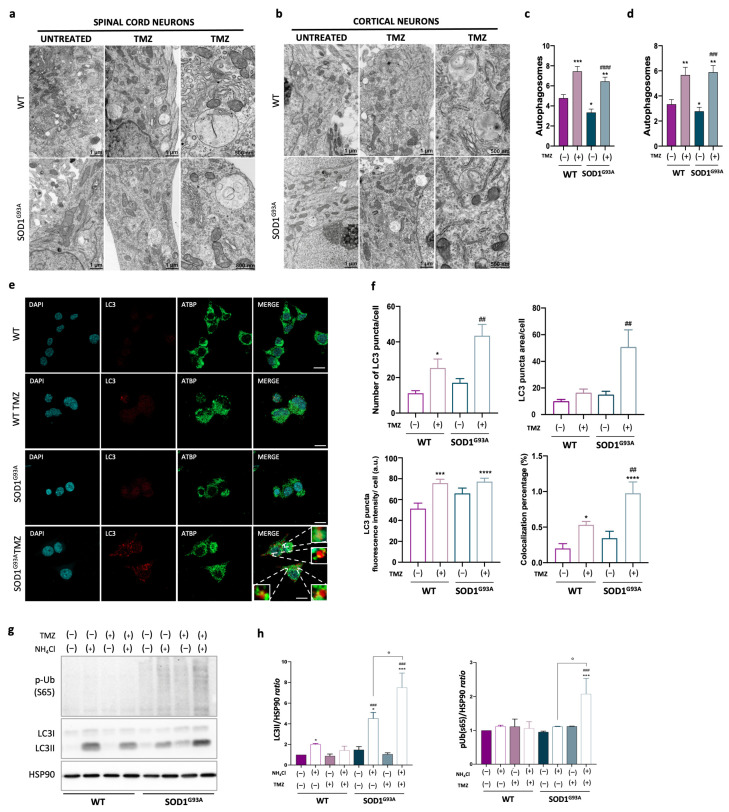
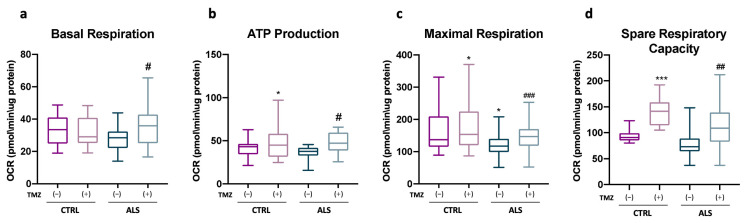
Amyotrophic Lateral Sclerosis (ALS) is considered the prototype of motor neuron disease, characterized by motor neuron loss and muscle waste. A well-established pathogenic hallmark of ALS is mitochondrial failure, leading to bioenergetic deficits. So far, pharmacological interventions for the disease have proven ineffective. Trimetazidine (TMZ) is described as a metabolic modulator acting on different cellular pathways. Its efficacy in enhancing muscular and cardiovascular performance has been widely described, although its molecular target remains elusive. We addressed the molecular mechanisms underlying TMZ action on neuronal experimental paradigms. To this aim, we treated murine SOD1G93A-model-derived primary cultures of cortical and spinal enriched motor neurons, as well as a murine motor-neuron-like cell line overexpressing SOD1G93A, with TMZ. We first characterized the bioenergetic profile of the cell cultures, demonstrating significant mitochondrial dysfunction that is reversed by acute TMZ treatments. We then investigated the effect of TMZ in promoting autophagy processes and its impact on mitochondrial morphology. Finally, we demonstrated the effectiveness of TMZ in terms of the mitochondrial functionality of ALS-rpatient-derived peripheral blood mononuclear cells (PBMCs). In summary, our results emphasize the concept that targeting mitochondrial dysfunction may represent an effective therapeutic strategy for ALS. The findings demonstrate that TMZ enhances mitochondrial performance in motor neuron cells by activating autophagy processes, particularly mitophagy. Although further investigations are needed to elucidate the precise molecular pathways involved, these results hold critical implications for the development of more effective and specific derivatives of TMZ for ALS treatment.

Keywords: Amyotrophic Lateral Sclerosis; SOD1G93A; Trimetazidine; autophagy; mitochondria; spinal and cortical primary cultures.


Conflict of interest statement

The authors have no relevant financial or non-financial interests to disclose.

Figures

Figure 1
Figure 1
Mitochondrial functionality is impaired in primary spinal cord and cortical cell cultures obtained from SOD1G93A mice. (a,b) Representative profile of oxygen consumption rate (OCR) obtained through Cell Mito Stress Test from primary spinal cord (a) and cortical (b) cell cultures obtained from WT and SOD1G93A mice. OCR was measured after the addition of drugs: oligomycin, FCCP, rotenone and antimycin A (see arrows). The time on the x-axis represents the time point when each measurement was performed. (c,d) The histograms show the individual parameters of basal respiration, ATP-linked respiration, maximal respiration and spare respiratory capacity obtained for primary spinal cord (c) and cortical (d) cell cultures. All data were analyzed with XFe Wave software and are expressed as OCR pmol/minute/μg-protein. Data are presented as means ± SEM, * p < 0.05, ** p < 0.01, *** p < 0.001, **** p < 0.0001 compared with wild type, n ≥ 10 per group, each (n) with ≥ 12 technical replicates. p values were obtained using unpaired Student’s t-test.
Figure 2
Figure 2
Acute Trimetazidine treatments protect mitochondria in primary spinal cord and cortical cell cultures. (a,b) Representative profile of oxygen consumption rate (OCR) obtained through Cell Mito Stress Test from primary spinal cord (a) and cortical (b) cell cultures obtained from WT and SOD1G93A mice untreated or treated overnight (ON) with 10 μM of Trimetazidine (TMZ). (c,d) The histograms show the data obtained from the analysis of the Cell Mito Stress Test performed on primary spinal cord (c) and cortical cultures (d) obtained from WT and SOD1G93A mice. Mitochondrial respiration expressed as normalized OCR after the addition of oligomycin, FCCP, rotenone and antimycin. The value of 100% was arbitrarily assigned to values obtained from NT WT. (e,f) Quantification of total, glycolytic and mitochondrial ATP-linked respiration obtained by Seahorse XF real-time ATP rate assay in primary spinal cord (e) and cortical cultures (f) following ON treatment with 10 µM TMZ. All data were analyzed with XFe Wave software and are expressed as OCR pmol/minute/μg-protein. Data are presented as means ± SEM, ** p < 0.01, *** p < 0.001, **** p < 0.0001 compared with wild type; # p < 0.05, ## p < 0.01, ### p < 0.001, #### p < 0.001 compared with untreated SOD1G93A, n ≥ 10 per group, each (n) with ≥ 6 technical replicates. p values were obtained using parametric one-way ANOVA with Bonferroni post hoc test.
Figure 3
Figure 3
Acute Trimetazidine treatments restore mitochondria complex function in primary spinal cord and cortical cell cultures. (a,b) In the left panels, representative profiles of oxygen consumption rate (OCR) obtained through Electron Flow Assay from primary spinal cord (a) and cortical (b) cell cultures obtained from WT and SOD1G93A mice untreated or treated overnight (ON) with 10 μM of Trimetazidine (TMZ) are displayed. In the right panels, quantification of respiration (OCR) dependent on the activity of Complex I and Complexes II/III in the presence of rotenone, succinate and antimycin A is displayed, respectively, in primary spinal cord (a) and cortical cell cultures (b) obtained from WT and SOD1G93A mice untreated or ON treated with 10 μM TMZ. All data were analyzed with XFe Wave software and are expressed as OCR pmol/minute/μg-protein. Data are presented as means ± SEM, * p < 0.05, *** p < 0.001, **** p < 0.0001 compared with wild type; # p < 0.05, ### p < 0.001 compared with untreated SOD1G93A, n ≥ 6 per group, each (n) with ≥6 technical replicates. p values were obtained using parametric one-way ANOVA with Bonferroni post hoc test.
Figure 4
Figure 4
Ultrastructural mitochondrial morphology is preserved in primary cell cultures administered with Trimetazidine treatment. (a,b) Representative FIB/SEM micrographs illustrating mitochondrial morphology in primary spinal cord (a) and cortical (b) cell cultures obtained from WT and SOD1G93A mice untreated or ON treated with 10 μM of Trimetazidine (TMZ) at different scales (scale bars: 1 μm and 2 μm) and (c,d) relative quantification of mitochondria displaying altered morphology. (e,f) Representative skeletonized mitochondria images, obtained from primary spinal cord (e) and cortical (f) cell cultures from WT and SOD1G93A mice untreated or ON treated with 10 μM TMZ. Cell cultures were previously immunolabeled with the mitochondrial marker ATPB and then analyzed through the Mitochondria Network Analysis tool (MiNA). (g,i) Analysis of the mitochondrial morphology expressed as percentages of punctate-shaped (left panels) and rod-like-shaped (right panels) mitochondria of primary spinal cord (g) and cortical (i) cell cultures obtained from WT and SOD1G93A mice untreated or ON treated with 10 μM TMZ. (h,j) Analysis of the mitochondrial morphology as in (g,i) expressed as mitochondria footprint (left panels), mean branch length (middle panels) and count branches (right panels). All values were normalized for the cell area (μm2). Data are presented as means ± SEM, * p < 0.05, ** p < 0.01, *** p < 0.001, **** p < 0.0001 compared with wild type; # p < 0.05, ## p < 0.01, #### p < 0.001 compared with untreated SOD1G93A, n ≥ 4 per group and n = 35 cells each for the MiNA. p values were obtained using parametric one-way ANOVA with Bonferroni post hoc test.
Figure 5
Figure 5
Trimetazidine treatment stimulates autophagy and mitophagy processes. (a,b) Representative FIB/SEM micrographs illustrate that Trimetazidine (TMZ) treatment in primary spinal cord (a) and cortical (b) cell cultures stimulates the formation of autophagosomes. (c,d) Relative quantification of data obtained in (a,b). (e) Representative confocal immunofluorescence images showing LC3 and ATBP staining and LC3/ATBP colocalization (merge) in NSC34 cell lines treated or not with 10 μM of TMZ ON as indicated. Scale bar 10 μm (f) Quantification of the LC3 puncta average number, area, fluorescence intensity and LC3/ATBP colocalization percentage from the images as in (c) performed using ImageJ quantification tool. (g) Representative Western blot image of p-Ub(S65), LC3I and its lipidated form LC3II, obtained in protein extracts from NSC34 cell lines treated or not with TMZ and NH4Cl as indicated; HSP90 was used as loading control. (h) Densitometric analysis of LC3II/HSP90 and p-Ub(S65)/HSP90 ratios from n = 4 independent experiments. Data are presented as means ± SEM, * p < 0.05, ** p < 0.01, *** p < 0.001, **** p < 0.0001 compared with wild type; ## p < 0.01, ### p < 0.001, #### p < 0.001 compared with untreated SOD1G93A; ° p < 0.05 compared with untreated NH4Cl. For ultrastructural analysis, n was ≥ 4 per group with at least 20 fields each. For immunofluorescence analysis, n was at least ≥ 4 per group with at least 35 cells. Values were obtained using parametric one-way ANOVA with Bonferroni post hoc test.
Figure 6
Figure 6
Trimetazidine treatment improves mitochondrial performances of PBMCs from ALS patients. Measurement of the rate of oxygen consumption ratio (OCR) in PBMCs isolated from ALS patients and healthy subjects treated or untreated with 10 μM of Trimetazidine (TMZ) as indicated. The histograms show the data obtained from the analysis of the Cell Mito Stress Test. In detail: (a) basal respiration, (b) ATP-linked respiration, (c) maximal respiration and (d) spare respiratory capacity. All data were analyzed with XFe Wave software and are expressed as OCR pmol/minute/μg-protein. Data are presented as means ± SEM, * p < 0.05, *** p < 0.001 compared with healthy subjects; # p < 0.05, ## p < 0.01, ### p < 0.001 compared with untreated healthy subjects; ALS patients, n = 14, healthy subjects, n = 20, each (n) with ≥ 6 technical replicates. p values were obtained using parametric one-way ANOVA with Bonferroni post hoc test.

Similar articles

Cited by

References

    1. Feldman E.L., Goutman S.A., Petri S., Mazzini L., Savelieff M.G., Shaw P.J., Sobue G. Amyotrophic Lateral Sclerosis. Lancet. 2022;400:1363–1380. doi: 10.1016/S0140-6736(22)01272-7. - DOI - PMC - PubMed
    1. Genge A., Wainwright S., Velde C. Vande Amyotrophic Lateral Sclerosis: Exploring Pathophysiology in the Context of Treatment. Amyotroph. Lateral Scler. Front. Degener. 2023:1–12. doi: 10.1080/21678421.2023.2278503. - DOI - PubMed
    1. Levi Montalcini R., Feldman E.L., Goutman S.A., Hardiman O., Al-Chalabi A., Chió A., Savelieff M.G., Kiernan M.C. Amyotrophic Lateral Sclerosis 2 Recent Advances in the Diagnosis and Prognosis of Amyotrophic Lateral Sclerosis. Ser. Lancet Neurol. 2022;21:480–493. doi: 10.1016/S1474-4422(21)00465-8. - DOI - PMC - PubMed
    1. Akçimen F., Lopez E.R., Landers J.E., Nath A., Chiò A., Chia R., Traynor B.J. Amyotrophic Lateral Sclerosis: Translating Genetic Discoveries into Therapies. Nat. Rev. Genet. 2023;24:642–658. doi: 10.1038/s41576-023-00592-y. - DOI - PMC - PubMed
    1. Talbott E.O., Malek A.M., Lacomis D. The Epidemiology of Amyotrophic Lateral Sclerosis. Handb. Clin. Neurol. 2016;138:225–238. doi: 10.1016/B978-0-12-802973-2.00013-6. - DOI - PubMed