

A Comparative Investigation of the Bile Microbiome in Patients with Choledocholithiasis and Cholecystolithiasis through Metagenomic Analysis
- PMID: 38542271
- PMCID: PMC10970684
- DOI: 10.3390/ijms25063297
A Comparative Investigation of the Bile Microbiome in Patients with Choledocholithiasis and Cholecystolithiasis through Metagenomic Analysis
Abstract
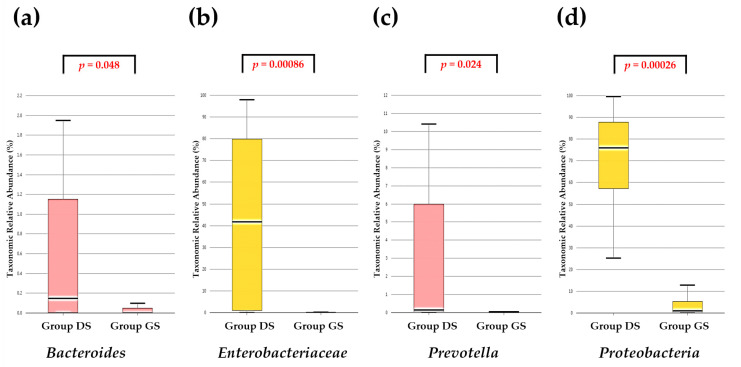
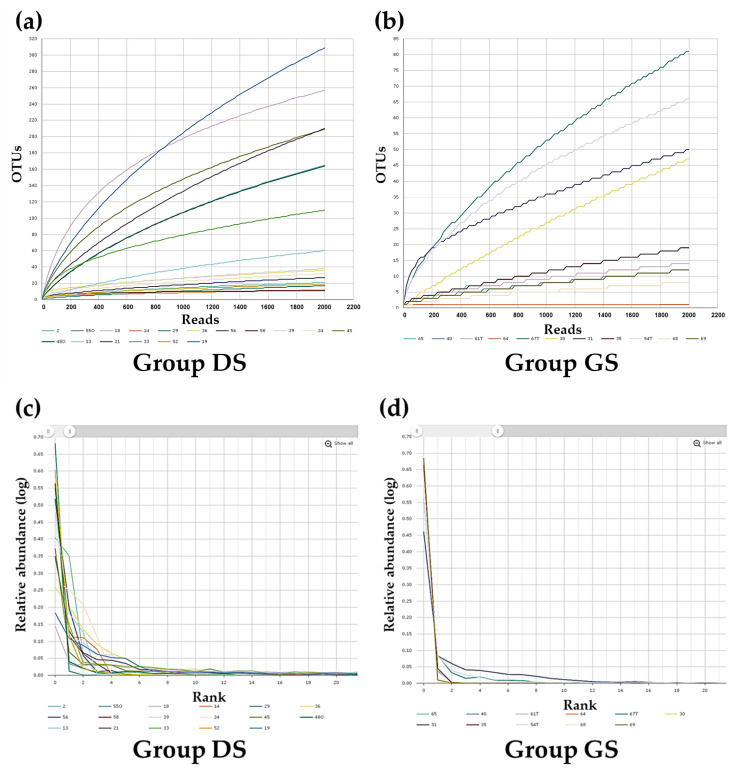
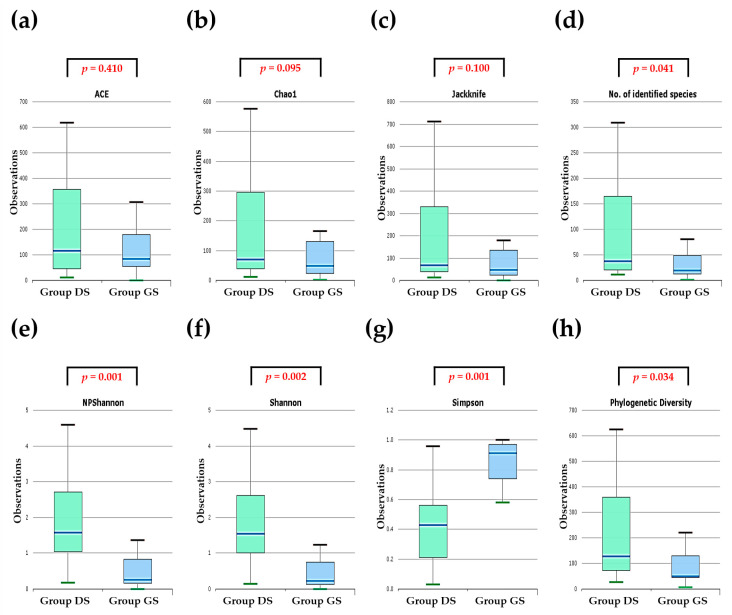
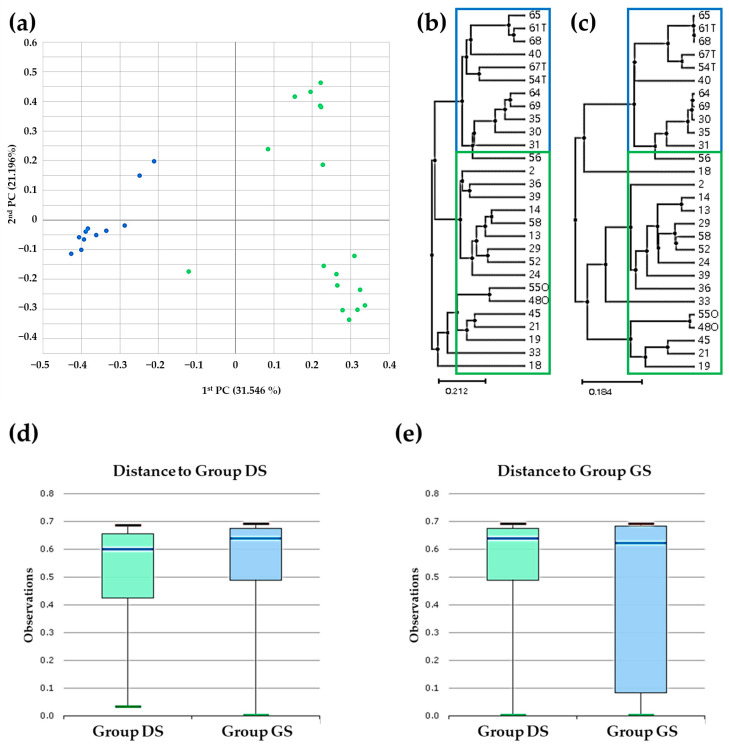
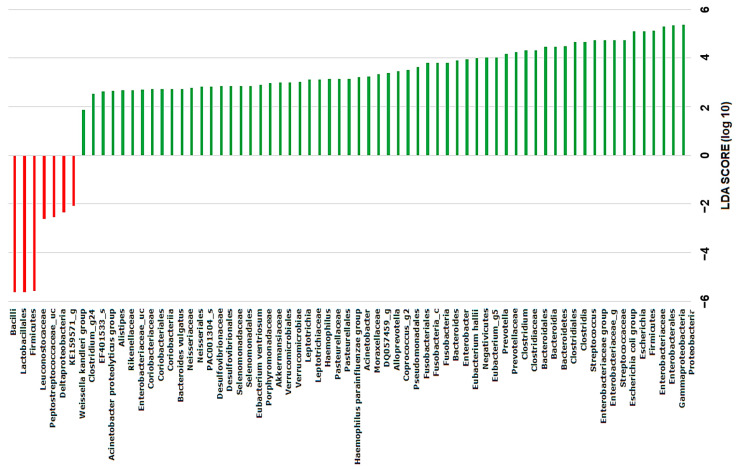
While the precise triggers of gallstone formation remain incompletely understood, it is believed to arise from a complex interplay of genetic and environmental factors. The bile microbiome is being increasingly recognized as a possible contributor to the onset of gallstone disease. The primary objective of this study was to investigate distinctions in the microbial communities within bile specimens from patients with choledocholithiasis (common bile duct stones) and cholecystolithiasis (gallbladder stones). We employed massively parallel sequencing of the 16S rRNA gene to examine the microbial communities within bile samples obtained from 28 patients with choledocholithiasis (group DS) and cholecystolithiasis (group GS). The taxonomic composition of the bile microbial communities displayed significant disparities between the group DS and the group GS. Within the 16 prevalent genera, only Streptococcus, Ralstonia, Lactobacillus, and Enterococcus were predominantly found in the group GS. In contrast, the group DS displayed a more diverse range of genera. The alpha diversity of bile specimens was also notably lower in the group GS compared to the group DS (p = 0.041). Principal coordinate analysis unveiled distinct clustering of bile microbial communities depending on the location of the gallstone. Linear discriminant analysis effect size analysis, with a score threshold of >3 and the Kruskall-Wallis test (α < 0.05), recognized Bacilli and Lactobacillales as potential taxonomic markers for distinguishing patients with cholecystolithiasis limited to the gallbladder. Significant variations were found in the distribution and diversity of bile microbial communities between patients with choledocholithiasis and cholecystolithiasis. This observation suggests that alterations in the bile microbiome may contribute to the development of gallstones in these patients.
Keywords: 16S rRNA gene sequencing; bile microbial communities; choledocholithiasis; cholelithiasis; common bile duct; gallbladder; metagenomic analysis.
Conflict of interest statement
The authors declare no conflicts of interest.
Figures

Similar articles
-
Effect of sphincter of Oddi dysfunction on the abundance of biliary microbiota (biliary microecology) in patients with common bile duct stones.Front Cell Infect Microbiol. 2022 Dec 7;12:1001441. doi: 10.3389/fcimb.2022.1001441. eCollection 2022. Front Cell Infect Microbiol. 2022. PMID: 36569207 Free PMC article.
-
Bile Microbiota in Patients with Pigment Common Bile Duct Stones.J Korean Med Sci. 2021 Apr 19;36(15):e94. doi: 10.3346/jkms.2021.36.e94. J Korean Med Sci. 2021. PMID: 33876584 Free PMC article.
-
Characteristics and metabolic potential of biliary microbiota in patients with giant common bile duct stones.Front Cell Infect Microbiol. 2023 Nov 6;13:1259761. doi: 10.3389/fcimb.2023.1259761. eCollection 2023. Front Cell Infect Microbiol. 2023. PMID: 38029241 Free PMC article.
-
Gallstone disease: Epidemiology, pathogenesis, and classification of biliary stones (common bile duct and intrahepatic).Best Pract Res Clin Gastroenterol. 2006;20(6):1075-83. doi: 10.1016/j.bpg.2006.05.009. Best Pract Res Clin Gastroenterol. 2006. PMID: 17127189 Review.
-
Laparoscopy in cholecysto-choledocholithiasis.Best Pract Res Clin Gastroenterol. 2014 Feb;28(1):195-209. doi: 10.1016/j.bpg.2013.11.015. Epub 2013 Dec 6. Best Pract Res Clin Gastroenterol. 2014. PMID: 24485266 Review.
Cited by
-
Microbial characteristics of bile in gallstone patients: a comprehensive analysis of 9,939 cases.Front Microbiol. 2024 Dec 19;15:1481112. doi: 10.3389/fmicb.2024.1481112. eCollection 2024. Front Microbiol. 2024. PMID: 39749136 Free PMC article.
-
Advances in research on the role of gut microbiota in the pathogenesis and precision management of gallstone disease.Front Med (Lausanne). 2025 Jun 25;12:1535355. doi: 10.3389/fmed.2025.1535355. eCollection 2025. Front Med (Lausanne). 2025. PMID: 40636353 Free PMC article. Review.
References
-
- Stewart L., Griffiss J.M., Jarvis G.A., Way L.W. Gallstones containing bacteria are biofilms: Bacterial slime production and ability to form pigment solids determines infection severity and bacteremia. J. Gastrointest. Surg. Off. J. Soc. Surg. Aliment. Tract. 2007;11:977–983; discussion 983–974. doi: 10.1007/s11605-007-0168-1. - DOI - PubMed
MeSH terms
Substances
Grants and funding
LinkOut - more resources
Full Text Sources
