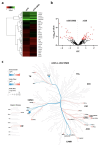
Integrative Kinase Activity Profiling and Phosphoproteomics of rd10 Mouse Retina during cGMP-Dependent Retinal Degeneration
- PMID: 38542418
- PMCID: PMC10970885
- DOI: 10.3390/ijms25063446
Integrative Kinase Activity Profiling and Phosphoproteomics of rd10 Mouse Retina during cGMP-Dependent Retinal Degeneration
Abstract
Inherited retinal degenerative diseases (IRDs) are a group of rare diseases that lead to a progressive loss of photoreceptor cells and, ultimately, blindness. The overactivation of cGMP-dependent protein kinase G (PKG), one of the key effectors of cGMP-signaling, was previously found to be involved in photoreceptor cell death and was studied in murine IRD models to elucidate the pathophysiology of retinal degeneration. However, PKG is a serine/threonine kinase (STK) with several hundred potential phosphorylation targets and, so far, little is known about the specificity of the target interaction and downstream effects of PKG activation. Here, we carried out both the kinome activity and phosphoproteomic profiling of organotypic retinal explant cultures derived from the rd10 mouse model for IRD. After treating the explants with the PKG inhibitor CN03, an overall decrease in peptide phosphorylation was observed, with the most significant decrease occurring in seven peptides, including those from the known PKG substrate cyclic-AMP-response-element-binding CREB, but also Ca2+/calmodulin-dependent kinase (CaMK) peptides and TOP2A. The phosphoproteomic data, in turn, revealed proteins with decreased phosphorylation, as well as proteins with increased phosphorylation. The integration of both datasets identified common biological networks altered by PKG inhibition, which included kinases predominantly from the so-called AGC and CaMK families of kinases (e.g., PKG1, PKG2, PKA, CaMKs, RSKs, and AKTs). A pathway analysis confirmed the role of CREB, Calmodulin, mitogen-activated protein kinase (MAPK) and CREB modulation. Among the peptides and pathways that showed reduced phosphorylation activity, the substrates CREB, CaMK2, and CaMK4 were validated for their retinal localization and activity, using immunostaining and immunoblotting in the rd10 retina. In summary, the integrative analysis of the kinome activity and phosphoproteomic data revealed both known and novel PKG substrates in a murine IRD model. This data establishes a basis for an improved understanding of the biological pathways involved in cGMP-mediated photoreceptor degeneration. Moreover, validated PKG targets like CREB and CaMKs merit exploration as novel (surrogate) biomarkers to determine the effects of a clinical PKG-targeted treatment for IRDs.
Keywords: CREB; CaMK; PKG; kinome activity profiling; phosphoproteomics; rd10.
Conflict of interest statement
A.R., M.N., T.T. and J.G. are former or current employees of PamGene International B.V., ‘s-Hertogenbosch, The Netherlands. T.T. is currently employed by the company Lava Therapeutics N.V., P.E. and F.P.-D. are shareholders of, or have other financial interests in, the company Mireca Medicines, Tübingen, Germany, which intends to forward the clinical testing of PKG inhibitors. The remaining authors declare that the research was conducted in the absence of any commercial or financial relationships that could be construed as a potential conflict of interest.
Figures


Similar articles
-
PKG-Mediated Phosphorylation of TOP2A Activates HDAC to Drive Photoreceptor Cell Death in rd1 Mouse Inherited Retinal Degeneration.J Neurochem. 2025 May;169(5):e70077. doi: 10.1111/jnc.70077. J Neurochem. 2025. PMID: 40320856
-
Identification of Novel Substrates for cGMP Dependent Protein Kinase (PKG) through Kinase Activity Profiling to Understand Its Putative Role in Inherited Retinal Degeneration.Int J Mol Sci. 2021 Jan 25;22(3):1180. doi: 10.3390/ijms22031180. Int J Mol Sci. 2021. PMID: 33503999 Free PMC article.
-
Kinase activity profiling identifies putative downstream targets of cGMP/PKG signaling in inherited retinal neurodegeneration.Cell Death Discov. 2022 Mar 3;8(1):93. doi: 10.1038/s41420-022-00897-7. Cell Death Discov. 2022. PMID: 35241647 Free PMC article.
-
Novel roles of cAMP/cGMP-dependent signaling in platelets.J Thromb Haemost. 2012 Feb;10(2):167-76. doi: 10.1111/j.1538-7836.2011.04576.x. J Thromb Haemost. 2012. PMID: 22136590 Review.
-
The Role of NO/sGC/cGMP/PKG Signaling Pathway in Regulation of Platelet Function.Cells. 2022 Nov 21;11(22):3704. doi: 10.3390/cells11223704. Cells. 2022. PMID: 36429131 Free PMC article. Review.
Cited by
-
Several Common Genetic Variations Associate With Functional or Anatomic Effects of Anti-VEGF Treatment in Conditions With Macular Edema.Invest Ophthalmol Vis Sci. 2025 Jun 2;66(6):2. doi: 10.1167/iovs.66.6.2. Invest Ophthalmol Vis Sci. 2025. PMID: 40455044 Free PMC article.
-
Protein kinase G inhibition preserves photoreceptor viability and function in a new mouse model for autosomal dominant retinitis pigmentosa.Cell Death Dis. 2025 Jul 30;16(1):575. doi: 10.1038/s41419-025-07901-9. Cell Death Dis. 2025. PMID: 40738887 Free PMC article.
References
-
- Koch M., Scheel C., Ma H., Yang F., Stadlmeier M., Glück A.F., Murenu E., Traube F.R., Carell T., Biel M., et al. The cGMP-Dependent Protein Kinase 2 Contributes to Cone Photoreceptor Degeneration in the Cnga3-Deficient Mouse Model of Achromatopsia. Int. J. Mol. Sci. 2020;22:52. doi: 10.3390/ijms22010052. - DOI - PMC - PubMed
-
- Vighi E., Trifunovic D., Veiga-Crespo P., Rentsch A., Hoffmann D., Sahaboglu A., Strasser T., Kulkarni M., Bertolotti E., van den Heuvel A., et al. Combination of cGMP analogue and drug delivery system provides functional protection in hereditary retinal degeneration. Proc. Natl. Acad. Sci. USA. 2018;115:E2997–E3006. doi: 10.1073/pnas.1718792115. - DOI - PMC - PubMed
-
- Arango-Gonzalez B., Trifunović D., Sahaboglu A., Kranz K., Michalakis S., Farinelli P., Koch S., Koch F., Cottet S., Janssen-Bienhold U., et al. Identification of a Common Non-Apoptotic Cell Death Mechanism in Hereditary Retinal Degen-eration. PLoS ONE. 2014;9:e112142. doi: 10.1371/journal.pone.0112142. - DOI - PMC - PubMed
MeSH terms
Substances
LinkOut - more resources
Full Text Sources
Molecular Biology Databases
Miscellaneous

