Review
. 2024 Mar 19;25(6):3455.
doi: 10.3390/ijms25063455.

Optical Intracranial Self-Stimulation (oICSS): A New Behavioral Model for Studying Drug Reward and Aversion in Rodents

Affiliations
Review

Optical Intracranial Self-Stimulation (oICSS): A New Behavioral Model for Studying Drug Reward and Aversion in Rodents

Rui Song et al. Int J Mol Sci. .

Abstract

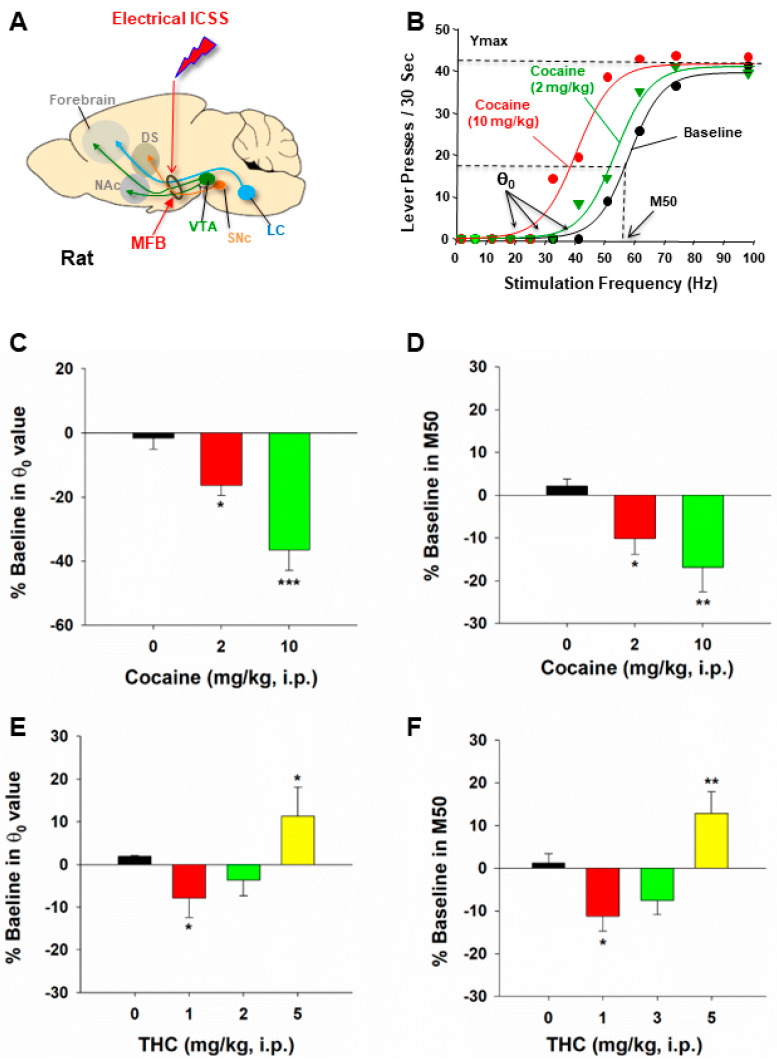
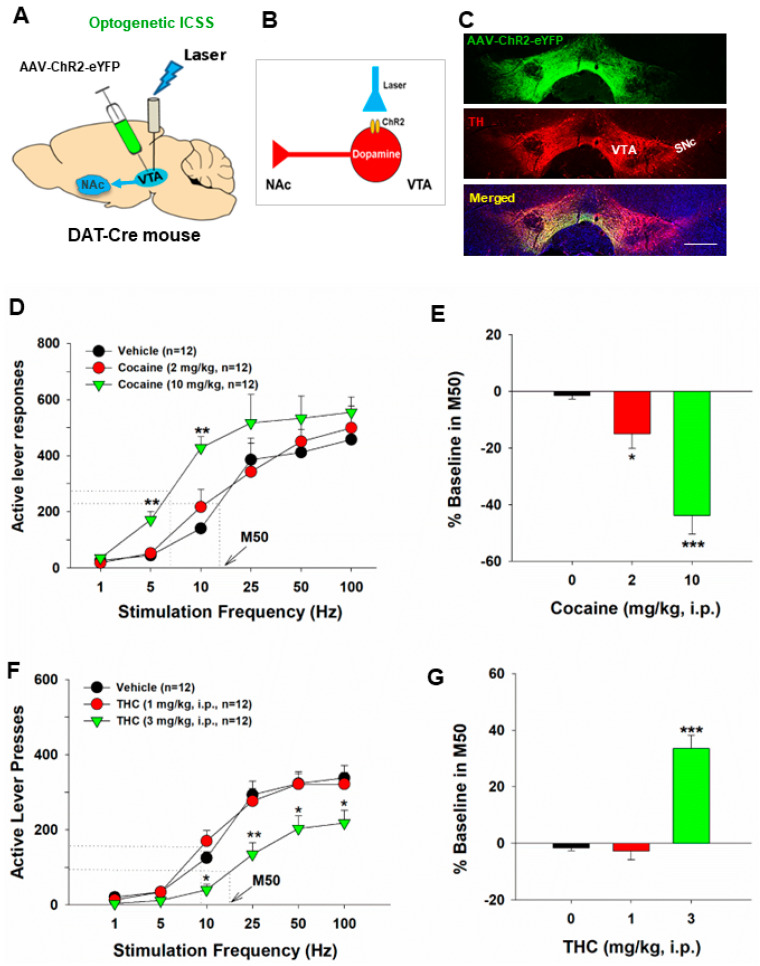
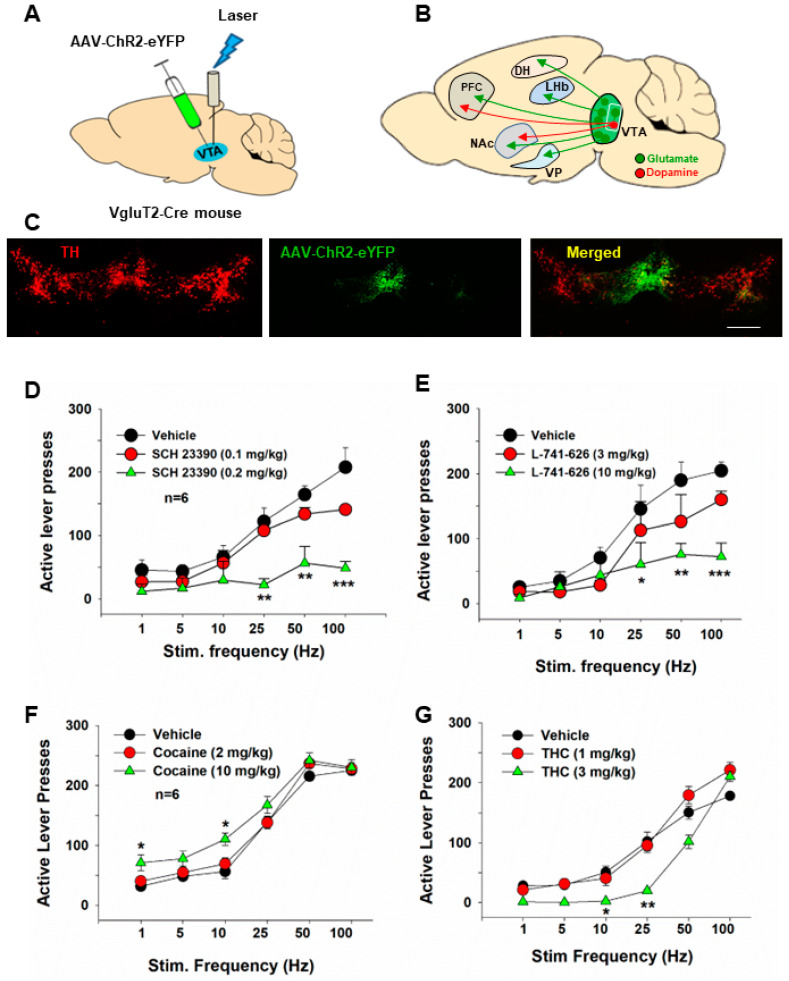
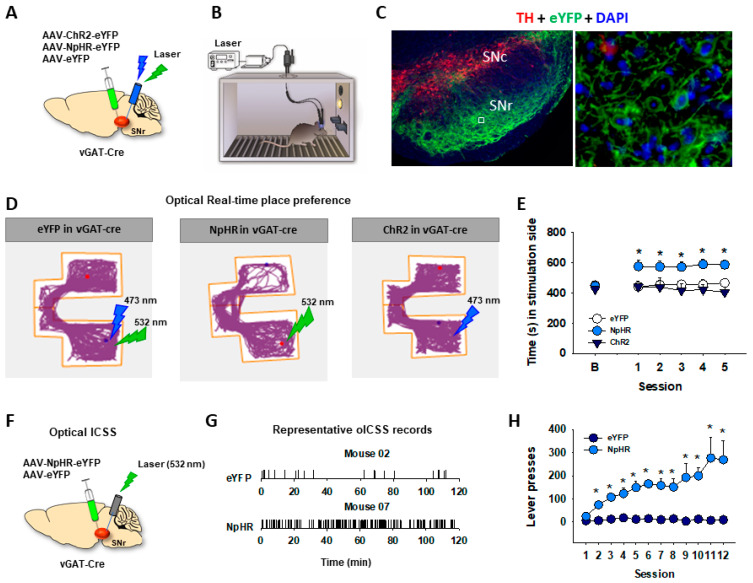
Brain-stimulation reward, also known as intracranial self-stimulation (ICSS), is a commonly used procedure for studying brain reward function and drug reward. In electrical ICSS (eICSS), an electrode is surgically implanted into the medial forebrain bundle (MFB) in the lateral hypothalamus or the ventral tegmental area (VTA) in the midbrain. Operant lever responding leads to the delivery of electrical pulse stimulation. The alteration in the stimulation frequency-lever response curve is used to evaluate the impact of pharmacological agents on brain reward function. If a test drug induces a leftward or upward shift in the eICSS response curve, it implies a reward-enhancing or abuse-like effect. Conversely, if a drug causes a rightward or downward shift in the functional response curve, it suggests a reward-attenuating or aversive effect. A significant drawback of eICSS is the lack of cellular selectivity in understanding the neural substrates underlying this behavior. Excitingly, recent advancements in optical ICSS (oICSS) have facilitated the development of at least three cell type-specific oICSS models-dopamine-, glutamate-, and GABA-dependent oICSS. In these new models, a comparable stimulation frequency-lever response curve has been established and employed to study the substrate-specific mechanisms underlying brain reward function and a drug's rewarding versus aversive effects. In this review article, we summarize recent progress in this exciting research area. The findings in oICSS have not only increased our understanding of the neural mechanisms underlying drug reward and addiction but have also introduced a novel behavioral model in preclinical medication development for treating substance use disorders.

Keywords: aversion; brain-stimulation reward (BSR); drugs of abuse; intracranial self-stimulation (ICSS); optical ICSS; optogenetics; reward.


Conflict of interest statement

The authors declare no conflict of interest.

Figures

Figure 1
Figure 1
The effects of cocaine and THC on electrical brain-stimulation reward (BSR) in rats. (A) A diagram illustrates the medial forebrain bundle at the anterior–posterior level of the lateral hypothalamus and the location of a stimulation electrode for electrical BSR. (B) Representative stimulation–response curves, indicating that systemic administration of cocaine shifted the stimulation–response curve to the left and decreased the BSR stimulation threshold (θ0) and M50. (C,D) The effects of cocaine on the mean (±SEM) values of BSR stimulation threshold (θ0) (C) and M50 (D), indicating that cocaine dose-dependently shifted the frequency-rate response curve to the left and decreased the θ0 and M50 values. (E,F) The effects of THC on the mean (± SEM) values of θ0 (E) and M50 (F), indicating that THC produced biphasic effects—THC, at a low dose (1 mg/kg, i.p.) shifted the frequency-rate response curve to the left and decreased the θ0 and M50 values, while, at a high dose (5 mg/kg), THC shifted the curve to the right and increases θ0 and M50 values. * p < 0.05, ** p < 0.01, *** p < 0.001, compared to the vehicle control group; one-way ANOVA followed by post-hoc Student–Newman–Keuls tests for multiple group comparisons. The different colors represent different drug doses. Adapted from Xi et al., 2010 and Spiller et al., 2019 [15,38].
Figure 2
Figure 2
Optical intracranial self-stimulation (oICSS) experiment in DAT-Cre mice. (A) Schematic diagrams illustrating that AAV-ChR2-eYFP vectors were microinjected into the lateral VTA and optical fibers (i.e., optrodes) were implanted in the same brain region. (B) A diagram illustrates how AAV-ChR2 is expressed on VTA DA neurons, which can be activated by a 473 nm laser. (C) Representative images of AAV-ChR2-eYFP and TH expression in the VTA. The scale bar indicates 200 μM. (D) the stimulation-rate response curves, indicating that optogenetic activation of VTA DA neurons induced robust oICSS behavior (lever presses) in DAT-Cre mice in a stimulation frequency–dependent manner. Systemic administration of cocaine shifted the frequency–rate response curve to the left and decreased M50 values. (E) Cocaine-induced % changes in M50 over pre-cocaine baseline. (F) Effects of THC on DA-dependent oICSS. Systemic administration of THC dose-dependently shifted the curve to the right and increased M50 values. (G) THC–induced % changes in M50 over pre-THC baseline. * p < 0.05, ** p < 0.01, *** p < 0.001, compared with the vehicle control group. The different colors represent the different treatment or drug dose groups. Adapted from Hempel et al., 2023 and Jordan et al., 2020 [82,83].
Figure 3
Figure 3
Optical intracranial self-stimulation (oICSS) experiment in VgluT2-Cre mice. (A) Schematic diagrams illustrating the target brain region (VTA) of the AAV-ChR2-GFP microinjection and intracranial optical fiber implantation. (B) Schematic diagram showing VTA glutamate projections. Within the VTA, some glutamate neurons locally synapse onto DA neurons. (C) Representative images of AAV-ChR2-EGFP expression in the medial VTA. The scale bar indicates 200 μM. (D,E) The stimulation frequency-rate response curve, indicating that optical stimulation of VTA glutamate neurons produced robust oICSS in VgluT2-Cre mice in a stimulation frequency-dependent manner. Systemic administration of SCH23390, a selective D1 receptor antagonist significantly inhibited the oICSS (D), while L-741,626, a selective D2 receptor antagonist, also dose-dependently inhibited the oICSS (E). (F,G) Systemic administration of cocaine dose-dependently shifted the rate-frequency function curve leftward and upward in VgluT2-Cre mice (F), while THC produced the opposite effect, producing a dose-dependent rightward shift (G). * p < 0.05, ** p < 0.01, *** p < 0.001, compared with the vehicle control group. Adapted from Han et al., 2017 [14].
Figure 4
Figure 4
Optical inhibition of GABA neurons in the substantia nigra reticulata is rewarding as assessed by real-time place preference (RTPP) and optical ICSS (oICSS). (A,B) The general experimental procedures. (C) Representative images, illustrating AAV-NpHR-eYFP (green) expression in SNr GABA neurons, not in TH+ (red) DA neurons. (D) Representative locomotor tracing records, indicating that optical inhibition of SNr GABA neurons was rewarding in vGAT-Cre mice, whereas optical activation of SNr GABA neurons in vGAT-Cre mice was neither rewarding nor aversive. vGAT-Cre mice with NpHR-eYFP expression in SNr GABA neurons spent more time on the green laser (532 nm)-paired compartment (middle panel), but no change in place preference was observed in vGAT-Cre mice transfected with ChR2-eYFP in SNr GABA neurons (right panel). Laser stimulation (either 473 nm or 532 nm) had no effect in vGAT-Cre mice transfected the control AAV-eYFP (left panel). (E) Optical RTPP across 5 consecutive test sessions, illustrating that only vGAT-Cre mice with NpHR expression in SNr GABA neurons showed significant laser-paired place preference. (F) The general experimental procedures of oICSS. (G) Representative oICSS records, illustrating that vGAT-Cre mice with intra-SNr NpHR microinjections exhibited robust oICSS, whereas in mice with intra-SNr AAV-eYFP control virus microinjections did not. (H) The time courses of oICSS during 12 d of oICSS training, indicating that optical inhibition of SNr GABA neurons is rewarding. A small white box in C shows the area where the right high-magnification image was taken. * p < 0.05 as compared to the baseline (D) or eYFP control virus group (E). Adapted from Galaj et al. [51].

Similar articles

References

    1. Negus S.S., Miller L.L. Intracranial self-stimulation to evaluate abuse potential of drugs. Pharmacol. Rev. 2014;66:869–917. doi: 10.1124/pr.112.007419. - DOI - PMC - PubMed
    1. Gardner E.L. Addiction and brain reward and antireward pathways. Adv. Psychosom. Med. 2011;30:22–60. - PMC - PubMed
    1. Hernandez G., Haines E., Shizgal P. Potentiation of intracranial self-stimulation during prolonged subcutaneous infusion of cocaine. J. Neurosci. Methods. 2008;175:79–87. doi: 10.1016/j.jneumeth.2008.08.005. - DOI - PubMed
    1. Trujillo-Pisanty I., Conover K., Solis P., Palacios D., Shizgal P. Dopamine neurons do not constitute an obligatory stage in the final common path for the evaluation and pursuit of brain stimulation reward. PLoS ONE. 2020;15:e0226722. doi: 10.1371/journal.pone.0226722. - DOI - PMC - PubMed
    1. Olds J., Milner P. Positive reinforcement produced by electrical stimulation of septal area and other regions of rat brain. J. Comp. Physiol. Psychol. 1954;47:419–427. doi: 10.1037/h0058775. - DOI - PubMed

LinkOut - more resources