. 2024 Mar 19;25(6):3460.
doi: 10.3390/ijms25063460.

Exploring the Role of Platelets in Virus-Induced Inflammatory Demyelinating Disease and Myocarditis

Affiliations

Exploring the Role of Platelets in Virus-Induced Inflammatory Demyelinating Disease and Myocarditis

Ijaz Ahmad et al. Int J Mol Sci. .

Abstract

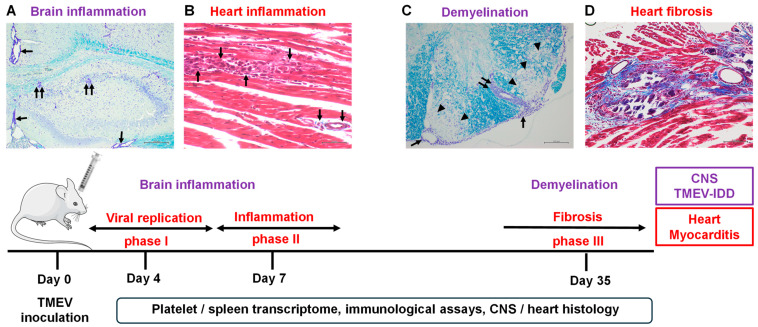
Theiler's murine encephalomyelitis virus (TMEV) infection has been used as a mouse model for two virus-induced organ-specific immune-mediated diseases. TMEV-induced demyelinating disease (TMEV-IDD) in the central nervous system (CNS) is a chronic inflammatory disease with viral persistence and an animal model of multiple sclerosis (MS) in humans. TMEV infection can also cause acute myocarditis with viral replication and immune cell infiltration in the heart, leading to cardiac fibrosis. Since platelets have been reported to modulate immune responses, we aimed to determine the role of platelets in TMEV infection. In transcriptome analyses of platelets, distinct sets of immune-related genes, including major histocompatibility complex (MHC) class I, were up- or downregulated in TMEV-infected mice at different time points. We depleted platelets from TMEV-infected mice by injecting them with platelet-specific antibodies. The platelet-depleted mice had significantly fewer viral antigen-positive cells in the CNS. Platelet depletion reduced the severities of TMEV-IDD and myocarditis, although the pathology scores did not reach statistical significance. Immunologically, the platelet-depleted mice had an increase in interferon (IFN)-γ production with a higher anti-TMEV IgG2a/IgG1 ratio. Thus, platelets may play roles in TMEV infection, such as gene expression, viral clearance, and anti-viral antibody isotype responses.

Keywords: RNA sequencing analyses; bioinformatics analysis; dilated cardiomyopathy; glycoprotein Ib α chain; neuroinflammatory disease; picornavirus infections; regulation of gene expression.


Conflict of interest statement

The authors declare no conflicts of interest.

Figures

Figure 1
Figure 1
Schematic representation of the time course and experiments of Theiler’s murine encephalomyelitis virus (TMEV) infection. (A,C) In the central nervous system (CNS), following virus inoculation, TMEV initially infects neurons in the gray matter of the brain and causes inflammation (polioencephalitis). Later, around 1 month post infection (p.i.), TMEV persistently infects the white matter of the spinal cord and induces inflammatory demyelination. In Luxol fast blue stain, the arrowheads, arrows, and paired arrows indicate demyelination, meningitis, and perivascular cuffing (inflammation), respectively. Scale bars: (A) 200 μm; and (C) 100 μm. (B,D) TMEV-induced myocarditis can be divided into three phases. In phase I (around 4 days p.i.), TMEV directly attacks cardiomyocytes by infecting and replicating (viral pathology). In phase II (around 1 week p.i.), anti-viral T cell and antibody responses are induced, which not only clear the virus but also damage cardiomyocytes (immunopathology). In phase III (around 1 month p.i.), when the tissue damage caused in phases I and II is severe, it leads to cardiac fibrosis. In Masson’s trichrome stain, the arrows indicate cardiac inflammation; the blue and dark purple colors show fibrosis and calcification, respectively. Scale bars: (B) 50 μm; and (D) 100 μm. (Bottom) Experimental designs of this study. We intracerebrally inoculated mice with TMEV and harvested the spleen and platelet samples for transcriptome analyses, sera and lymphocytes for immunological assays, and the CNS and heart tissues for histological analyses 4, 7, and 35 days p.i.
Figure 2
Figure 2
Transcriptome analyses of the spleen from TMEV-infected mice. (AC) We created heat maps of the top 20 up- and downregulated genes 4 (A), 7 (B), and 35 (C) days p.i. The red, blue, and white colors indicate upregulation, downregulation, and no change, respectively, compared with the control samples. Each column represents the data from one mouse (five mice/time point). (D) We conducted k-means clustering and divided the genes into the 15 clusters based on their expression patterns. In a radar chart of the 15 cluster centers, radial axis values are fold-changes in the cluster center gene expressions compared with controls, which ranged from −1 to 1. These values are shown in binary logarithm (log2): −1, two-fold downregulation; 0, no change; and 1, two-fold upregulation, compared with controls. Cluster 6, composed of innate immune genes, including interferon (IFN)-induced genes, was upregulated 4 and 7 days p.i. Cluster 14, consisting of various immunoglobulin (Ig) and T cell receptor (TCR) genes, was upregulated 7 days p.i.; and cluster 15, composed of a smaller number of distinct Ig and TCR genes, was upregulated 35 days p.i. (E) Expression patterns of clusters 6, 14, and 15 showed the temporal gene expressions at each time point; the red lines indicate the cluster centers. The number of genes in each cluster is shown at the top of each cluster.
Figure 3
Figure 3
Transcriptome analyses of the platelets from TMEV-infected mice. (AC) We created heat maps of the top 20 up- and downregulated genes 4 (A), 7 (B), and 35 (C) days p.i. The red, blue, and white colors indicate upregulation, downregulation, and no change, respectively, compared with the control samples. (D) We conducted k-means clustering and divided the genes into nine clusters based on their expression patterns. A radar chart using the nine cluster centers showed the distinct expression patterns of the platelet transcriptomes at each time point. Radial axis values are the cluster center gene changes compared with controls, which ranged from −2 to 2 and are shown in log2: −2, four-fold downregulation; 0, no change; and 2, four-fold upregulation, compared with controls. Genes in four clusters (clusters 4, 6, 7, and 8) changed their expressions at one time point. Genes in cluster 5 had few changes. Four clusters (clusters 1, 2, 3, and 9) included genes changed at two or three time points. (E) Expression patterns of three clusters (clusters 3, 7, and 9) showed the temporal gene expression patterns at each time point; the red lines indicate the cluster centers. Number of genes in each cluster is shown at the top of each cluster. Each time point was composed of five to seven mice.
Figure 4
Figure 4
Principal component analysis (PCA) of splenic and platelet transcriptome data between TMEV-infected and control mice at each time point. (A) In the spleen, the samples were separated significantly by principal component (PC) 2 values between the TMEV-infected and control groups 7 days p.i.: TMEV (▲), −394.33 ± 14.32; control (△), −347.48 ± 7.95, p < 0.05, and 35 days p.i.: TMEV (■), 541.66 ± 4.30; control (□), 587.18 ± 15.10, p < 0.05, but not 4 days p.i.: TMEV (●), 68.42 ± 16.09; control (○), 46.06 ± 12.16, p = 0.348. (B) In platelets, the samples were not separated into distinct groups at any time point.
Figure 5
Figure 5
PCA of the platelet transcriptome data from TMEV-infected and control mice on day 4 (TMEV, ●; control, ○), day 7 (TMEV, ▲; control, △), and day 35 (TMEV, ■; control, □). (A,B) In the control samples, a PCA separated the samples into two groups: one group was composed of days 4 and 7 samples, and the other was composed of day 35 samples. The values in parenthesis indicated the proportion of variance of each PC. When the PC1 values were compared among the three time points, the PC1 values of day 35 samples were significantly different from those of days 4 and 7 samples (**, p < 0.01; ***, p < 0.001, ANOVA). (C,D) In the TMEV-infected samples, PCA and their PC1 values at each time point showed similar profiles to the control samples. In the boxplots: the open square, middle line, box, lower whisker, upper whisker, and closed rhombus indicate the mean, median, interquartile range, minimum, maximum, and outlier, respectively. The total sample number was five to seven per time point.
Figure 6
Figure 6
Platelet detection in the brain and heart of TMEV-infected mice. (A,C) We killed the uninfected mice and conducted immunohistochemistry against the platelet glycoprotein Ibα (GPIbα/CD42b) using brain and heart sections. We could not detect platelets in the brain of uninfected mice, although we detected a small number of platelets (arrows) in the heart. (B,D) We killed TMEV-infected mice 7 days p.i. and detected platelets attached to the luminal side of vascular endothelia in the brain and more diffusely in the heart. (A,B) hippocampus; and (C,D) heart. Scale bar: (AD) 100 μm; and inset, 50 μm.
Figure 7
Figure 7
Immunohistochemistry against viral antigens in the spinal cord of TMEV-infected mice. We infected mice with TMEV, divided the mice into three groups, and intravenously injected them with a platelet-specific glycoprotein Ibα chain (GPIbα) depletion antibody 0 and 5 days p.i. (early group) or 18 and 22 days p.i. (late group), or with the control antibody (control group). (A) We found fewer viral antigen+ cells (arrows) in the spinal cords of the early and late groups than in the control group. (B) Overall, we found significantly fewer viral antigen+ cells in the early (**, p < 0.01, ANOVA) and late (* p < 0.05, ANOVA) groups than the control group. In the ventral funiculus, we detected a smaller number of viral antigen+ cells in the early and late groups than in the control group. There was a statistical difference between the early and control groups (*, p < 0.05, ANOVA); the number of viral antigen+ cells tended to be lower in the late group than in the control group (p = 0.053, ANOVA). We detected significantly fewer viral antigen+ cells in the lateral funiculi of the early and late groups compared with the control group (*, p < 0.05, ANOVA). The spinal cord was divided into 12 to 13 transverse sections per mouse. (C) We quantified the pathological changes in the spinal cord using a spinal cord pathology scoring system. The levels of demyelination (p = 0.098, ANOVA) and overall pathology (p = 0.088, ANOVA) tended to be higher in the control group than in the early group, but not the late group. There were no differences in meningitis among the three groups, although the late group had higher scores of perivascular cuffing than the control (p = 0.053, ANOVA) and early (*, p < 0.05, ANOVA) groups. Each group was composed of five to fourteen mice. Results are the mean + standard error of the mean (SEM). Scale bar: (A), 200 μm; and inset, 20 μm. N.D., not detectable.
Figure 8
Figure 8
Cardiac pathology of TMEV-induced myocarditis. (AC) We harvested the heart 35 days p.i. and dissected each heart into six to seven transverse sections. (A) Hematoxylin and eosin staining visualized calcification (dark purple). (B) Picrosirius red staining visualized fibrosis (red). (C) Immunohistochemistry against CD3 (T cell marker) showed CD3+ T cell infiltration in the heart (arrows). (D) Although the control group had larger fibrotic areas, there were no statistical differences among the three groups. (E) The number of CD3+ T cells in the heart was significantly higher in the early group than the control and late groups (**, p < 0.01, ANOVA). There were no statistical differences in CD3+ T cells in the heart between the control and late groups. (D,E) We quantified %fibrotic areas and the number of CD3+ T cells/heart section/mouse using ImageJ (version 1.53e). Values are the mean + SEM of five to fourteen mice per group. Scale bar: (A), 50 μm; (B), 50 μm; (C), 50 μm; and inset, 20 μm.
Figure 9
Figure 9
Anti-viral IgG isotype responses in TMEV-infected mice. We collected sera from the control, early, and late groups 35 days p.i. and compared anti-TMEV antibody titers (total IgG, IgG1, and IgG2a). The antibody titers were determined by enzyme-linked immunosorbent assays (ELISAs). (A) All groups had substantially high amounts of anti-TMEV IgG titers, although the control and early groups had significantly higher amounts of anti-TMEV total IgG titers (**, p < 0.01, ANOVA), compared with late group. (B) The number of anti-TMEV IgG1 titers was significantly lower in the late group than in the control group (**, p < 0.01, ANOVA). (C) Anti-TMEV IgG2a titers were significantly higher in the early group than in the late and control groups (**, p < 0.01, ANOVA). (D) The IgG2a versus IgG1 ratios, which reflect T helper (Th) 1/Th2 balance, were significantly higher in the early and late groups than in the control group (**, p < 0.01, *, p < 0.05, ANOVA). The IgG2a/IgG1 ratios were comparable between the early and late groups. Results are the mean + SEM of five to fourteen mice per group.
Figure 10
Figure 10
Cytokine production of splenic mononuclear cells (MNCs) from the control, early, and late groups. (AD) Splenic MNCs were isolated from TMEV-infected mice and stimulated with TMEV (A,B) or a mitogen, concanavalin A (Con A) (C,D). The concentrations of interleukin (IL)-17, interferon (IFN)-γ, IL-4, and IL-10 in the culture supernatants were quantified by ELISAs. (A) There were no statistical differences in the concentrations of IFN-γ among the three groups, although the early and late groups had the higher levels of IFN-γ production than the control group in TMEV stimulation. (B) The concentrations of IL-10 were similar among the three groups. (C,D) The amounts of IL-17, IFN-γ, IL-4, and IL-10 were similar in response to Con A among the three groups. Results are the mean + SEM from two to six pools of spleens with two to three mice per group. N.D., not detectable.

Similar articles

Cited by

References

    1. Flint S.J., Racaniello V.R., Rall G.F., Hatziioannou T., Skalka A.M. Patterns and pathogenesis. In: Flint S.J., Racaniello V.R., Rall G.F., Hatziioannou T., Skalka A.M., editors. Principles of Virology, Volume 2: Pathogenesis and Control. 5th ed. ASM Press; Washington, DC, USA: 2020. pp. 146–186.
    1. Fairweather D., Rose N.R. Coxsackievirus-induced myocarditis in mice: A model of autoimmune disease for studying immunotoxicity. Methods. 2007;41:118–122. doi: 10.1016/j.ymeth.2006.07.009. - DOI - PMC - PubMed
    1. Liu J., Li Y., Liu Q., Yao Q., Wang X., Zhang H., Chen R., Ren L., Min J., Deng F., et al. SARS-CoV-2 cell tropism and multiorgan infection. Cell Discov. 2021;7:17. doi: 10.1038/s41421-021-00249-2. - DOI - PMC - PubMed
    1. Sato F., Tanaka H., Hasanovic F., Tsunoda I. Theiler’s virus infection: Pathophysiology of demyelination and neurodegeneration. Pathophysiology. 2011;18:31–41. doi: 10.1016/j.pathophys.2010.04.011. - DOI - PMC - PubMed
    1. Theiler M., Gard S. Encephalomyelitis of mice: I. Characteristics and pathogenesis of the virus. J. Exp. Med. 1940;72:49–67. doi: 10.1084/jem.72.1.49. - DOI - PMC - PubMed

Substances