. 2024 Mar 20;25(6):3476.
doi: 10.3390/ijms25063476.

Age-Dependent Inflammatory Microenvironment Mediates Alveolar Regeneration

Affiliations

Age-Dependent Inflammatory Microenvironment Mediates Alveolar Regeneration

Rui Quan et al. Int J Mol Sci. .

Abstract

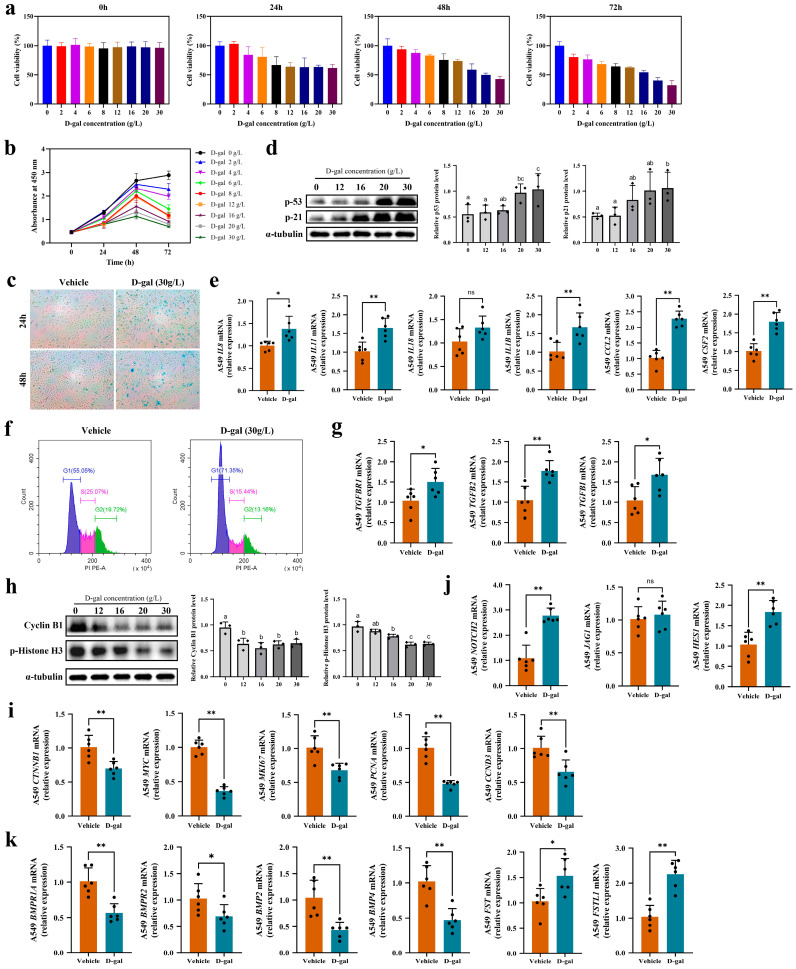
Lung aging triggers the onset of various chronic lung diseases, with alveolar repair being a key focus for alleviating pulmonary conditions. The regeneration of epithelial structures, particularly the differentiation from type II alveolar epithelial (AT2) cells to type I alveolar epithelial (AT1) cells, serves as a prominent indicator of alveolar repair. Nonetheless, the precise role of aging in impeding alveolar regeneration and its underlying mechanism remain to be fully elucidated. Our study employed histological methods to examine lung aging effects on structural integrity and pathology. Lung aging led to alveolar collapse, disrupted epithelial structures, and inflammation. Additionally, a relative quantification analysis revealed age-related decline in AT1 and AT2 cells, along with reduced proliferation and differentiation capacities of AT2 cells. To elucidate the mechanisms underlying AT2 cell functional decline, we employed transcriptomic techniques and revealed a correlation between inflammatory factors and genes regulating proliferation and differentiation. Furthermore, a D-galactose-induced senescence model in A549 cells corroborated our omics experiments and confirmed inflammation-induced cell cycle arrest and a >30% reduction in proliferation/differentiation. Physiological aging-induced chronic inflammation impairs AT2 cell functions, hindering tissue repair and promoting lung disease progression. This study offers novel insights into chronic inflammation's impact on stem cell-mediated alveolar regeneration.

Keywords: AT2; alveolar regeneration; differentiation; inflammation; proliferation.


Conflict of interest statement

The authors declare no conflicts of interest.

Figures

Figure 1
Figure 1
Age-related changes in lung structure and epithelial cell number. (a) Histological analysis of lung tissue from mice at different ages (scale bar: 100 μm), n = 6 mice; (b) high-resolution TEM imaging of AT1 (scale bar: 5 μm) and AT2 cells (scale bar: 2 μm) in 3 m and 28 m mice (n = 3); (c) immunofluorescence analysis of AT1 and AT2 cells in lung tissue (objective: ZEISS Plan-Apo 10X, 0.8NA). Violin plots show fluorescence intensity variations for AT1 and AT2 cells, as well as the AT1/AT2 ratio (n = 3 mice, with 6 quantified fields per tissue section); (dj) qRT-PCR analysis of surface marker expression of (d) Aqp5, (e) Hopx, (f) Pdpn, and (g) Igfbp2 in AT1 cells and (h) Sftpb, (i) Sftpc, and (j) Sftpd in AT2 cells in mouse lung tissues. Each group comprised 6 biological replicates (except for the 3 m group (n = 5), excluding an outlier data point from one mouse in the analysis), with 3 technical replicates. RT-qPCR results presented as mean ± SD values, with significant group differences denoted by lowercase letters (p < 0.05); (k) Western blot analysis of surface marker proteins Aqp5, HOPX, and RAGE in AT1 cells and SFTPC in AT2 cells in mouse lung tissues (n = 3), normalized to α-Tubulin loading control.
Figure 1
Figure 1
Age-related changes in lung structure and epithelial cell number. (a) Histological analysis of lung tissue from mice at different ages (scale bar: 100 μm), n = 6 mice; (b) high-resolution TEM imaging of AT1 (scale bar: 5 μm) and AT2 cells (scale bar: 2 μm) in 3 m and 28 m mice (n = 3); (c) immunofluorescence analysis of AT1 and AT2 cells in lung tissue (objective: ZEISS Plan-Apo 10X, 0.8NA). Violin plots show fluorescence intensity variations for AT1 and AT2 cells, as well as the AT1/AT2 ratio (n = 3 mice, with 6 quantified fields per tissue section); (dj) qRT-PCR analysis of surface marker expression of (d) Aqp5, (e) Hopx, (f) Pdpn, and (g) Igfbp2 in AT1 cells and (h) Sftpb, (i) Sftpc, and (j) Sftpd in AT2 cells in mouse lung tissues. Each group comprised 6 biological replicates (except for the 3 m group (n = 5), excluding an outlier data point from one mouse in the analysis), with 3 technical replicates. RT-qPCR results presented as mean ± SD values, with significant group differences denoted by lowercase letters (p < 0.05); (k) Western blot analysis of surface marker proteins Aqp5, HOPX, and RAGE in AT1 cells and SFTPC in AT2 cells in mouse lung tissues (n = 3), normalized to α-Tubulin loading control.
Figure 2
Figure 2
Profound declines in proliferative and differentiative capacities of AT2 cells with aging. (a) Immunofluorescence staining of Ki67+ AT2 cells in mouse lung tissues (objective: ZEISS Plan-Apo 20X, 0.8NA). (b) Proportion of Ki67+ AT2 cells relative to total AT2 cell population. Each age group had n = 3 mice, with 8 fields quantified per tissue section. (c) Immunofluorescence staining of primary AT2 cells at different ages after 7-day ex vivo culture to assess their potential for differentiation into AT1 cells (objective: ZEISS Plan-Apo 20X, 0.8NA). (d) Violin plots representing the ratio of AT1/AT2 fluorescence intensity as an indicator of AT2 cell differentiation capacity. Eight random fields were analyzed in each group. Results are presented as violin plots, with lowercase letters indicating significant differences (p < 0.05) between groups.
Figure 2
Figure 2
Profound declines in proliferative and differentiative capacities of AT2 cells with aging. (a) Immunofluorescence staining of Ki67+ AT2 cells in mouse lung tissues (objective: ZEISS Plan-Apo 20X, 0.8NA). (b) Proportion of Ki67+ AT2 cells relative to total AT2 cell population. Each age group had n = 3 mice, with 8 fields quantified per tissue section. (c) Immunofluorescence staining of primary AT2 cells at different ages after 7-day ex vivo culture to assess their potential for differentiation into AT1 cells (objective: ZEISS Plan-Apo 20X, 0.8NA). (d) Violin plots representing the ratio of AT1/AT2 fluorescence intensity as an indicator of AT2 cell differentiation capacity. Eight random fields were analyzed in each group. Results are presented as violin plots, with lowercase letters indicating significant differences (p < 0.05) between groups.
Figure 3
Figure 3
Inflammatory signaling in AT2 cells was activated during pulmonary aging process. (a) Transcriptomic gene expression profiles of primary AT2 cells from 3 m and 24 m mice were effectively differentiated through PCA analysis; (b) hierarchical clustering analysis of differentially expressed genes in 3 m and 24 m AT2 cells; (c) volcano plot illustrates the distribution of differentially expressed genes, their upregulation/downregulation, and the significance of differences in 3 m and 24 m AT2 cells; (d) GO functional enrichment analysis of differentially expressed genes in 3 m and 24 m AT2 cells. Top 30 significantly enriched functional terms sorted by p-value are displayed; (e) KEGG pathway enrichment analysis of differentially expressed genes, showing top 20 significantly enriched pathway terms.
Figure 4
Figure 4
Correlation analysis between proliferation- and differentiation-regulating genes in AT2 cells and inflammatory factors. Key regulatory relationships were identified by calculating the Pearson correlation coefficient with a filtering condition of |r| > 0.8 and p-value <0.05 for the correlation test. Filtered results, highlighted with significance levels (* for p-value <0.05, ** for p-value < 0.01, and *** for p-value < 0.001), are presented in figures. Heatmap (a) and circular network diagram (b) of correlations between AT2 cell proliferation-associated genes and inflammatory factors. Heatmap (c) and circular network diagram (d) of correlations between AT2 cell differentiation-associated genes and inflammatory factors.
Figure 5
Figure 5
Reduced proliferation and differentiation capacities of D-gal-induced senescent A549 cells. (a,b) Cell viability of A549 cells decreased following treatment with D-gal; (c) β-galactosidase staining reveals cellular senescence levels in D-gal-stimulated A549 cells (n = 3); (d) Western blot analysis of senescence-associated proteins in A549 cells treated with D-gal for 48 h (n = 3), normalized to α-Tubulin loading control. Significant group differences were indicated by lowercase letters (p < 0.05); (e) the expression levels of inflammatory factors in A549 cells induced with 30 g/L D-gal for 48 h (n = 6); (f) flow cytometry analysis of cell cycle in A549 cells treated with 30 g/L D-gal for 48 h (n = 3); (g) mRNA levels of TGF-β pathway-related genes in A549 cells treated with 30 g/L D-gal for 48 h (n = 6); (h) Western blot analysis of cell cycle-associated proteins in A549 cells treated with D-gal for 48 h (n = 3), normalized to α-Tubulin loading control. Significant group differences were indicated by lowercase letters (p < 0.05); gene expression levels associated with proliferation (i) and differentiation (j,k) in A549 cells treated with 30 g/L D-gal for 48 h (n = 6); (j) mRNA expression levels of Notch-pathway-related genes; (k) mRNA expression levels of BMP-pathway-related genes. Each group consisted of six biological replicates and three technical replicates in RT-qPCR experiments. Results are presented as mean ± SD values. * p < 0.05; ** p < 0.01.

References

    1. Braman S.S., Skloot G.S. Pulmonary disease in the aging patient preface. Clin. Geriatr. Med. 2017;33:XI. doi: 10.1016/j.cger.2017.08.001. - DOI - PubMed
    1. Meiners S., Eickelberg O., Königshoff M. Hallmarks of the ageing lung. Eur. Respir. J. 2015;45:807–827. doi: 10.1183/09031936.00186914. - DOI - PubMed
    1. American Lung Association Trends in Pneumonia and Influenza Morbidity and Mortality. [(accessed on 10 July 2023)]. Available online: https://www.lung.org/getmedia/98f088b5-3fd7-4c43-a490-ba8f4747bd4d/pi-tr....
    1. Williamson E.J., Walker A.J., Bhaskaran K., Bacon S., Bates C., Morton C.E., Curtis H.J., Mehrkar A., Evans D., Inglesby P., et al. Factors associated with COVID-19-related death using OpenSAFELY. Nature. 2020;584:430–436. doi: 10.1038/s41586-020-2521-4. - DOI - PMC - PubMed
    1. Angelidis I., Simon L.M., Fernandez I.E., Strunz M., Mayr C.H., Greiffo F.R., Tsitsiridis G., Ansari M., Graf E., Strom T.M., et al. An atlas of the aging lung mapped by single cell transcriptomics and deep tissue proteomics. Nat. Commun. 2019;10:963. doi: 10.1038/s41467-019-08831-9. - DOI - PMC - PubMed