. 2024 Mar 20;25(6):3514.
doi: 10.3390/ijms25063514.

Multi-Omics Analysis of Gut Microbiota and Host Transcriptomics Reveal Dysregulated Immune Response and Metabolism in Young Adults with Irritable Bowel Syndrome

Affiliations

Multi-Omics Analysis of Gut Microbiota and Host Transcriptomics Reveal Dysregulated Immune Response and Metabolism in Young Adults with Irritable Bowel Syndrome

Jie Chen et al. Int J Mol Sci. .

Abstract

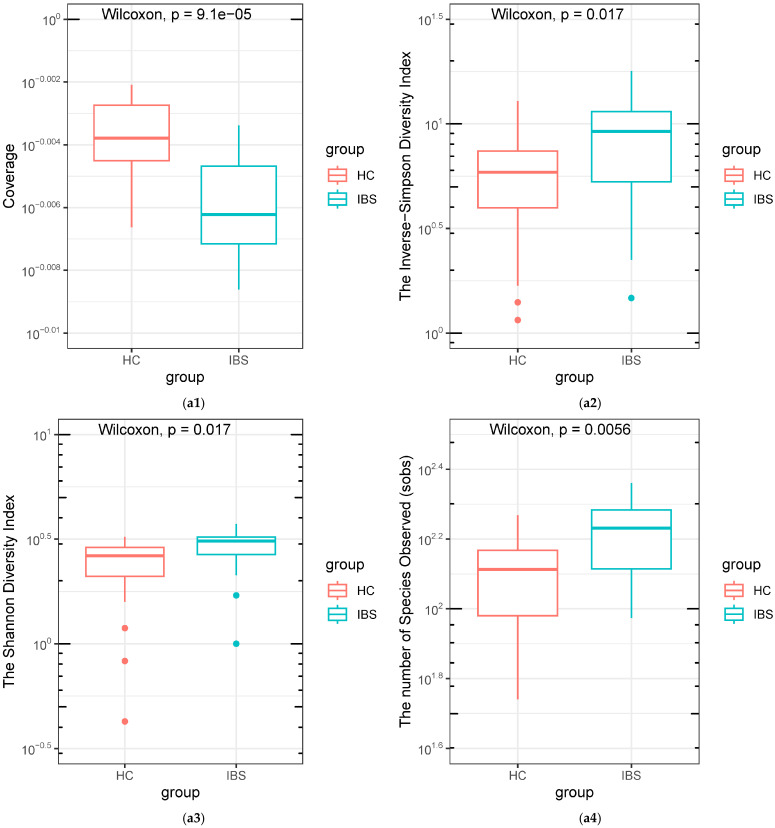
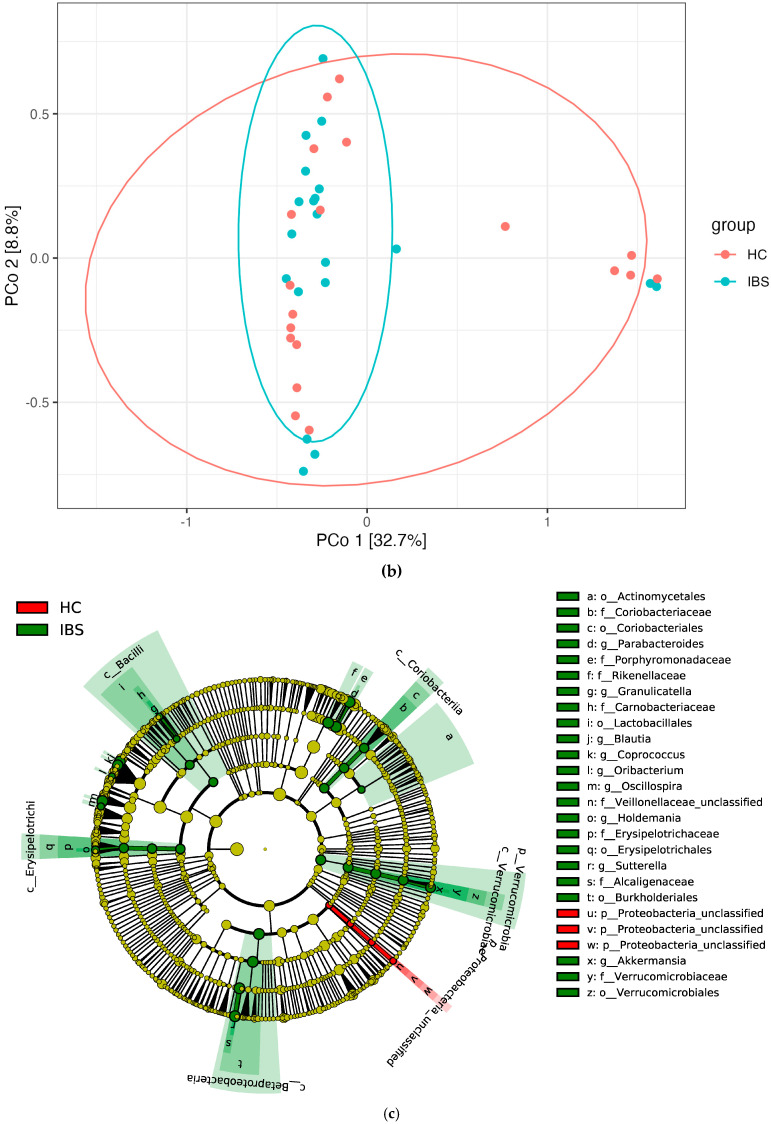
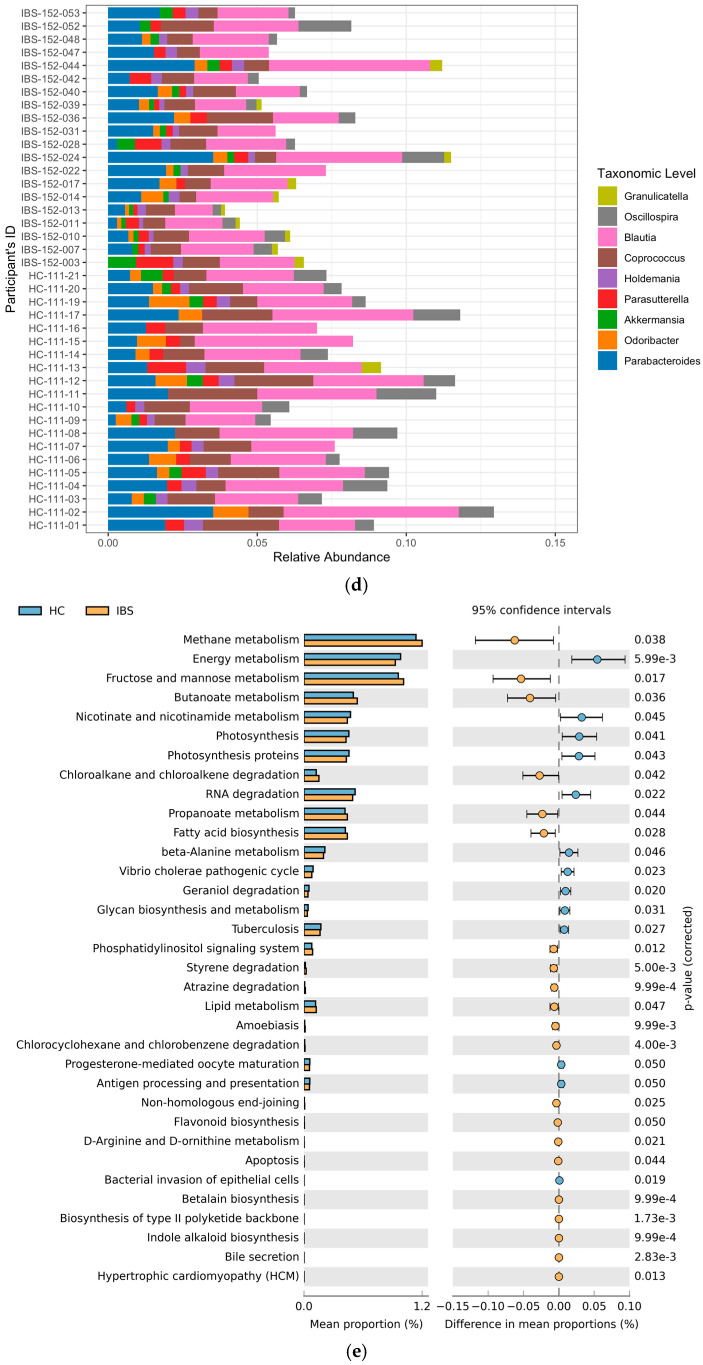
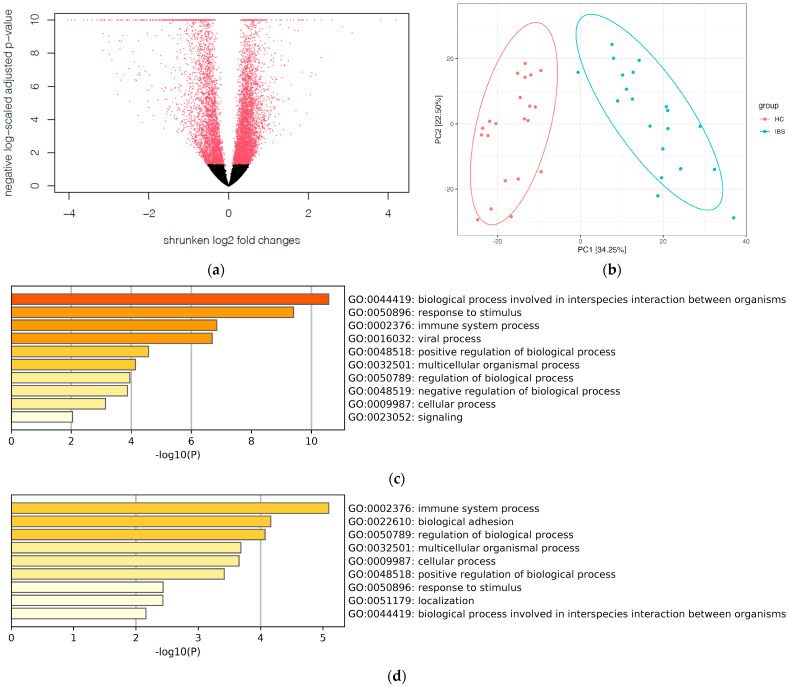
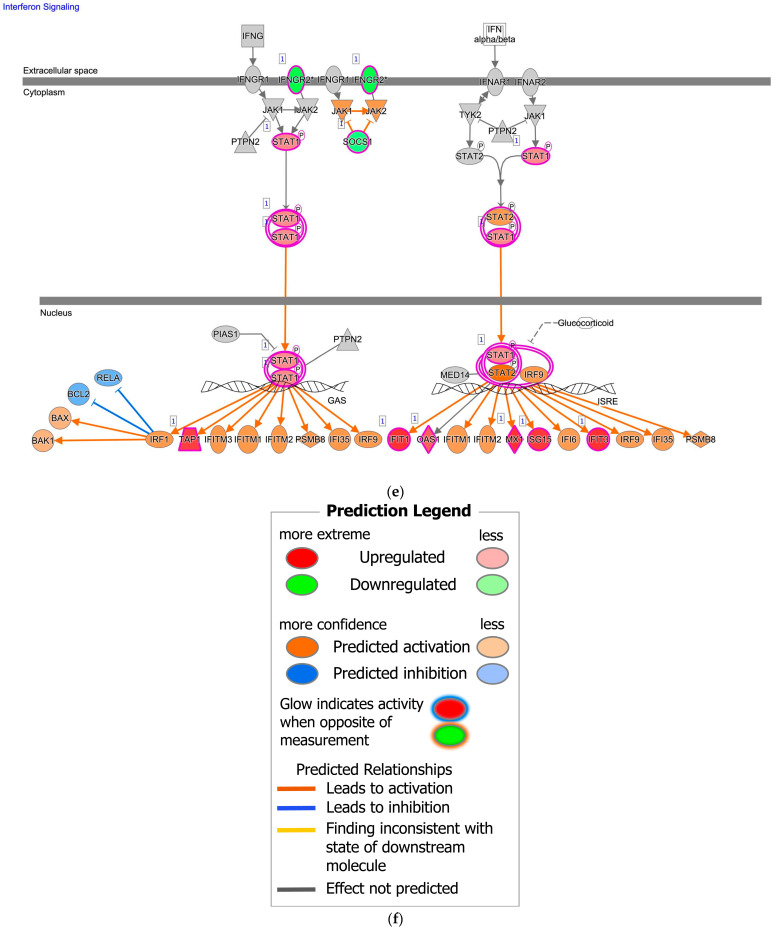
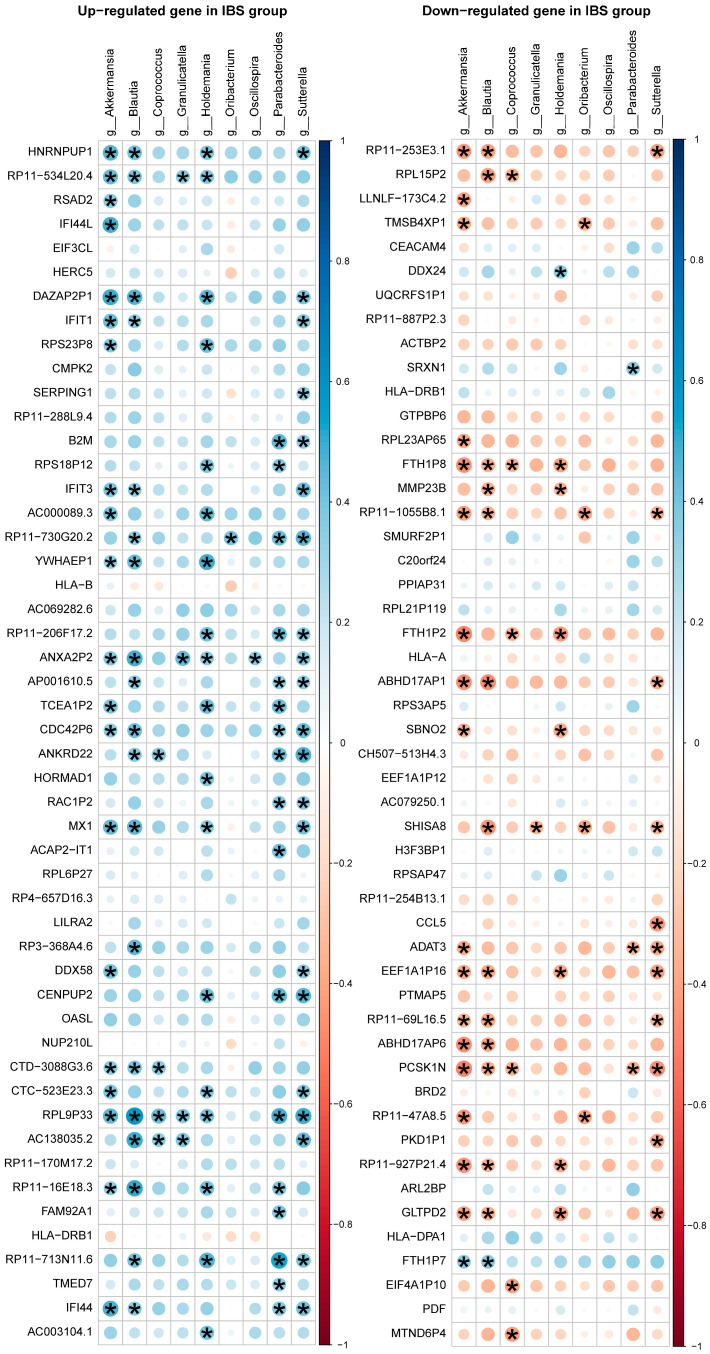
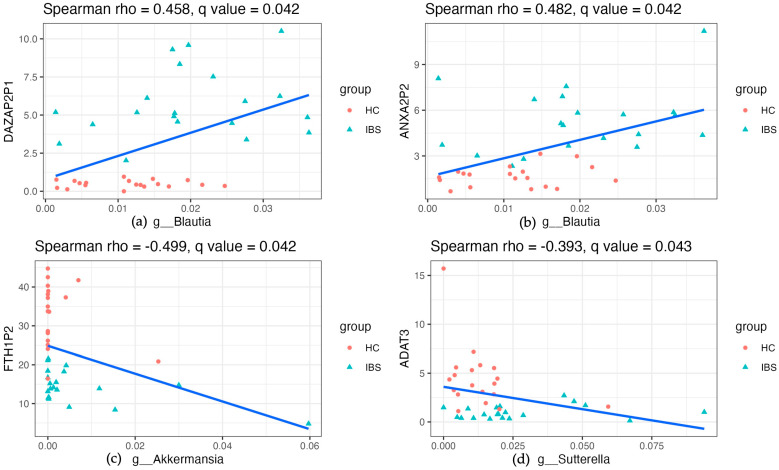
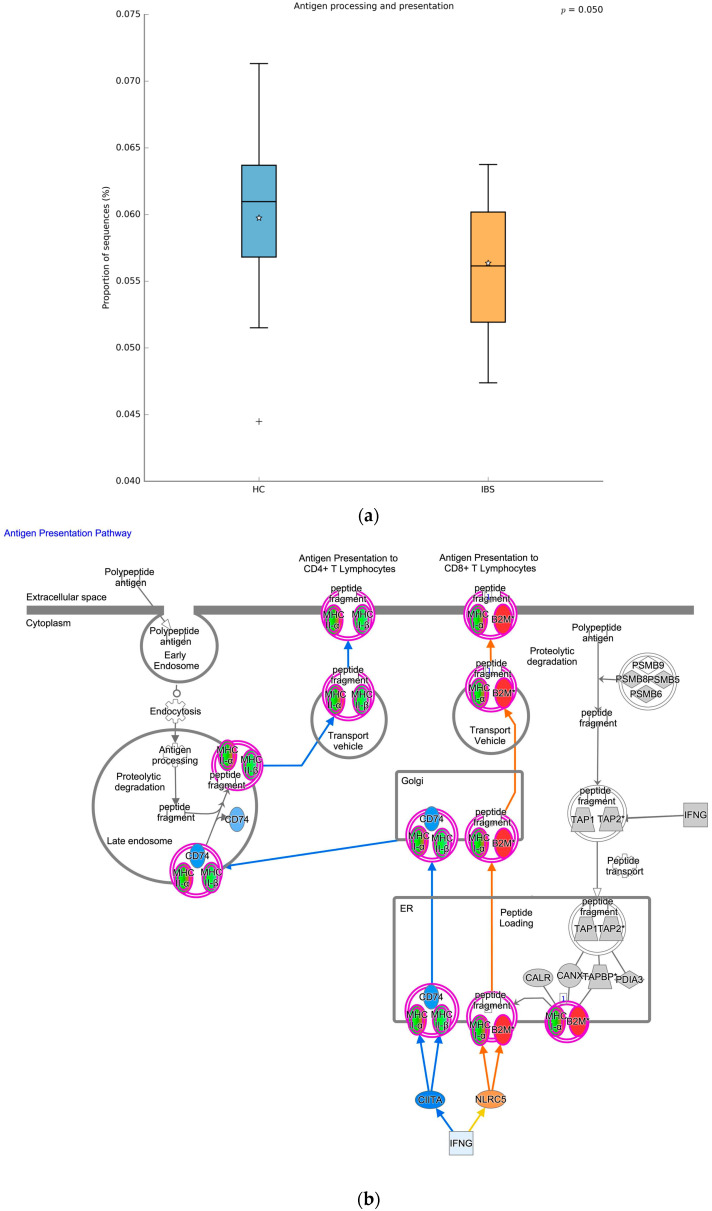
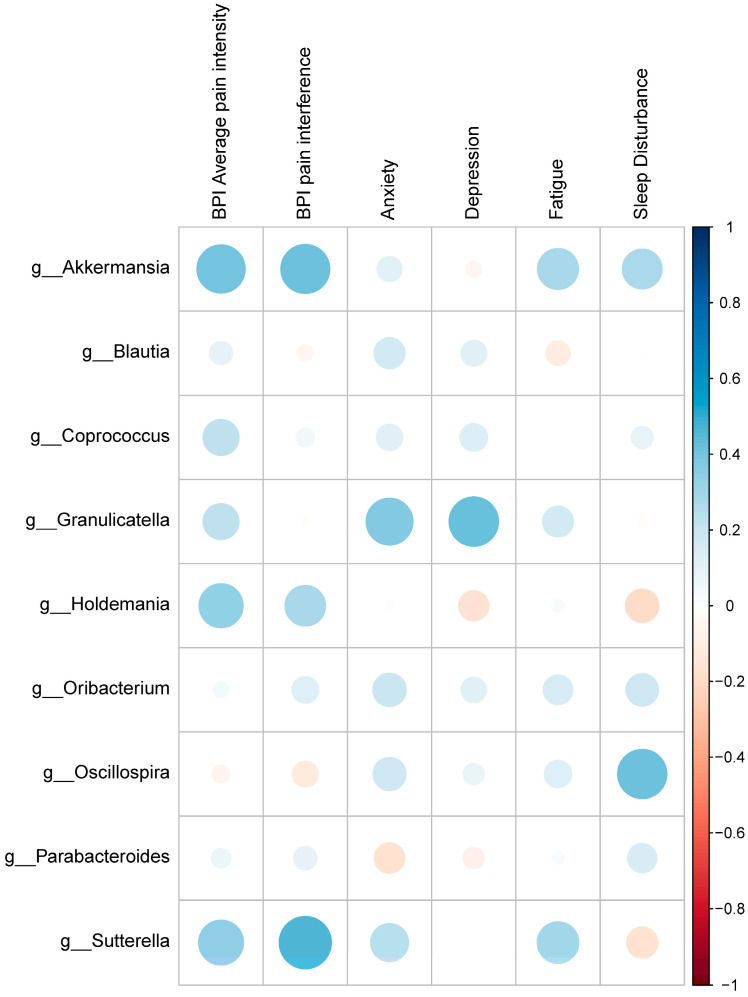
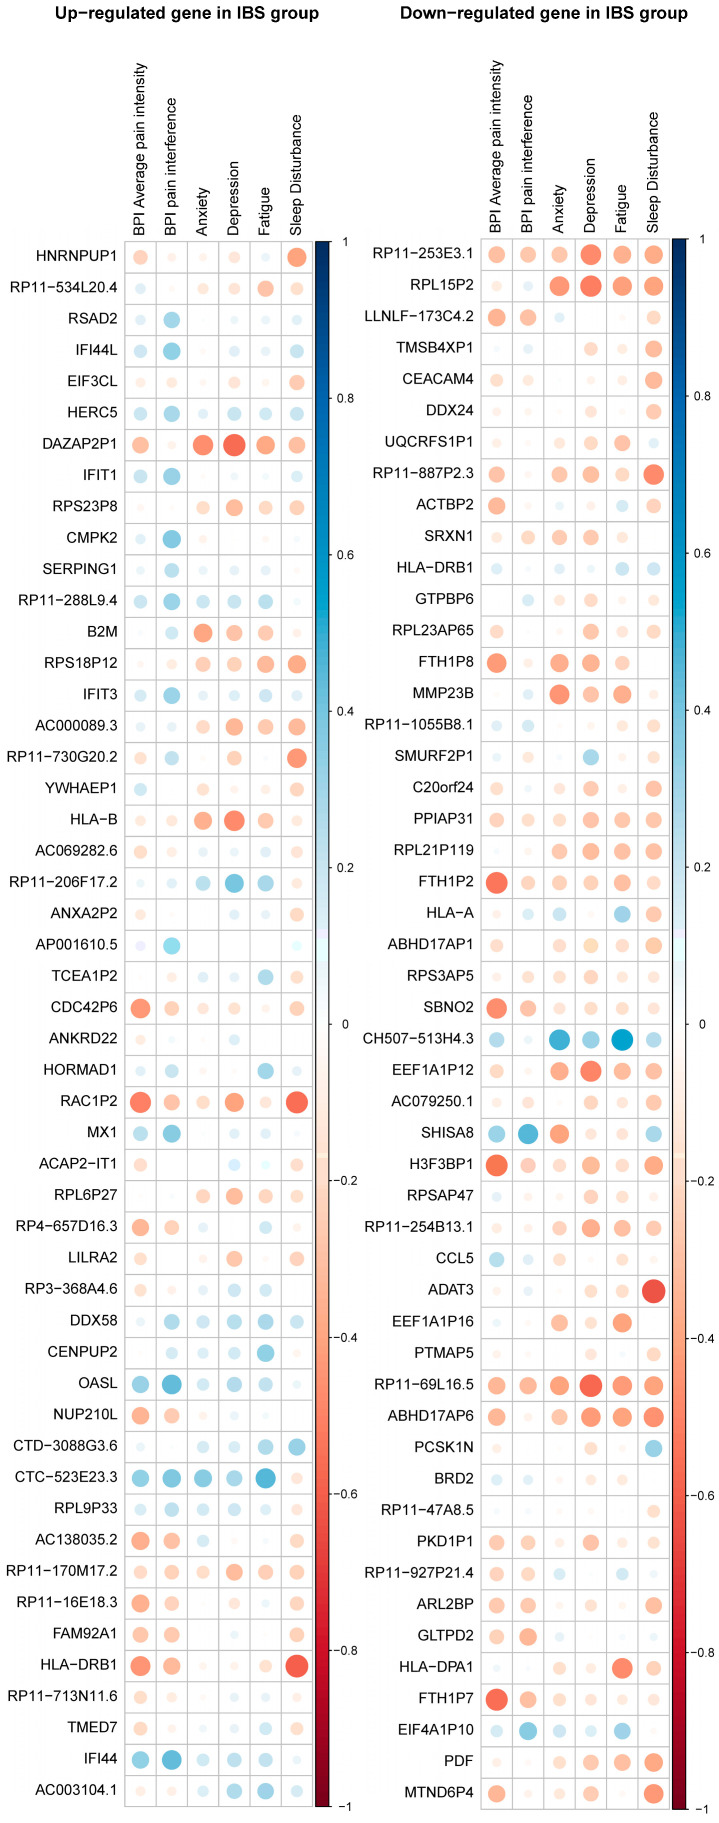
The integrated dysbiosis of gut microbiota and altered host transcriptomics in irritable bowel syndrome (IBS) is yet to be known. This study investigated the associations among gut microbiota and host transcriptomics in young adults with IBS. Stool and peripheral blood samples from 20 IBS subjects and 21 healthy controls (HCs) collected at the baseline visit of an RCT were sequenced to depict the gut microbiota and transcriptomic profiles, respectively. The diversities, composition, and predicted metabolic pathways of gut microbiota significantly differed between IBS subjects and HCs. Nine genera were significantly abundant in IBS stool samples, including Akkermansia, Blautia, Coprococcus, Granulicatella, Holdemania, Oribacterium, Oscillospira, Parabacteroides, and Sutterella. There were 2264 DEGs found between IBS subjects and HCs; 768 were upregulated, and 1496 were downregulated in IBS participants compared with HCs. The enriched gene ontology included the immune system process and immune response. The pathway of antigen processing and presentation (hsa04612) in gut microbiota was also significantly different in the RNA-seq data. Akkermansia, Blautia, Holdemania, and Sutterella were significantly correlated with ANXA2P2 (upregulated, positive correlations), PCSK1N (downregulated, negative correlations), and GLTPD2 (downregulated, negative correlations). This study identified the dysregulated immune response and metabolism in IBS participants revealed by the altered gut microbiota and transcriptomic profiles.

Keywords: gene expression profiling; gut microbiome; immunity; irritable bowel syndrome; metabolic processes; multi-omics.


Conflict of interest statement

The authors declare no conflicts of interest.

Figures

Figure 1
Figure 1
Differentiation of gut microbiota between IBS subjects and HCs. (a1a4). Differentiation of coverage, Invsimpson index, Shannon index, total observed species (sobs) between IBS and HC groups. (b). PCoA plot of the Bray–Curtis dissimilarity index showed that the IBS subjects and HCs were partially overlapped. (c). Compositional difference of gut microbiota between IBS participants and HCs by the LEfSe analysis. The LEfSe results indicate that there are nine genera significantly enriched in IBS, including Parabacteroides, Akkermansia, Blautia, Coprococcus, Granulicatella, Holdemania, Oribacterium, Oscillospira, Parabacteroides, and Sutterella. The alpha value for the factorial Kruskal–Wallis test was set to 0.05 for the pairwise Wilcoxon test, and the threshold on the logarithmic LDA score for discriminative features was set as 2.0. Green indicates significantly enriched features in IBS, red indicates significantly enriched features in HCs. (d). Compositional relative abundance for the IBS and HC subjects plotted on an average basis according to the nine genera. (e). Different metabolic profiles of gut microbiota between IBS subjects and HCs (predicted KEGG pathways).
Figure 1
Figure 1
Differentiation of gut microbiota between IBS subjects and HCs. (a1a4). Differentiation of coverage, Invsimpson index, Shannon index, total observed species (sobs) between IBS and HC groups. (b). PCoA plot of the Bray–Curtis dissimilarity index showed that the IBS subjects and HCs were partially overlapped. (c). Compositional difference of gut microbiota between IBS participants and HCs by the LEfSe analysis. The LEfSe results indicate that there are nine genera significantly enriched in IBS, including Parabacteroides, Akkermansia, Blautia, Coprococcus, Granulicatella, Holdemania, Oribacterium, Oscillospira, Parabacteroides, and Sutterella. The alpha value for the factorial Kruskal–Wallis test was set to 0.05 for the pairwise Wilcoxon test, and the threshold on the logarithmic LDA score for discriminative features was set as 2.0. Green indicates significantly enriched features in IBS, red indicates significantly enriched features in HCs. (d). Compositional relative abundance for the IBS and HC subjects plotted on an average basis according to the nine genera. (e). Different metabolic profiles of gut microbiota between IBS subjects and HCs (predicted KEGG pathways).
Figure 2
Figure 2
Differentiated expressed genes (DEGs) between IBS subjects and HCs. (a). Volcano plot of the DEGs, 2264 DEGs between the IBS subjects and HCs with 768 upregulated and 1496 downregulated in IBS subjects. The black dots indicate genes present in both groups with a difference of log2 fold change (LFC) less than 1.5; The red dots indicate genes present in both groups, but with a difference of LFC equal to or greater than 1.5. (b). Principal component analysis (PCA) plot showed no overlap between IBS participants and HCs. (c). Gene ontology among the top 50 upregulated genes in IBS participants. (d). Gene ontology among the top 50 downregulated genes in IBS subjects. (e). Interferon signaling pathway from DEGs. Gene, Protein, and Chemical identifiers marked with an asterisk indicate multiple identifiers in the dataset file map to a single gene and/or chemical in the Global Molecular Network. (f). IPA Prediction legend to help in the understanding of pathway from DEGs.
Figure 2
Figure 2
Differentiated expressed genes (DEGs) between IBS subjects and HCs. (a). Volcano plot of the DEGs, 2264 DEGs between the IBS subjects and HCs with 768 upregulated and 1496 downregulated in IBS subjects. The black dots indicate genes present in both groups with a difference of log2 fold change (LFC) less than 1.5; The red dots indicate genes present in both groups, but with a difference of LFC equal to or greater than 1.5. (b). Principal component analysis (PCA) plot showed no overlap between IBS participants and HCs. (c). Gene ontology among the top 50 upregulated genes in IBS participants. (d). Gene ontology among the top 50 downregulated genes in IBS subjects. (e). Interferon signaling pathway from DEGs. Gene, Protein, and Chemical identifiers marked with an asterisk indicate multiple identifiers in the dataset file map to a single gene and/or chemical in the Global Molecular Network. (f). IPA Prediction legend to help in the understanding of pathway from DEGs.
Figure 3
Figure 3
Spearman’s correlation coefficient of gut microbiota and expressed genes. In the left column, the correlations between the nine genera (horizontal axis) and the top 50 upregulated DEGs (vertical axis). In the right column, the correlations between the nine genera (horizontal axis) and the top 50 downregulated DEGs (vertical axis). The significant correlations (q-value < 0.05), after multiplicity adjustment by Benjamini-Hochberg method to control the false discovery rate (FDR) at 0.05, were marked with asterisks. Blue indicates a positive correlation, red indicates a negative correlation.
Figure 4
Figure 4
Spearman’s correlation coefficient of the identified genera and genes. The Benjamini–Hochberg method was applied to control the false discovery rate (FDR) at 0.05 for multiple comparisons. (a). The positive associations between Blautia and DAZAP2P1 (rho = 0.458, q = 0.042). (b). The positive associations between Blautia and ANXA2P2 (rho = 0.482, q = 0.042). (c). The negative associations between Akkermansia and FTH1P2 (rho = −0.499, q = 0.042). (d). The negative associations between Sutterella and ADAT3 (rho = −0.393, q = 0.043).
Figure 5
Figure 5
KEGG 04162, antigen processing and presentation in the gut microbiota and DEGs. (a). Gut microbiota from stool samples show the predicted KEGG 04162 is significantly enriched in HCs. “Star” indicated the mean value, “+” indicates an outlier. (b). Gene expression profiling from blood samples show that the KEGG 04162 is significantly enriched in IBS subjects. Gene, Protein, and Chemical identifiers marked with an asterisk indicate multiple identifiers in the dataset file map to a single gene and/or chemical in the Global Molecular Network.
Figure 6
Figure 6
Spearman’s correlation coefficient of the self-reported pain and symptoms and the identified genera. Horizontal axis, self-reported pain and symptoms; and vertical axis, the nine genera significantly enriched in IBS, including Parabacteroides, Akkermansia, Blautia, Coprococcus, Granulicatella, Holdemania, Oribacterium, Oscillospira, Parabacteroides, Sutterella. Blue indicates a positive correlation, red indicates a negative correlation. No significant correlations emerged between the enriched 9 genera and self-reported pain and symptoms, after multiplicity adjustment by Benjamini-Hochberg method to control the false discovery rate (FDR) at 0.05.
Figure 7
Figure 7
Spearman’s correlation coefficient of the top 50 upregulated and downregulated DEGs and self-reported pain and symptoms. In the left column, the correlations between self-reported pain and symptoms (horizontal axis) and the top 50 upregulated DEGs (vertical axis). In the right column, the correlations between self-reported pain and symptoms (horizontal axis) and the top 50 downregulated DEGs (vertical axis). Blue indicates a positive correlation, red indicates a negative correlation. No significant correlations emerged between the top 50 up- and downregulated DEGs and self-reported pain and symptoms, after multiplicity adjustment by Benjamini-Hochberg method to control the false discovery rate (FDR) at 0.05.

Similar articles

Cited by

References

    1. Enck P., Aziz Q., Barbara G., Farmer A.D., Fukudo S., Mayer E.A., Niesler B., Quigley E.M.M., Rajilić-Stojanović M., Schemann M., et al. Irritable Bowel Syndrome. Nat. Rev. Dis. Prim. 2016;2:16014. doi: 10.1038/nrdp.2016.14. - DOI - PMC - PubMed
    1. Ford A.C., Sperber A.D., Corsetti M., Camilleri M. Irritable Bowel Syndrome. Lancet. 2020;396:1675–1688. doi: 10.1016/S0140-6736(20)31548-8. - DOI - PubMed
    1. Chey W.D., Kurlander J., Eswaran S. Irritable Bowel Syndrome: A Clinical Review. JAMA. 2015;313:949–958. doi: 10.1001/jama.2015.0954. - DOI - PubMed
    1. Bhattarai Y., Muniz Pedrogo D.A., Kashyap P.C. Irritable Bowel Syndrome: A Gut Microbiota-Related Disorder? Am. J. Physiol. Gastrointest. Liver Physiol. 2017;312:G52–G62. doi: 10.1152/ajpgi.00338.2016. - DOI - PMC - PubMed
    1. Pittayanon R., Lau J.T., Yuan Y., Leontiadis G.I., Tse F., Surette M., Moayyedi P. Gut Microbiota in Patients with Irritable Bowel Syndrome—A Systematic Review. Gastroenterology. 2019;157:97–108. doi: 10.1053/j.gastro.2019.03.049. - DOI - PubMed

LinkOut - more resources