

Effects of Mindful Eating in Patients with Obesity and Binge Eating Disorder
- PMID: 38542795
- PMCID: PMC10975968
- DOI: 10.3390/nu16060884
Effects of Mindful Eating in Patients with Obesity and Binge Eating Disorder
Abstract
Introduction: Binge eating disorder (BED) is a psychiatric illness related to a high frequency of episodes of binge eating, loss of control, body image dissatisfaction, and suffering caused by overeating. It is estimated that 30% of patients with BED are affected by obesity. "Mindful eating" (ME) is a promising new eating technique that can improve self-control and good food choices, helping to increase awareness about the triggers of binge eating episodes and intuitive eating training.
Objectives: To analyze the impact of ME on episodes of binge eating, body image dissatisfaction, quality of life, eating habits, and anthropometric data [weight, Body Mass Index (BMI), and waist circumference] in patients with obesity and BED.
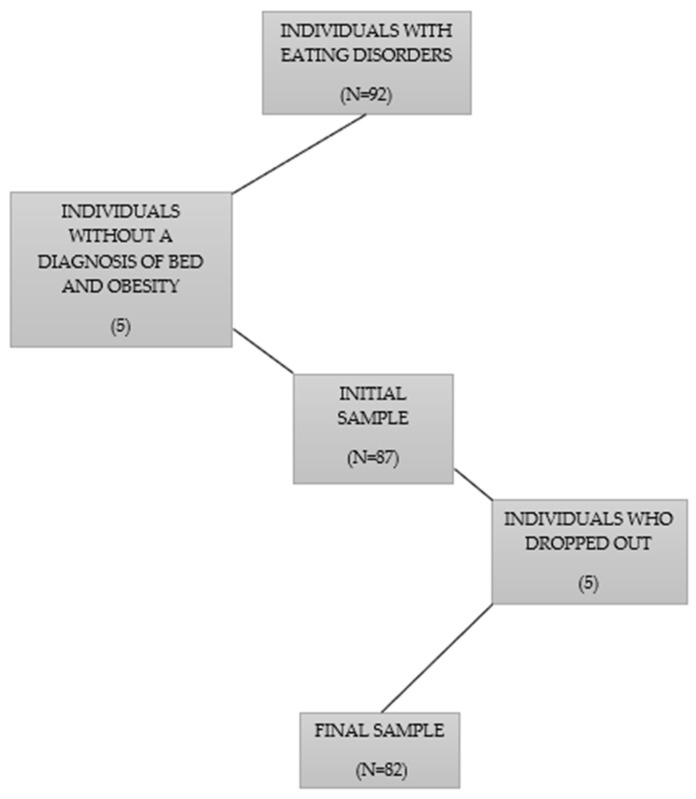
Method: This quantitative, prospective, longitudinal, and experimental study recruited 82 patients diagnosed with obesity and BED. The intervention was divided into eight individual weekly meetings, guided by ME sessions, nutritional educational dynamics, cooking workshops, food sensory analyses, and applications of questionnaires [Body Shape Questionnaire (BSQ); Binge Eating Scale (BES); Quality of Life Scale (WHOQOL-BREF)]. There was no dietary prescription for calories, carbohydrates, proteins, fats, and fiber. Patients were only encouraged to consume fewer ultra-processed foods and more natural and minimally processed foods. The meetings occurred from October to November 2023.
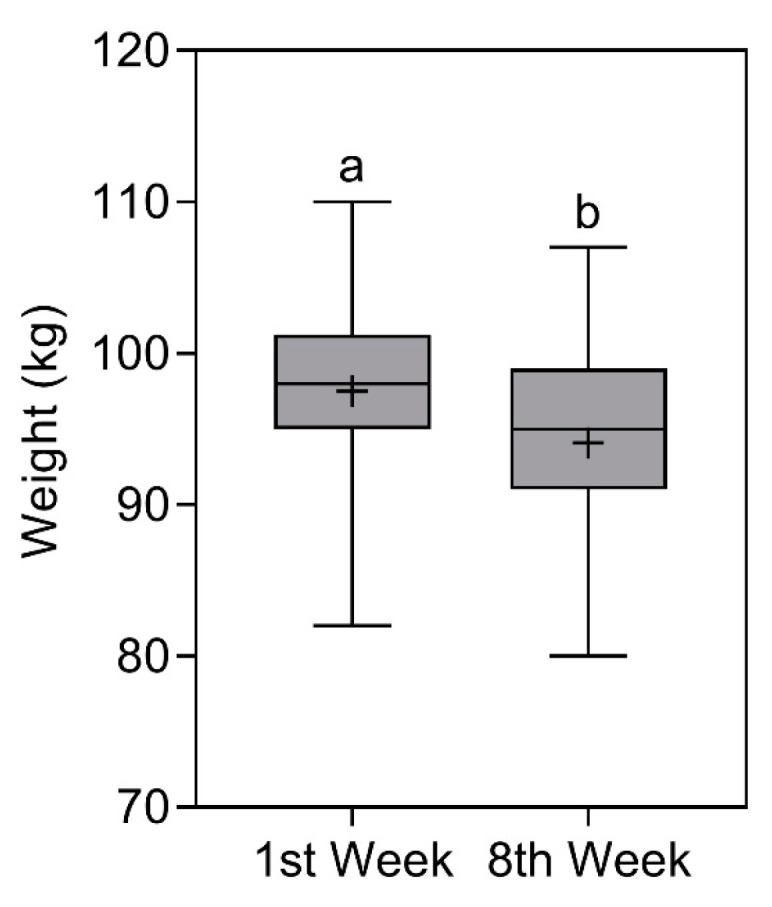
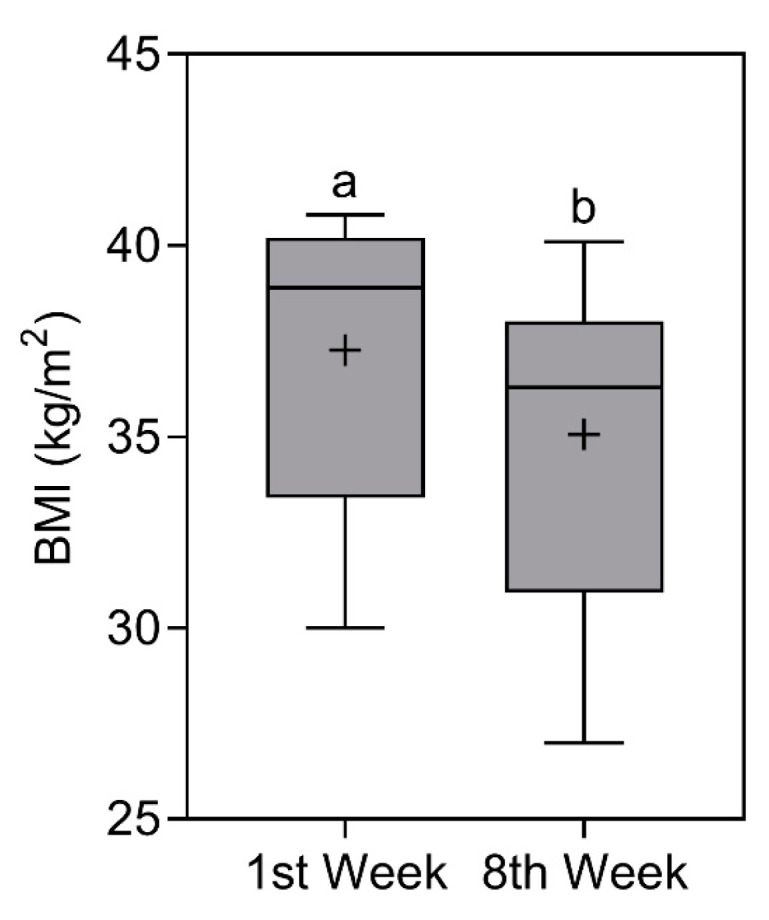
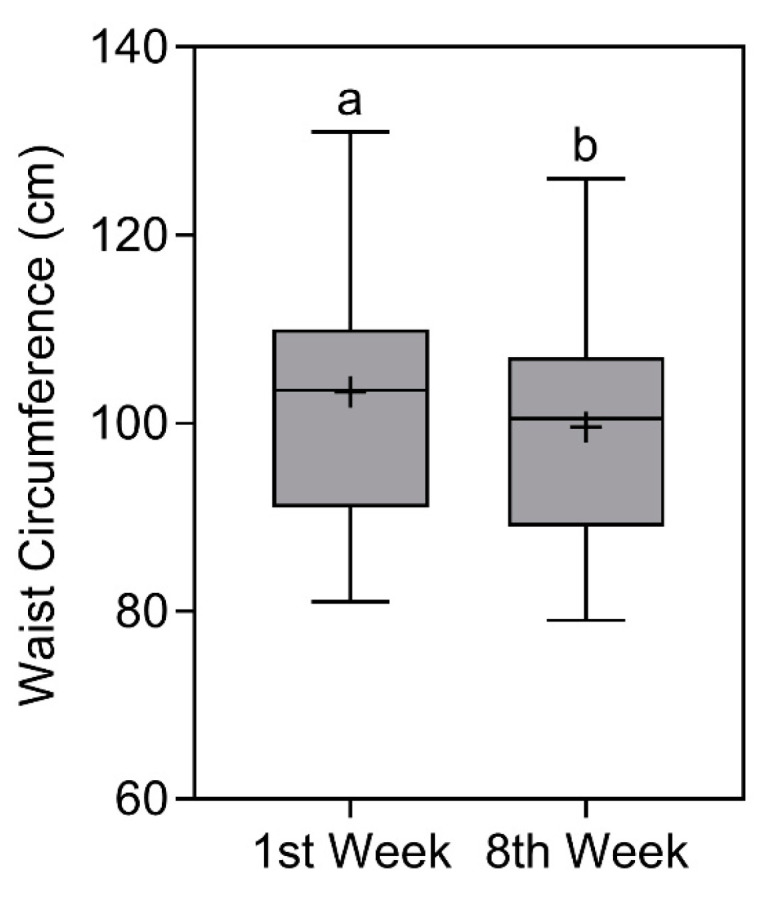
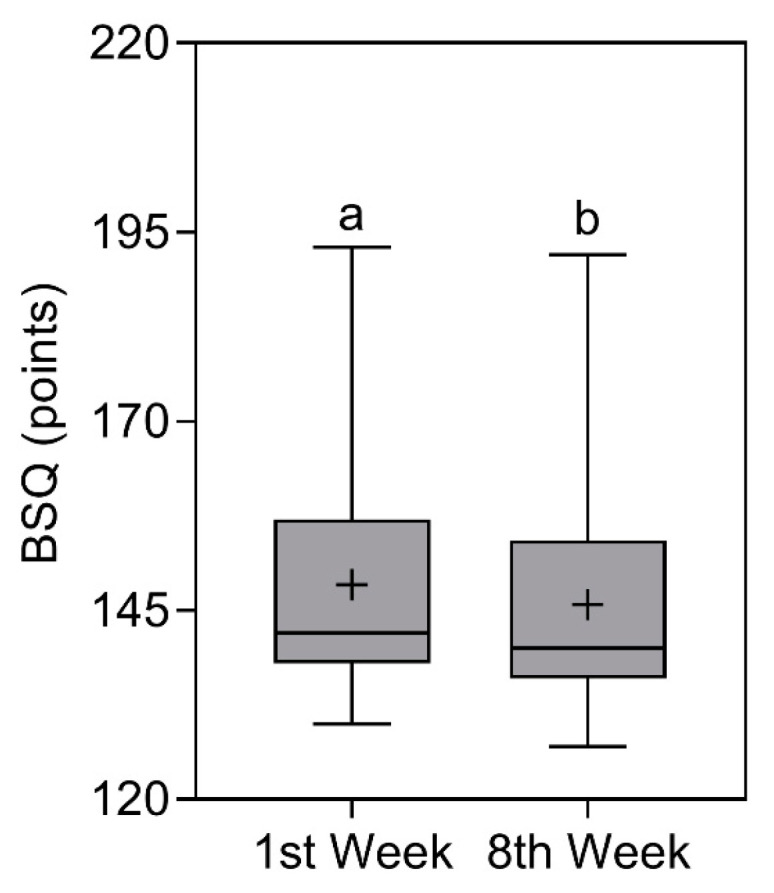
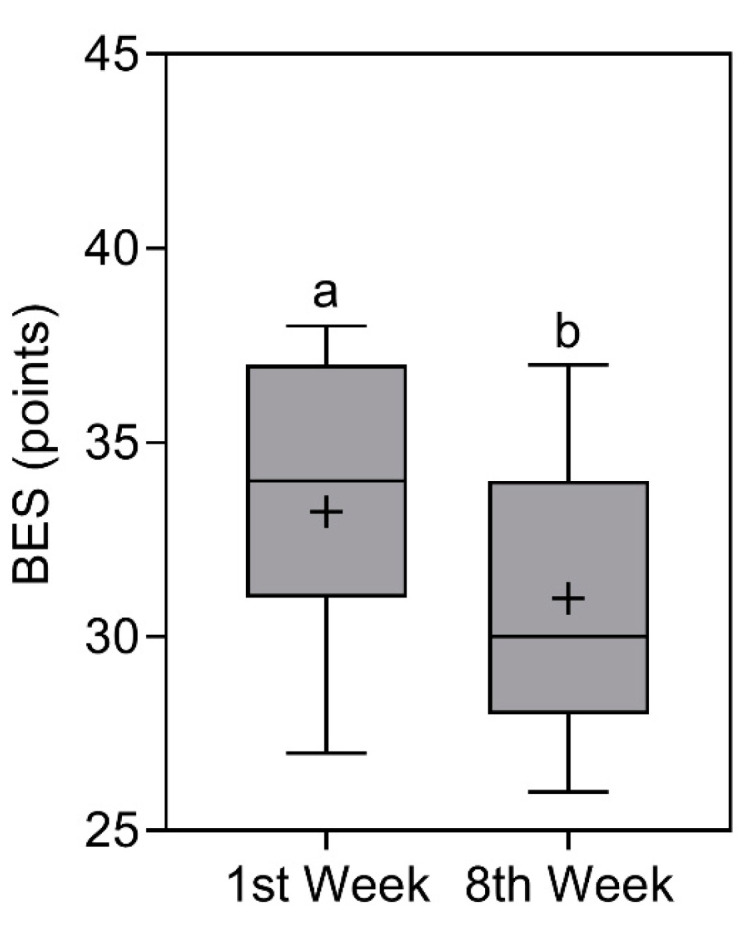
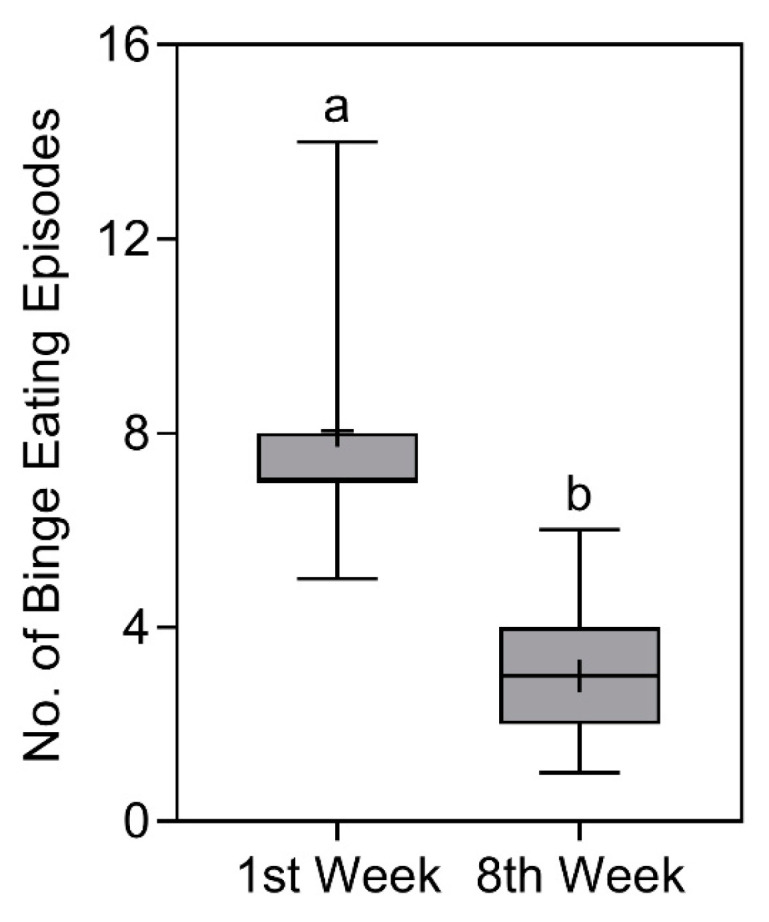
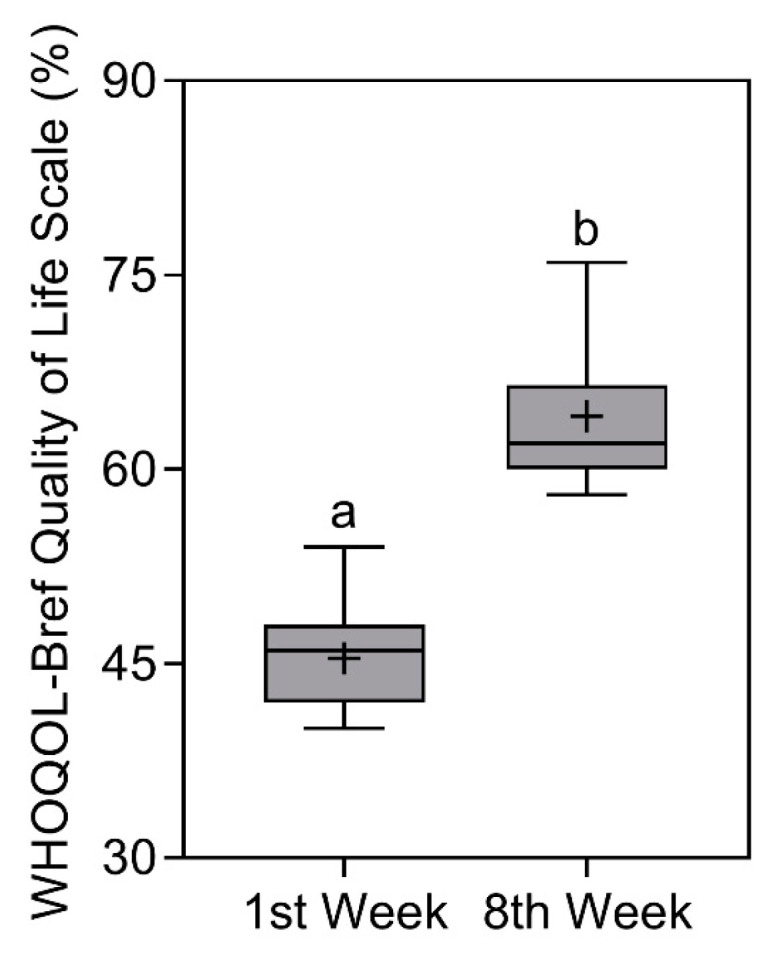
Statistical analysis: To carry out inferential statistics, the Shapiro-Wilk test was used to verify the normality of variable distribution. All variables were identified as non-normal distribution and were compared between the first and the eighth week using a two-tailed Wilcoxon test. Non-Gaussian data were represented by median ± interquartile range (IQR). Additionally, α < 0.05 and p < 0.05 were adopted.
Results: Significant reductions were found from the first to the eighth week for weight, BMI, waist circumference, episodes of binge eating, BSQ scale score, BES score, and total energy value (all p < 0.0001). In contrast, there was a significant increase in the WHOQOL-BREF score and daily water intake (p < 0.0001).
Conclusions: ME improved anthropometric data, episodes of binge eating, body image dissatisfaction, eating habits, and quality of life in participants with obesity and BED in the short-term. However, an extension of the project will be necessary to analyze the impact of the intervention in the long-term.
Keywords: binge eating disorder; eating disorders; mindful eating; nutritional intervention; obesity.
Conflict of interest statement
The authors declare no conflicts of interest.
Figures
References
-
- Arlington V.A. American Psychiatric Association: Diagnostic and Statistical Manual of Mental Disorders. 5th ed. American Psychiatric Association; Washington, DC, USA: 2013. (DSM-5)
-
- NCD Risk Factor Collaboration (NCD-RisC) Worldwide trends in underweight and obesity from 1990 to 2022: A pooled analysis of 3663 population-representative studies with 222 million children, adolescents, and adults. Lancet. 2024;403:1027–1050. doi: 10.1016/S0140-6736(23)02750-2. - DOI - PMC - PubMed
-
- Morillo-Sarto H., López-Del-Hoyo Y., Pérez-Aranda A., Modrego-Alarcón M., Barceló-Soler A., Borao L., Puebla-Guedea M., Demarzo M., García-Campayo J., Montero-Marin J. ‘Mindful eating’ for reducing emotional eating in patients with overweight or obesity in primary care settings: A randomized controlled trial. Eur. Eat. Disord. Rev. 2022;31:303–319. doi: 10.1002/erv.2958. - DOI - PMC - PubMed
MeSH terms
Substances
Grants and funding
LinkOut - more resources
Full Text Sources
