. 2024 Mar 9;17(3):355.
doi: 10.3390/ph17030355.

The Effects of Selected Extraction Methods and Natural Deep Eutectic Solvents on the Recovery of Active Principles from Aralia elata var. mandshurica (Rupr. & Maxim.) J. Wen: A Non-Targeted Metabolomics Approach

Affiliations

The Effects of Selected Extraction Methods and Natural Deep Eutectic Solvents on the Recovery of Active Principles from Aralia elata var. mandshurica (Rupr. & Maxim.) J. Wen: A Non-Targeted Metabolomics Approach

Alyona Kaleta et al. Pharmaceuticals (Basel). .

Abstract

The methods and solvents employed in routine extraction protocols essentially impact the composition of the resulting extracts, i.e., the relative abundances of individual biologically active metabolites and the quality and stability of the isolates. Natural deep eutectic solvents (NADESs) represent a new class of environmentally friendly solvents, which are recognized as promising extractants alternative to conventional organic liquids. However, their relative efficiencies when applied in different extraction workflows are still poorly characterized. Therefore, here, we compare the potential of three extraction methods for the extraction of biologically active natural products from Aralia elata var. mandshurica with selected natural deep eutectic solvents (NADESs) using a non-targeted metabolomics approach. The non-targeted metabolite profiling relied on reversed-phase ultra-high-performance liquid chromatography-high-resolution mass spectrometry (RP-UHPLC-HR-MS). The roots of A. elata were extracted by maceration, ultrasound-assisted extraction (UAE), and vibrocavitation-assisted extraction (VAE). Principal component analysis (PCA) revealed a clear separation of the extracts obtained with the three extraction methods employed with NADES1 (choline chloride/malic acid) and NADES2 (sorbitol/malic acid/water). Based on the results of the hierarchical clustering analysis obtained for the normalized relative abundances of individual metabolites and further statistical evaluation with the t-test, it could be concluded that NADES1 showed superior extraction efficiency for all the protocols addressed. Therefore, this NADES was selected to compare the efficiencies of the three extraction methods in more detail. PCA followed by the t-test yielded only 3 metabolites that were more efficiently extracted by maceration, whereas 46 compounds were more abundant in the extracts obtained by VAE. When VAE and UAE were compared, 108 metabolites appeared to be more abundant in the extracts obtained by VAE, whereas only 1 metabolite was more efficiently recovered by UAE. These facts clearly indicate the advantage of the VAE method over maceration and UAE. Seven of the twenty-seven metabolites tentatively identified by tandem mass spectrometry (MS/MS) were found in the roots of A. elata for the first time. Additional studies are necessary to understand the applicability of VAE for the extraction of other plant materials.

Keywords: Aralia elata; NADES; extraction; natural deep eutectic solvents; non-targeted metabolics profiling; ultrasound-assisted extraction; vibrocavitation-assisted extraction.


Conflict of interest statement

The authors declare no conflicts of interest.

Figures

Figure 1
Figure 1
The results of the principal component analysis (PCA) with the score plots illustrating the comparisons of three different extraction methods (maceration, UAE, and VAE) in terms of their efficiencies observed with NADES1 (choline chloride/malic acid) (A) and NADES2 (sorbitol/malic acid (B).
Figure 2
Figure 2
Comparison of the secondary metabolite profiles of the Aralia elata roots extracted using the maceration method with NADES1 and NADES2: results of the principal component analysis (PCA) with a score plot (A), hierarchical clustering analysis with a heatmap representation (B), and volcano plot with a graphical representation of differentially abundant analytes (C) with Benjamini–Hochberg false discovery rate (FDR) correction at p ≤ 0.05 and fold change (FC) ≥ 2. Color dots indicate metabolites showing statistically significant differences with FC ≥ 2 threshold level at p ≤ 0.05 compared to the controls. Thereby, the blue dots indicate metabolites (with the corresponding feature numbers) with increased contents in the extracts obtained with NADES2; the red dots indicate metabolites (with the corresponding feature numbers) with increased contents in the extracts obtained with NADES1. Metabolites indicated by gray dots showed no statistically significant differences.
Figure 3
Figure 3
Comparison of the secondary metabolite profiles of the Aralia elata roots extracted by UAE with NADES1 and NADES2: results of the principal component analysis (PCA) with a score plot (A), hierarchical clustering analysis with a heatmap representation (B), and volcano plot with a graphical representation of differentially abundant analytes (C) with Benjamini–Hochberg false discovery rate (FDR) correction at p ≤ 0.05 and fold change (FC) ≥ 2. Color dots indicate the metabolites showing statistically significant differences with FC ≥ 2 threshold level at p ≤ 0.05 compared to the controls. Thereby, the blue dots indicate metabolites (with the corresponding feature numbers) with increased contents in the extracts obtained with NADES2; the red dots indicate the metabolites (with the corresponding feature numbers) with increased contents in the extracts obtained with NADES1. The metabolites marked with gray dots showed no statistically significant differences.
Figure 4
Figure 4
Comparison of the secondary metabolite profiles of the Aralia elata roots extracted using the VAE method with NADES1 and NADES2: the results of the principal component analysis (PCA) with a score plot (A), hierarchical clustering analysis with a heatmap representation (B), and volcano plot with a graphical representation of differentially abundant analytes (C) with Benjamini–Hochberg false discovery rate (FDR) correction at p ≤ 0.05 and fold change (FC) ≥ 2. Colored dots indicate the metabolites showing statistically significant differences with an FC ≥ 2 threshold at p ≤ 0.05 in comparison to the controls. Thereby, the blue dots indicate metabolites (with the corresponding feature numbers) with increased contents in the extracts obtained with NADES2, whereas the red dots indicate metabolites (with the corresponding feature numbers) with increased contents in the extracts obtained with NADES1. Metabolites marked with gray dots showed no statistically significant differences.
Figure 5
Figure 5
Comparison of the secondary metabolite profiles of the Aralia elata roots extracted with the VAE and maceration methods using NADES1: the results of the principal component analysis (PCA) with a score plot (A), hierarchical clustering analysis with a heatmap representation (B), and volcano plot with a graphical representation of differentially abundant analytes (C) with Benjamini–Hochberg false discovery rate (FDR) correction at p ≤ 0.05 and fold change (FC) ≥ 10. Colored dots indicate metabolites showing statistically significant differences with an FC ≥ 2 threshold at p ≤ 0.05 in comparison to the controls. Thereby, the blue dots indicate metabolites (with the corresponding feature numbers) with increased contents in the extracts obtained by maceration; the red dots indicate metabolites (with the corresponding feature numbers) with increased contents in the extracts obtained by VAE. Metabolites marked with gray dots showed no statistically significant differences.
Figure 6
Figure 6
Comparison of the secondary metabolite profiles of the Aralia elata roots extracted with VAE and UAE methods using NADES1: the results of the principal component analysis (PCA) with a score plot (A), hierarchical clustering analysis with a heatmap representation (B), and volcano plot with a graphical representation of differentially abundant analytes (C) with Benjamini–Hochberg false discovery rate (FDR) correction at p ≤ 0.05 and fold change (FC) ≥ 10. Colored dots indicate the metabolites (with the corresponding feature numbers) showing statistically significant differences with an FC ≥ 2 threshold at p ≤ 0.05 in comparison to the controls. Thereby, the blue dots indicate the metabolites (with the corresponding feature numbers) with increased contents in the extracts obtained by UAE, whereas the red dots indicate metabolites with increased contents in the extracts obtained by VAE. The metabolites marked with gray dots showed no statistically significant differences.
Figure 7
Figure 7
Relative total abundances (assessed as the MS-signal intensities) of aralosides A, B, and C in the extracts obtained by maceration, ultrasound (UAE), and vibrocavitation (VAE). For this, the compound-specific extracted ion chromatograms (XICs) were generated at m/z 925.4796, m/z 1057.5255, and m/z 1087.5308 for aralosides A, B, and C, respectively, and the characteristic chromatographic peaks were integrated at the tRs values of 10.6, 10.6, and 10.3, respectively.
Figure 8
Figure 8
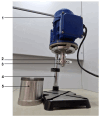
The design of the vibrocavitator: electric motor (1); stator (2); rotor (3); holder (4); extraction cup (5); stator holes (a and b).

References

    1. Choi Y.H., Spronsen J.V., Dai Y., Verberne M., Hollmann F., Arends I.W.C.E., Witkamp G.J., Verpoorte R. Are Natural Deep Eutectic Solvents the Missing Link in Understanding Cellular Metabolism and Physiology? Plant Physiol. 2011;156:1701–1705. doi: 10.1104/pp.111.178426. - DOI - PMC - PubMed
    1. Dai Y., Van Spronsen J., Witkamp G.-J., Verpoorte R., Choi Y.H. Natural Deep Eutectic Solvents as New Potential Media for Green Technology. Anal. Chim. Acta. 2013;766:61–68. doi: 10.1016/j.aca.2012.12.019. - DOI - PubMed
    1. Fuad F.M., Nadzir M.M., Harun A. Hydrophilic natural deep eutectic solvent: A review on physicochemical properties and extractability of bioactive compounds. J. Mol. Liq. 2021;339:116923. doi: 10.1016/j.molliq.2021.116923. - DOI
    1. Da Silva R.F., Carneiro C.N., Cheila C.B., de Sousa C.B.D.C., Gomez F.J.V., Espino M., Boiteux J., Fernández M.D.L.Á., Silva M.F., Dias F.D.S. Sustainable extraction bioactive compounds procedures in medicinal plants based on the principles of green analytical chemistry: A review. Microchem. J. 2022;175:107184. doi: 10.1016/j.microc.2022.107184. - DOI
    1. Wawoczny A., Gillner D. The Most Potent Natural Pharmaceuticals, Cosmetics, and Food Ingredients Isolated from Plants with Deep Eutectic Solvents. J. Agric. Food Chem. 2023;71:10877–10900. doi: 10.1021/acs.jafc.3c01656. - DOI - PMC - PubMed

LinkOut - more resources