. 2024 Feb 24;12(3):236.
doi: 10.3390/vaccines12030236.

High-Content Imaging-Based Assay for SARS-CoV-2-Neutralizing Antibodies

Affiliations

High-Content Imaging-Based Assay for SARS-CoV-2-Neutralizing Antibodies

Vinícius Pinto Costa Rocha et al. Vaccines (Basel). .

Abstract

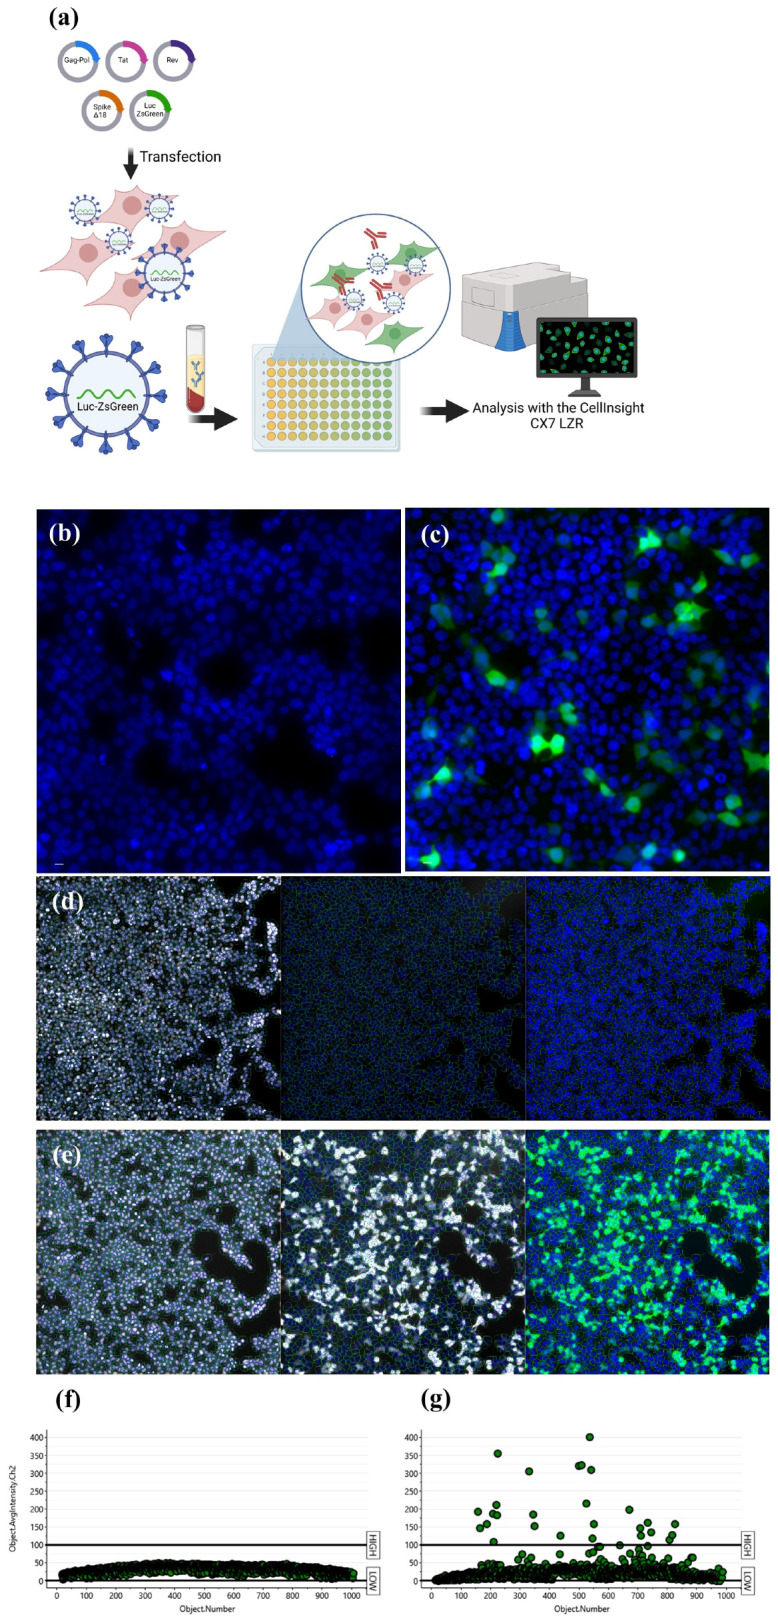
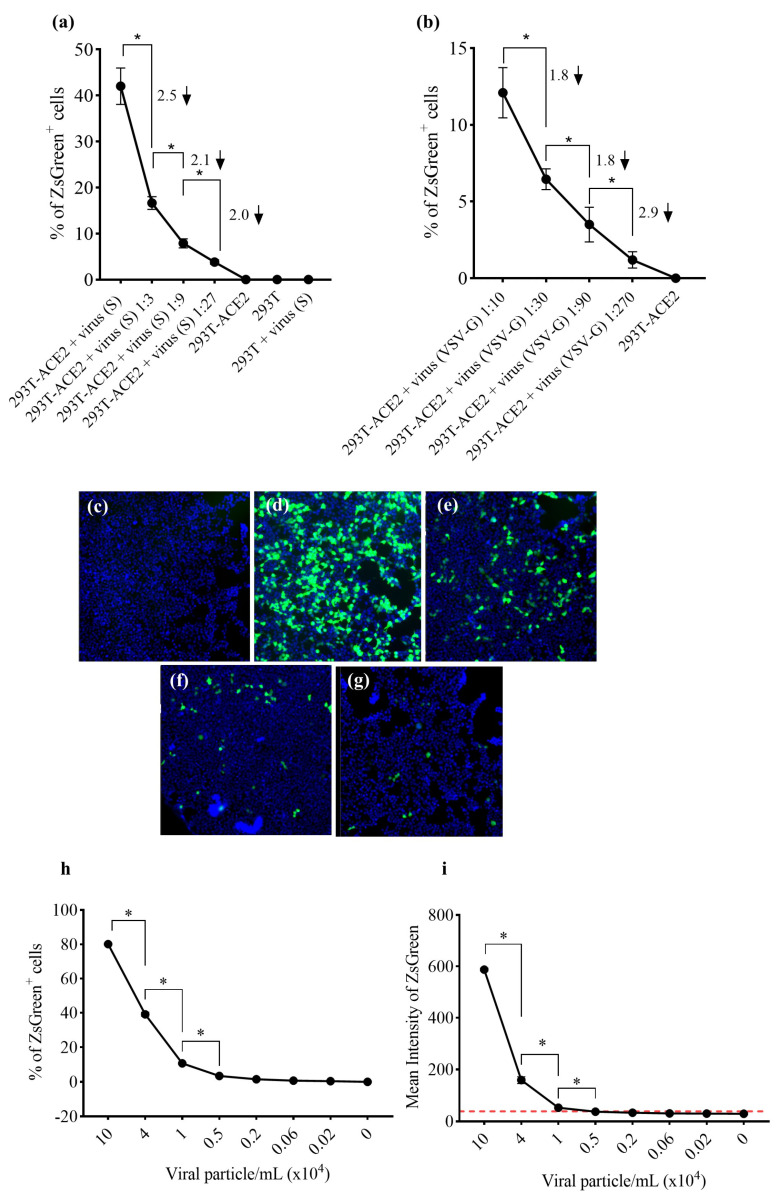
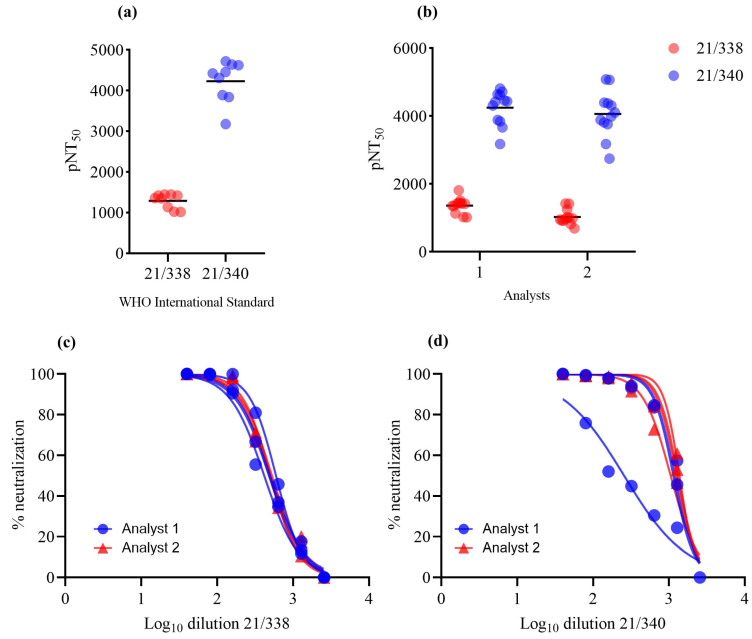
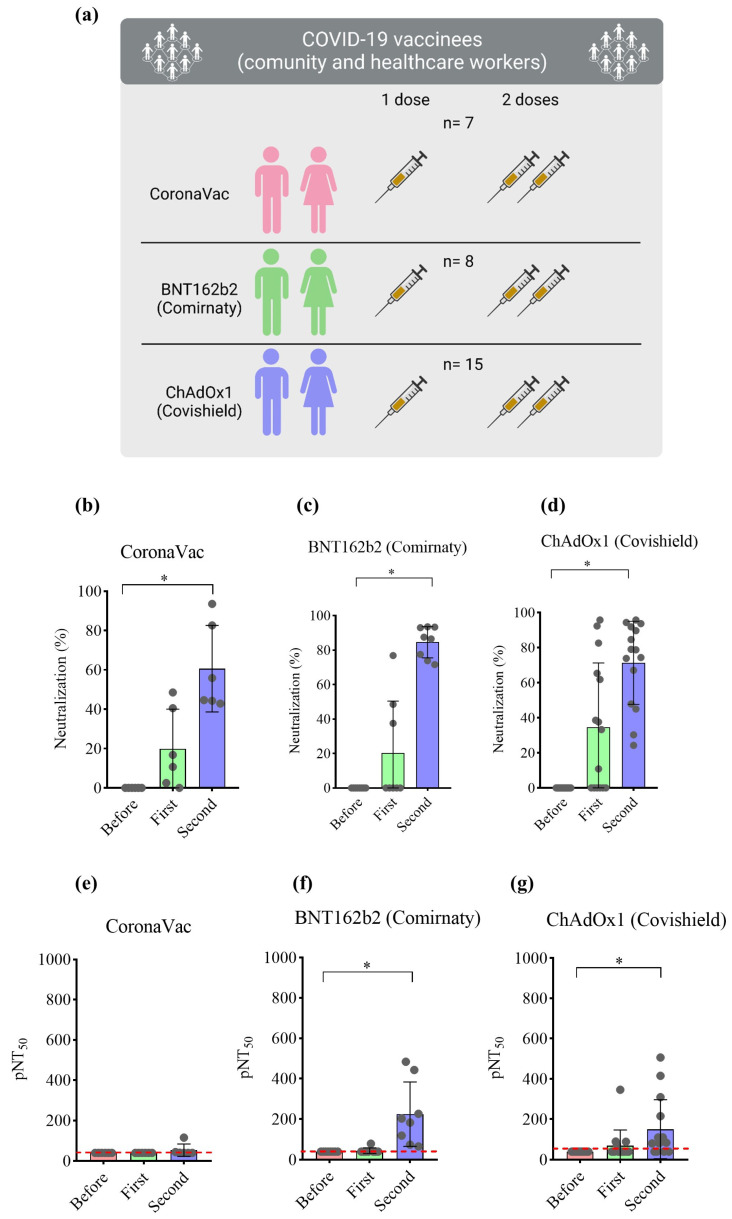
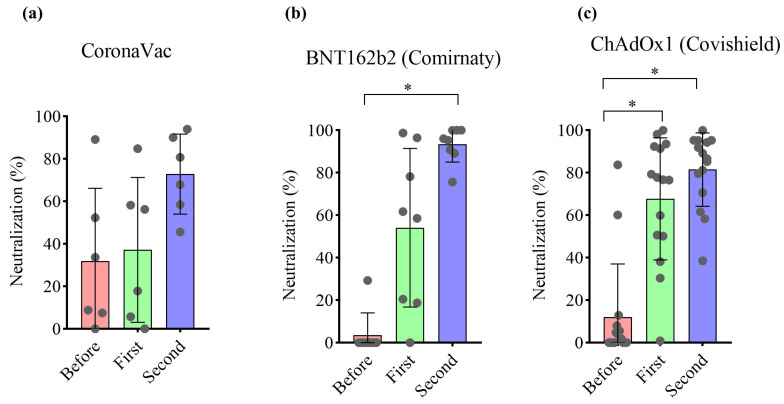
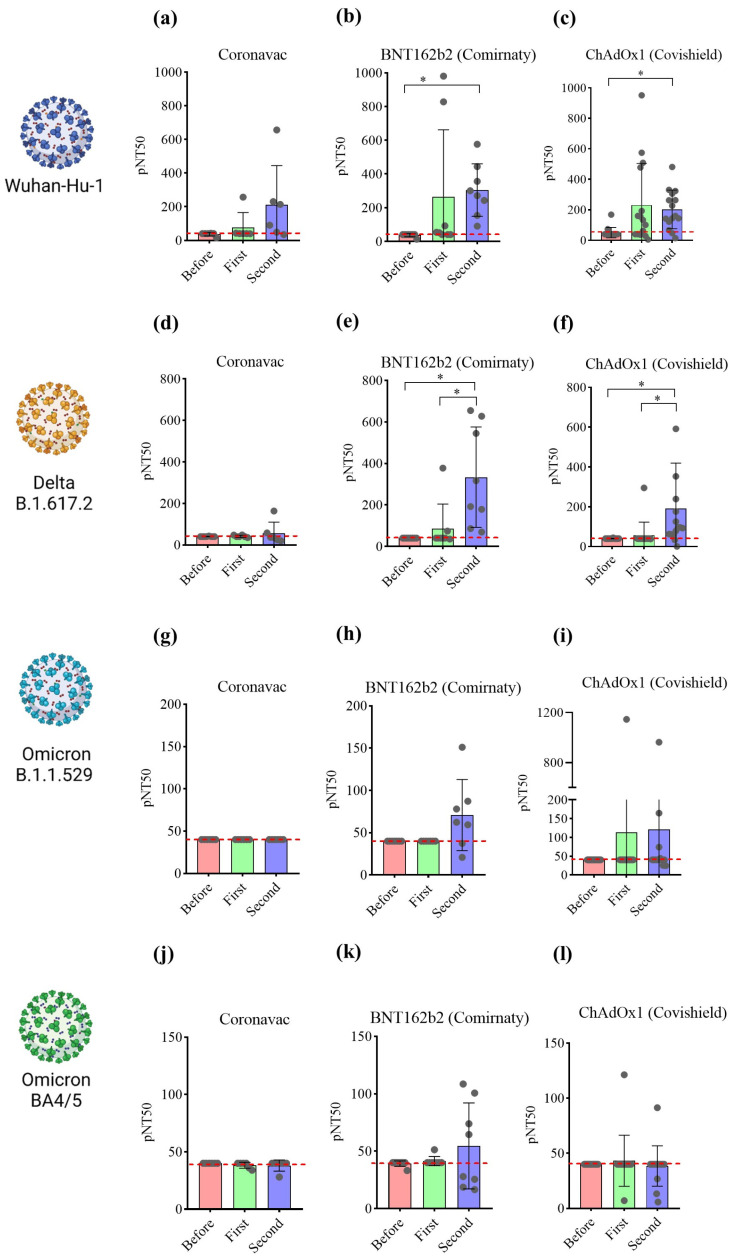
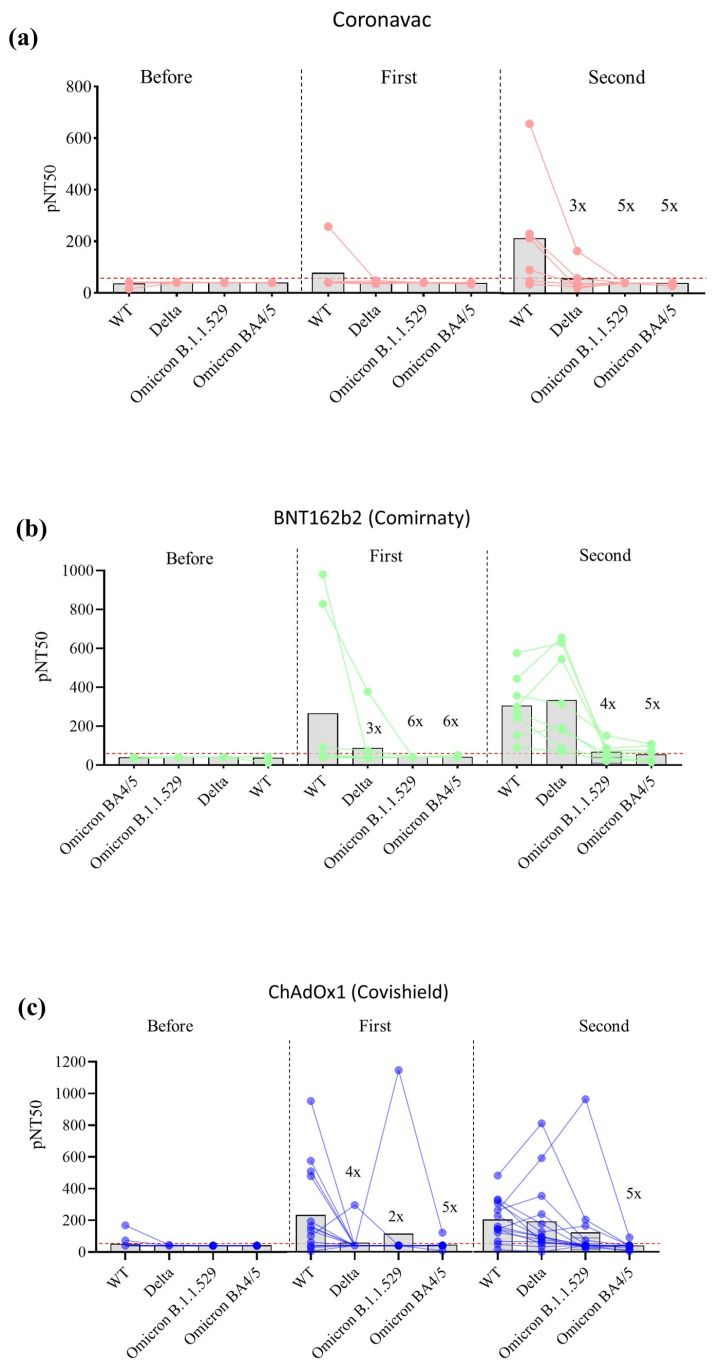
The COVID-19 pandemic and the consequent emergence of new SARS-CoV-2 variants of concern necessitates the determination of populational serum potency against the virus. Here, we standardized and validated an imaging-based method to quantify neutralizing antibodies against lentiviral particles expressing the spike glycoprotein (pseudovirus). This method was found to efficiently quantify viral titers based on ZsGreen-positive cells and detect changes in human serum neutralization capacity induced by vaccination with up to two doses of CoronaVac, Comirnaty, or Covishield vaccines. The imaging-based protocol was also used to quantify serum potency against pseudoviruses expressing spikes from Delta, Omicron BA.1.1.529, and BA.4/5. Our results revealed increases in serum potency after one and two doses of the vaccines evaluated and demonstrated that Delta and Omicron variants escape from antibody neutralization. The method presented herein represents a valuable tool for the screening of antibodies and small molecules capable of blocking viral entry and could be used to evaluate humoral immunity developed by different populations and for vaccine development.

Keywords: SARS-CoV-2; antibodies; high-content screening; neutralization; variants.


Conflict of interest statement

The authors declare no conflicts of interest.

Figures

Figure 1
Figure 1
Automated imaging-based analysis workflow. (a) HEK-293T cells were transfected with plasmids to generate pseudoviruses. Viral particles were collected from supernatants and used in neutralization assays using HEK-293T-ACE2 cells together with serum from volunteers. The quantification of ZsGreen+ cells was determined automatically via Cellomics software using a CX7LZR high-content system. (b) Pseudoviruses without an entry spike protein (bald virus) did not generate fluorescent cells, (c) while spike expression promotes viral entry into ACE2-overexpressing cells. (d,e). The Target Activation protocol from Cellomics was applied to detect cell nuclei and determine the region of interest (ROI) to detect the ZsGreen fluorescence. Representative imaging analysis of the average fluorescence intensity used to separate the cellular population of (f) ZsGreen and (g) ZsGreen+ cells. The cut-off established as 100 was only for representative purposes. The cut-off is finely adjusted in each assay. Nuclei was stained in blue with Hoechst and ZsGreen fluorescence is shown in green.
Figure 2
Figure 2
Detection of viral titers via automated imaging analysis protocol: the percentage of ZsGreen+ cells and average fluorescence intensity were measured by using the image-based analysis protocol. (a) Pseudoviruses expressing the Wuhan-Hu-1 spike glycoprotein are functional, as only HEK293T-ACE2 cells were transduced. Numbers above the graphic line and the arrows denote the reduction fold calculated by the ratio between viral amounts. (b) VSV g-expressing particles were used as a transduction control since both cell lines express the receptor for this ligand. Numbers above the graphic line denote the reduction fold calculated via the ratio between viral amounts. Fluorescence images of (c) bald pseudoviruses, (d) undiluted Wuhan-Hu-1 spike-expressing pseudoviruses, (e) Wuhan-Hu-1 pseudoviruses diluted 3-fold, (f) diluted 9-fold, and (g) diluted 27-fold, as illustrated by decreasing numbers of ZsGreen+ cells. The protocol was shown to both (h) detect decreasing levels of Wuhan-Hu-1 pseudovirus titers based on the percentage of ZsGreen+ and (i) on the average fluorescence intensity. The red line represents the calculated cut-off value (39 a.u.). Data are shown as mean ± SD. * One-way ANOVA, followed by Holm–Sidak’s multiple comparisons test, p < 0.05, calculated by using GraphPad Prism, version 8.0.
Figure 3
Figure 3
Precision tests of the automated imaging analysis. Pseudoviruses expressing the Wuhan-Hu-1 spike glycoprotein were included with WHO 21/338 and 21/340 standard serum samples. The pNT50 was calculated, as well as the CV in the same (intra-assay) or independent experiments (inter-assay). (a) Intra-assay: 3 independent experiments were performed by one researcher. Data were pooled to represent the variation among the samples. (b) Inter-assay analysis: 2 researchers performed 3 independent assays. Data were pooled to represent the variation among the samples. (c,d) Nonlinear curves regarding the precision assays.
Figure 4
Figure 4
Percentage of neutralization and pNT50 values in volunteers immunized with different vaccines. (a) Schematic representation of the cohorts of volunteers tested. Blood from healthy volunteers was collected prior to and 30 days after the first and second doses of three different vaccines against SARS-CoV-2. Serum was collected and stored at −80 °C until use. Samples were tested with neutralization assay kit using recombinant HRP-conjugated RBD of the Wuhan-Hu-1 spike glycoprotein. (bd) Percentage of neutralization of serum from volunteers immunized with CoronaVac (n = 7), Comirnaty (n = 8), or Covishield (n = 15), respectively, at 1:40 dilution. (eg) pNT50 of volunteers immunized with CoronaVac (n = 7), Comirnaty (n = 8), or Covishield (n = 15), respectively. Values considered statistically significant when p < 0.05 (*) via the Friedman test, followed by Dunn’s multiple comparisons test, calculated by using GraphPad Prism, version 8.0. Data are shown as mean ± SD. Circles indicate the volunteers, and red line indicate the lowest pNT50 value equal to 40.
Figure 5
Figure 5
Imaging-based analysis detects the neutralizing capacity of volunteers after vaccination and following boost with (a) CoronaVac, (b) Comirnaty, or (c) Covishield against Wuhan-Hu-1 spike glycoprotein pseudovirus. Samples were submitted to the neutralization image-based assay for method validation. The neutralization capacity of serum specimens was determined by the transduction of HEK293T-ACE2 cells using Wuhan-Hu-1 spike-expressing pseudovirus. Values were considered statistically significant when p < 0.05 (*) examined using Friedman test, followed by Dunn’s multiple comparisons test, calculated by GraphPad Prism, version 8.0. Data are shown as mean ± SD. Circles indicate the volunteers.
Figure 6
Figure 6
Imaging-based analysis characterizes cohorts based on the vaccine administered and number of doses. Validated samples were diluted and submitted to the neutralization image-based assay. Serum potency (pNT50) was determined via nonlinear regression as a function of titers log10 and the inhibition of pseudovirus infection. The pseudoviruses produced expressed (ac) Wuhan-Hu-1, (df) Delta B.1.617.2, (gi) Omicron B.1.1.529, or (jl) Omicron B.A4/5 spike proteins. Values considered statistically significant when p < 0.05 (*) by using Friedman test, followed by Dunn’s multiple comparisons test, calculated by using GraphPad Prism, version 8.0. Data are shown as mean ± SEM. Circles indicate the volunteers, and red line indicate the lowest pNT50 value equal to 40.
Figure 7
Figure 7
Imaging-based analysis can detect VoC neutralization escape. pNT50 values were used to compare serum potency with respect to different VoCs. Graphs show VoC neutralization escape after two doses of (a) Coronavac, (b) Comirnaty, or (c) Covishield. The numbers above the bars (such as 3×, 4×, 5×, and 6×) are the ratio between wild-type and VoCs pNT50 and denote the resistance of variants to the serum tested.

References

    1. Vaccines—COVID-19 Vaccine Tracker. [(accessed on 26 December 2023)]. Available online: https://covid19.trackvaccines.org/vaccines/approved/#vaccine-list.
    1. Watson O.J., Barnsley G., Toor J., Hogan A.B., Winskill P., Ghani A.C. Global Impact of the First Year of COVID-19 Vaccination: A Mathematical Modelling Study. Lancet Infect. Dis. 2022;22:1293–1302. doi: 10.1016/S1473-3099(22)00320-6. - DOI - PMC - PubMed
    1. Acharya C.B., Schrom J., Mitchell A.M., Coil D.A., Marquez C., Rojas S., Wang C.Y., Liu J., Pilarowski G., Solis L., et al. Viral Load among Vaccinated and Unvaccinated, Asymptomatic and Symptomatic Persons Infected with the SARS-CoV-2 Delta Variant. Open Forum Infect. Dis. 2022;9:ofac135. doi: 10.1093/ofid/ofac135. - DOI - PMC - PubMed
    1. Riemersma K.K., Haddock L.A., Wilson N.A., Minor N., Eickhoff J., Grogan B.E., Kita-Yarbro A., Halfmann P.J., Segaloff H.E., Kocharian A., et al. Shedding of Infectious SARS-CoV-2 despite Vaccination. PLoS Pathog. 2022;18:e1010876. doi: 10.1371/journal.ppat.1010876. - DOI - PMC - PubMed
    1. Alu A., Chen L., Lei H., Wei Y., Tian X., Wei X. Intranasal COVID-19 Vaccines: From Bench to Bed. EBioMedicine. 2022;76:103841. doi: 10.1016/j.ebiom.2022.103841. - DOI - PMC - PubMed

LinkOut - more resources