. 2024 Feb 25;12(3):237.
doi: 10.3390/vaccines12030237.

mRNA Therapeutic Vaccine for Hepatitis B Demonstrates Immunogenicity and Efficacy in the AAV-HBV Mouse Model

Affiliations

mRNA Therapeutic Vaccine for Hepatitis B Demonstrates Immunogenicity and Efficacy in the AAV-HBV Mouse Model

Dorien De Pooter et al. Vaccines (Basel). .

Abstract

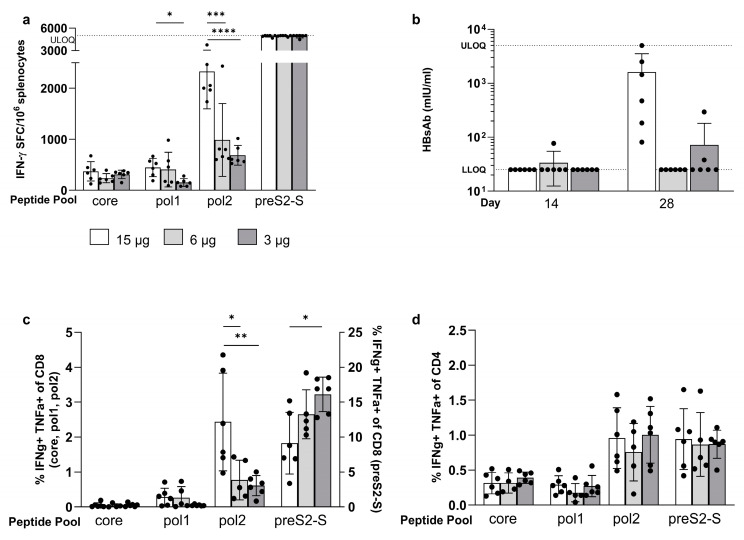
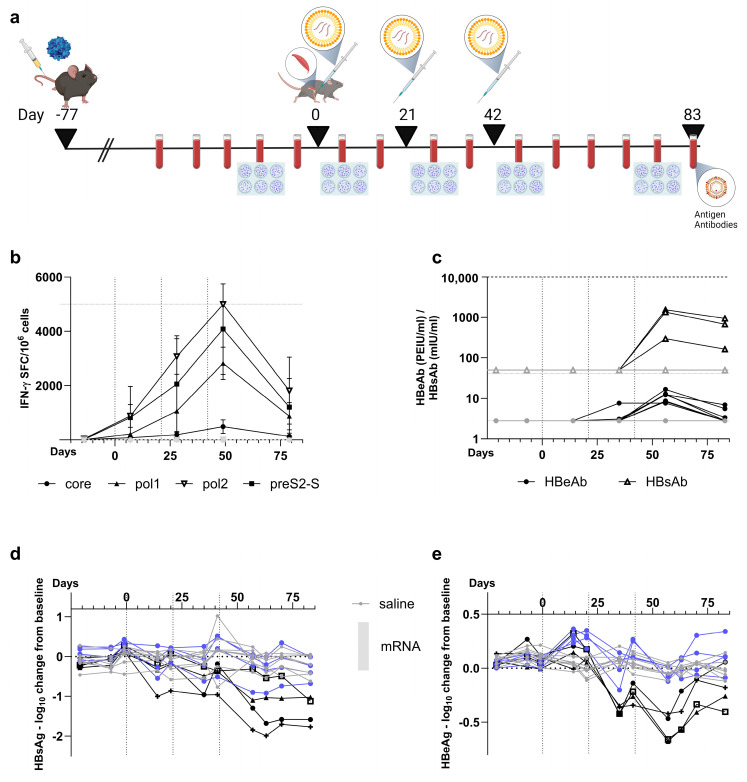
Chronic infection with hepatitis B virus (HBV) develops in millions of patients per year, despite the availability of effective prophylactic vaccines. Patients who resolve acute HBV infection develop HBV-specific polyfunctional T cells accompanied by neutralizing antibodies, while in patients with chronic hepatitis B (CHB), immune cells are dysfunctional and impaired. We describe a lipid nanoparticle (LNP)-formulated mRNA vaccine, optimized for the expression of HBV core, polymerase, and surface (preS2-S) antigens with the aim of inducing an effective immune response in patients with CHB. Prime and prime/boost vaccination with LNP-formulated mRNA encoding for core, pol, and/or preS2-S dosing strategies were compared in naive C57BL/6 and BALB/c mice. Immune responses were assessed by IFN-γ ELISpot, intracellular cytokine staining (ICS), and ELISA for antibody production, whereas anti-viral efficacy was evaluated in the AAV-HBV mouse model. The mRNA vaccine induced strong antigen-specific polyfunctional T cell responses in these mouse models, accompanied by the emergence of anti-HBs and anti-HBe antibodies. After three immunizations, the antigen-specific immune stimulation resulted in up to 1.7 log10 IU/mL reduction in systemic HBV surface antigen (HBsAg), accompanied by a transient drop in systemic HBeAg, and this was observed in 50% of the AAV-HBV-transduced mice in the absence of additional modalities such as adjuvants, HBsAg reducing agents, or checkpoint inhibitors. However, no treatment-related effect on viremia was observed in the liver. These results warrant further optimization and evaluation of this mRNA vaccine as a candidate in a multimodal therapeutic regimen for the treatment of chronic HBV infection.

Keywords: AAV-HBV mice; HBsAg reduction; chronic hepatitis B; lipid nanoparticles; mRNA vaccine; therapeutic vaccination.


Conflict of interest statement

D.D.P., B.D.C., I.N., H.D., E.V.G., S.P., and D.B. were employed by Janssen Research and Development at the time of the research and may be Johnson and Johnson stockholders. All other authors declare no conflicts of interest.

Figures

Figure 1
Figure 1
Vaccine composition (a) The vaccine is composed of mRNA encoding for antigens of the HBV virion: core, polymerase, and preS2-S envelope protein; (b) LNPs containing mRNA encoding for a single HBV antigen; (c) the coformulated mRNA vaccine is a mixture of the three different LNPs, each containing mRNA encoding for a single HBV antigen; (d) the co-encapsulated formulation contains mRNA encoding for all antigens, encapsulated within one LNP. (One mRNA copy per LNP is for illustration only; created with BioRender.com, accessed on 19 January 2024.)
Figure 2
Figure 2
Evaluation of induced immune responses in naïve C57BL/6 mice after vaccination with MC3-formulated mRNA vaccine encoding for one HBV antigen. (a) Dosing scheme for prime and prime/boost strategy. Mice that were only primed received a vaccine on day 0 where responses are evaluated on day 14. In a prime/boost strategy, mice received a prime (day 0) and a boost (day 21) with an evaluation of the responses on day 28 (created with BioRender.com, accessed on 19 January 2024). (b) Induced immune responses, as measured by IFN-γ ELISpot (vertical axis), in a dose range (horizontal axis) finding (5, 2, 1, and 0.2 µg) after a prime dose of core-expressing mRNA (n = 6). (c) Induced immune responses, as measured by IFN-γ ELISpot (vertical axis), split per peptide stimulus (horizontal axis) in a comparison between prime (white) and prime/boost (grey) dosing schedules for the dosed formulated mRNA core (circles), pol (triangles), and preS2-S (open circles) at 5 µg (n = 6). (d) Induced immune responses, as measured by IFN-γ ELISpot (vertical axis), split per peptide stimulus (horizontal axis) in a comparison between different doses (10 µg white, 5 µg light grey, and 2 µg dark grey) of formulated mRNA core (circles), pol (triangles), and preS2-S (open circles) in a prime/boost dosing strategy (n = 6). Results are shown as mean ± standard deviation. Statistical analysis is performed by one-way ANOVA of the mean of log10 transformed data points (* p ≤ 0.05, ** p ≤ 0.01, ****, p ≤ 0.0001).
Figure 3
Figure 3
Evaluation of dose finding study in naive C57BL/6 mice after vaccination with MC3-coformulated mRNAs. Naive C57BL/6 mice (n = 6) were dosed via prime/boost strategy using 15 µg (white bars), 6 µg (light grey bars), and 3 µg (dark grey bars) of coformulation encoding for the HBV antigens. (a) Induced immune responses, as measured by IFN-γ ELISpot (vertical axis), split per peptide stimulus (horizontal axis). (b) Induced concentrations of anti-HBs (vertical axis), as measured by CLIA, on day 14 and 28 (horizontal axis). % of polyfunctional CD8+ T cells (c) and CD4+ T cells (d) defined as % of IFN-γ and TNF-α double positive cells of parent (vertical axis), split per peptide stimulation (horizontal axis). Results are shown as mean ± standard deviation. Statistical comparison is performed by unpaired t-test or one-way ANOVA on log10 transformed data for ELISpot and on logit transformed data for ICS (* p ≤ 0.05, ** p ≤ 0.01, *** p ≤ 0.001, and **** for p ≤ 0.0001).
Figure 4
Figure 4
Evaluation of induced immune responses in naive C57BL/6 mice after vaccination with coformulated versus co-encapsulated (MC3) mRNA encoding for HBV antigens. Naive C57BL/6 mice (n = 6) were dosed via prime/boost strategy using coformulated (open circles) or co-encapsulated (closed circles) mRNA encoding for the three HBV antigens using a total of 15 µg. (a) Induced immune responses, as measured by IFN-γ ELISpot (vertical axis), split by peptide stimulation (horizontal axis). Levels of induced anti-HBs (b) and anti-HBe (c) antibodies (vertical axis) in the serum measured via CLIA one day −1, 14, and 28 (horizontal axis). % of polyfunctional CD8+ T cells (d) and CD4+ T cells (e) defined as % of IFN-γ and TNF-α double positive cells of parent (vertical axis), split per peptide stimulation (horizontal axis). Results are shown as mean ± standard deviation. Statistical comparison is performed by unpaired t-test or one-way ANOVA on log10 transformed data for ELISpot and antibodies, and on logit transformed data for ICS (* p ≤ 0.05).
Figure 5
Figure 5
Evaluation of induced immune responses in naive BALB/c mice after vaccination with ALC-0315-co-encapsulated mRNA encoding for HBV antigens. Naive BALB/c mice were dosed via a prime/boost strategy using co-encapsulated mRNA encoding for the three HBV antigens using 6 µg (black circles, n = 8) and were compared to saline control (grey circles; n = 4). (a) Induced immune responses, as measured by IFN-γ ELISpot (vertical axis), split by peptide stimulation (horizontal axis). (b) Induced concentrations of anti-HBs (vertical axis), measured by CLIA, on day −1, 14, 21, and 28 (horizontal axis). % of polyfunctional CD8+ T cells (c) and CD4+ T cells (d) defined as % of IFN-γ and TNF-α double positive cells of parent (vertical axis), split per peptide stimulation (horizontal axis). Results are shown as mean ± standard deviation. Statistical comparison is performed by unpaired t-test or one-way ANOVA on log10 transformed data for ELISpot and antibodies, and on logit transformed data for ICS (** p ≤ 0.01, *** p ≤ 0.001, and **** for p ≤ 0.0001).
Figure 6
Figure 6
Evaluation of ALC-0315-co-encapsulated mRNA vaccine in AAV-HBV-transduced C57BL/6 mice. (a) Scheme of AAV-HBV-transduced mouse experiment where the mice were dosed 77 days after transduction (n = 8). Vaccination with co-encapsulated mRNA vaccine occurred three times with 21-day intervals where the first dose was set on day 0. Blood was drawn weekly (red tubes), and on day −14, 7, 28, 49, and 79 post dosing, leucocytes were isolated for IFN-γ ELISpot (plates). On all other weeks, HBsAg, HBeAg, anti-HBs, and anti-HBe were measured. Mice were vaccinated at 10 µg (black) compared to saline control (grey). (created with BioRender.com, accessed on 19 January 2024) (b) Induced immune responses (mean ± SD) over time (horizontal axis), as measured by IFN-γ ELISpot (vertical axis), split per peptide stimulation (core: circles; pol1: triangles; pol2: reverse open triangles; and preS2-S, squares). (c) Induced concentrations (vertical axis) of anti-HBs (triangles) or anti-HBe (circles) antibodies, measured via CLIA for vaccinated (black) and saline control (grey) shown for each individual mouse. Log10 change from baseline (vertical axis) for concentrations of HBsAg (d) and HBeAg (e) measured via CLIA for mRNA-vaccinated mice (blue circles for the mice without effect on HBsAg levels and black for the mice with >1 log10 reduction in HBsAg levels, for which each mouse is visualized with a different symbol that reoccurs in subsequent figures); and saline control (grey) shown for each individual mouse.
Figure 7
Figure 7
Evaluation of liver and spleen at the end point of the AAV-HBV-transduced mouse experiment. (a) Schematic overview of performed assays on liver and spleen at the end of the efficacy study in AAV-HBV-transduced mice. Flow cytometry was performed on purified splenocytes, ALT-levels on serum, and viral parameters were assessed on FFPE slides of liver. The spleen was used to check for polyfunctional T cells (created with BioRender.com, accessed on 24 February 2024). (b) ALT levels measured over time in the AAV-HBV experiment. (c) % of the liver area positive of HBsAg and the proportion of HBcAg-positive cells (vertical axis) for vaccinated (black and blue; corresponding to Figure 6d,e) and saline control group (grey) measured using immunohistochemistry on FFPE slides from the liver (dotted bars). % of polyfunctional CD8+ T cells (d) and CD4+ T cells (e) defined as % of IFN-γ and TNF-α double positive cells of parent (vertical axis) in spleen, split by stimulation peptide (horizontal axis). For (ce): blue circles are used for the mice without any effect on HBsAg levels and black for the mice with >1 log10 reduction in HBsAg levels, for which each mouse is visualized with a different symbol corresponding to the symbols in Figure 6d,e); saline control in grey. Results are shown as mean ± standard deviation. Statistical comparison is performed by unpaired t-test or one-way ANOVA on logit transformed data (* p ≤ 0.05, *** p ≤ 0.001, and **** for p ≤ 0.0001).

References

    1. WHO Hepatitis B. [(accessed on 18 July 2023)]. Available online: https://www.who.int/news-room/fact-sheets/detail/hepatitis-b.
    1. Noordeen F. Hepatitis B virus infection: An insight into infection outcomes and recent treatment options. Virusdisease. 2015;26:1–8. doi: 10.1007/s13337-015-0247-y. - DOI - PMC - PubMed
    1. Gerlich W.H. Prophylactic vaccination against hepatitis B: Achievements, challenges and perspectives. Med. Microbiol. Immunol. 2015;204:39–55. doi: 10.1007/s00430-014-0373-y. - DOI - PubMed
    1. Grossi G., Vigano M., Loglio A., Lampertico P. Hepatitis B virus long-term impact of antiviral therapy nucleot(s)ide analogues (NUCs) Liver Int. 2017;37((Suppl. S1)):45–51. doi: 10.1111/liv.13291. - DOI - PubMed
    1. Boni C., Barili V., Acerbi G., Rossi M., Vecchi A., Laccabue D., Penna A., Missale G., Ferrari C., Fisicaro P. HBV Immune-Therapy: From Molecular Mechanisms to Clinical Applications. Int. J. Mol. Sci. 2019;20:2754. doi: 10.3390/ijms20112754. - DOI - PMC - PubMed

LinkOut - more resources