

Risk Factors for COVID-19 and Respiratory Tract Infections during the Coronavirus Pandemic
- PMID: 38543963
- PMCID: PMC10974083
- DOI: 10.3390/vaccines12030329
Risk Factors for COVID-19 and Respiratory Tract Infections during the Coronavirus Pandemic
Abstract
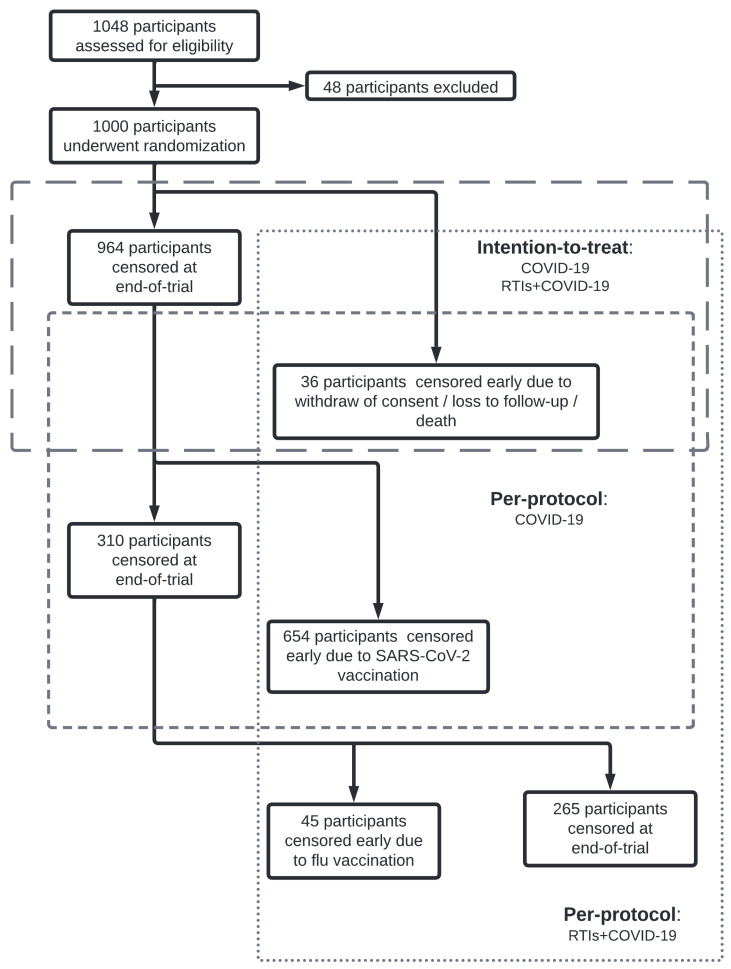
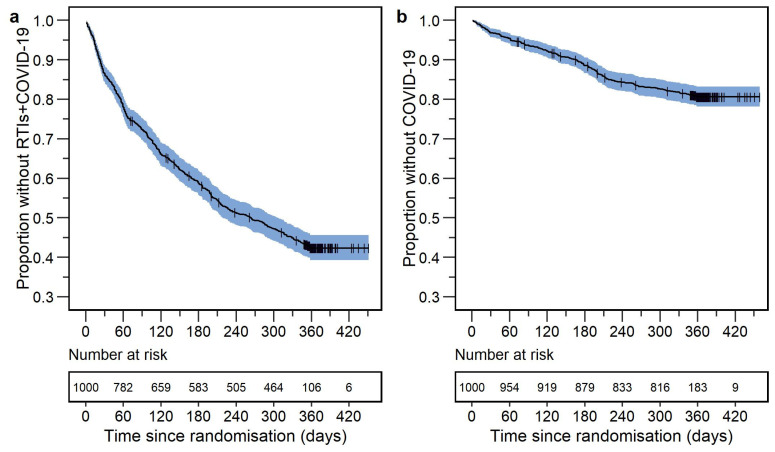
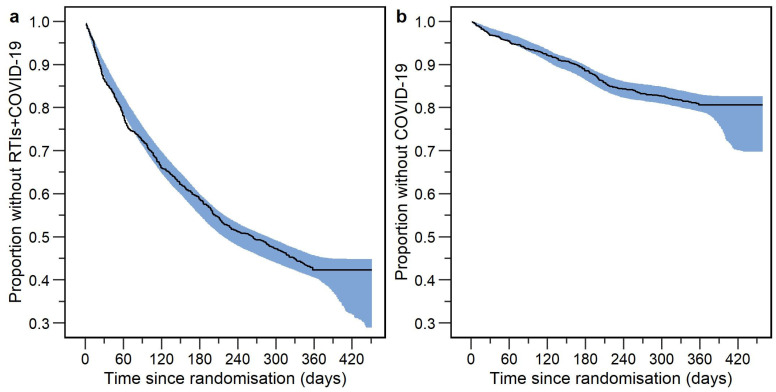
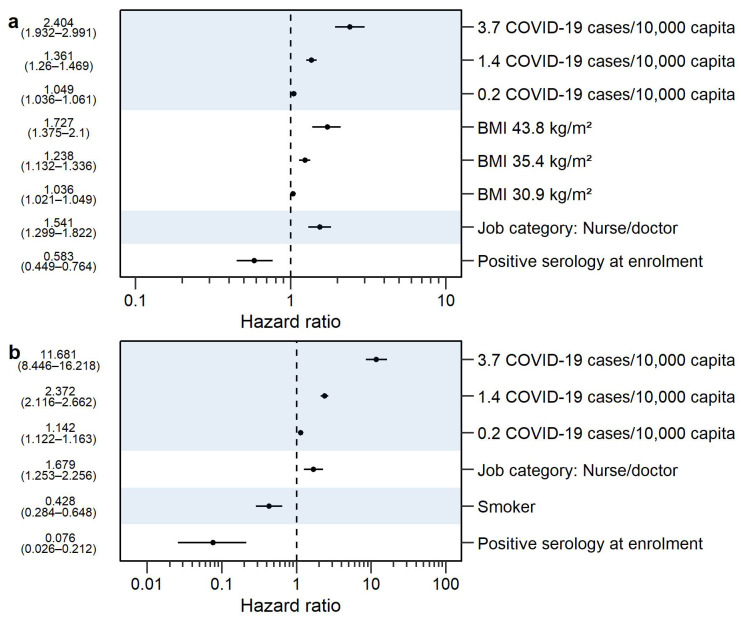
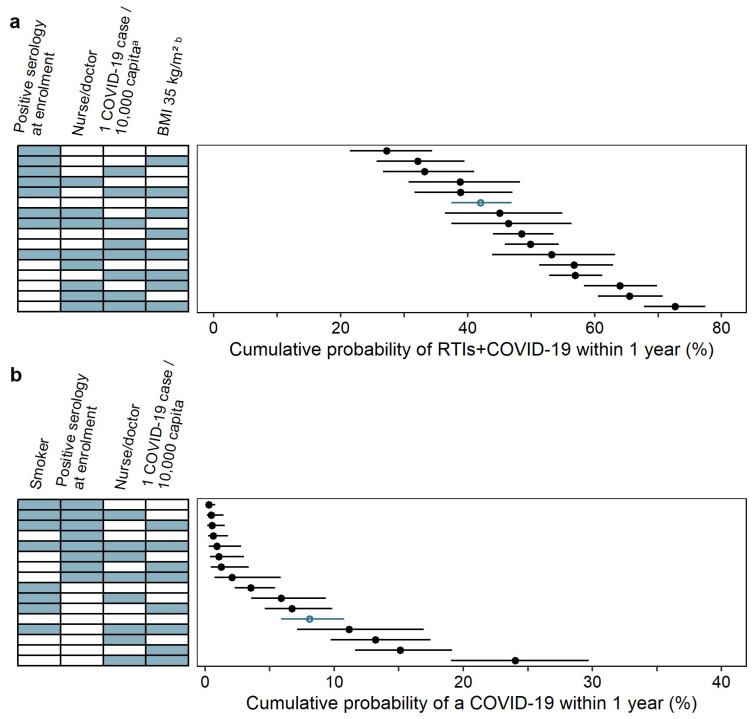
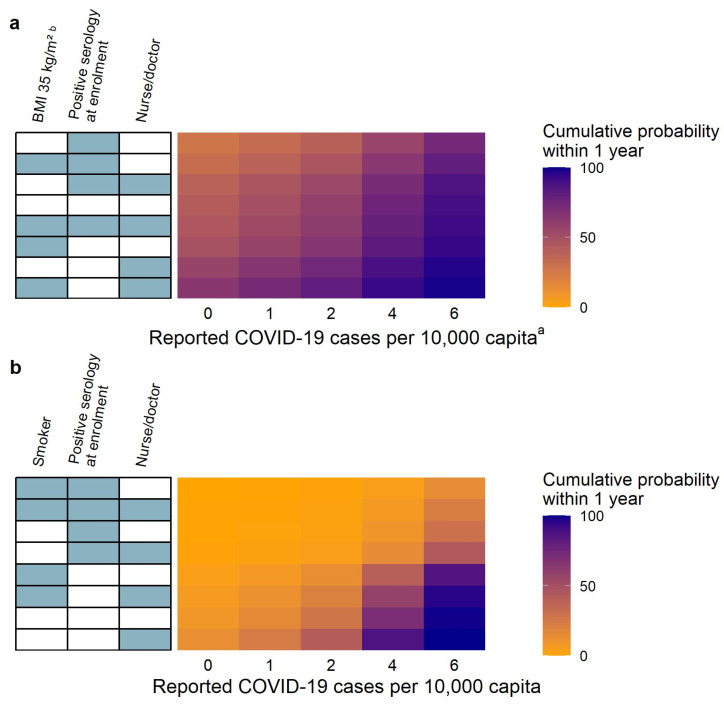
(1) Background: Some individuals are more susceptible to developing respiratory tract infections (RTIs) or coronavirus disease (COVID-19) than others. The aim of this work was to identify risk factors for symptomatic RTIs including COVID-19 and symptomatic COVID-19 during the coronavirus pandemic by using infection incidence, participant baseline, and regional COVID-19 burden data. (2) Methods: Data from a prospective study of 1000 frontline healthcare workers randomized to Bacillus Calmette-Guérin vaccination or placebo, and followed for one year, was analyzed. Parametric time-to-event analysis was performed to identify the risk factors associated with (a) non-specific symptomatic respiratory tract infections including COVID-19 (RTIs+COVID-19) and (b) symptomatic RTIs confirmed as COVID-19 using a polymerase chain reaction or antigen test (COVID-19). (3) Results: Job description of doctor or nurse (median hazard ratio [HR] 1.541 and 95% confidence interval [CI] 1.299-1.822), the reported COVID-19 burden (median HR 1.361 and 95% CI 1.260-1.469 for 1.4 COVID-19 cases per 10,000 capita), or a BMI > 30 kg/m2 (median HR 1.238 and 95% CI 1.132-1.336 for BMI of 35.4 kg/m2) increased the probability of RTIs+COVID-19, while positive SARS-CoV-2 serology at enrollment (median HR 0.583 and 95% CI 0.449-0.764) had the opposite effect. The reported COVID-19 burden (median HR 2.372 and 95% CI 2.116-2.662 for 1.4 COVID-19 cases per 10,000 capita) and a job description of doctor or nurse (median HR 1.679 and 95% CI 1.253-2.256) increased the probability of developing COVID-19, while smoking (median HR 0.428 and 95% CI 0.284-0.648) and positive SARS-CoV-2 serology at enrollment (median HR 0.076 and 95% CI 0.026-0.212) decreased it. (4) Conclusions: Nurses and doctors with obesity had the highest probability of developing RTIs including COVID-19. Non-smoking nurses and doctors had the highest probability of developing COVID-19 specifically. The reported COVID-19 burden increased the event probability, while positive SARS-CoV-2 IgG serology at enrollment decreased the probability of RTIs including COVID-19, and COVID-19 specifically.
Keywords: COVID-19; pharmacometrics; respiratory tract infections; risk factors; time-to-event analysis.
Conflict of interest statement
The authors declare no conflicts of interest.
Figures
Similar articles
-
Bacillus Calmette-Guérin vaccine for prevention of COVID-19 and other respiratory tract infections in older adults with comorbidities: a randomized controlled trial.Clin Microbiol Infect. 2023 Jun;29(6):781-788. doi: 10.1016/j.cmi.2023.01.019. Epub 2023 Feb 2. Clin Microbiol Infect. 2023. PMID: 36736662 Free PMC article. Clinical Trial.
-
Seasonal influence on respiratory tract infection severity including COVID-19 quantified through Markov Chain modeling.CPT Pharmacometrics Syst Pharmacol. 2023 Sep;12(9):1250-1261. doi: 10.1002/psp4.13006. Epub 2023 Jul 10. CPT Pharmacometrics Syst Pharmacol. 2023. PMID: 37401774 Free PMC article.
-
A randomized, double-blind, placebo-controlled phase III clinical trial to evaluate the efficacy and safety of SARS-CoV-2 vaccine (inactivated, Vero cell): a structured summary of a study protocol for a randomised controlled trial.Trials. 2021 Apr 13;22(1):276. doi: 10.1186/s13063-021-05180-1. Trials. 2021. PMID: 33849629 Free PMC article.
-
Non-Specific Effects of Bacillus Calmette-Guérin: A Systematic Review and Meta-Analysis of Randomized Controlled Trials.Vaccines (Basel). 2023 Jan 4;11(1):121. doi: 10.3390/vaccines11010121. Vaccines (Basel). 2023. PMID: 36679966 Free PMC article. Review.
-
Topical antibiotic prophylaxis to reduce respiratory tract infections and mortality in adults receiving mechanical ventilation.Cochrane Database Syst Rev. 2021 Jan 22;1(1):CD000022. doi: 10.1002/14651858.CD000022.pub4. Cochrane Database Syst Rev. 2021. PMID: 33481250 Free PMC article.
References
-
- World Health Organisation WHO Coronavirus (COVID-19) Dashboard. [(accessed on 18 January 2024)]. Available online: https://data.who.int/dashboards/covid19/cases?n=c.
-
- CDC Key Facts about Flu Season, Influenza Viruses, How Flu Spreads, and Information for Specific High Risk Groups. [(accessed on 18 January 2024)]; Available online: https://www.cdc.gov/flu/about/index.html.
-
- CDC Tuberculosis Risk Factors. [(accessed on 17 January 2024)]; Available online: https://www.cdc.gov/tb/topic/basics/risk.htm.
-
- Ho F.K., Celis-Morales C.A., Gray S.R., Katikireddi S.V., Niedzwiedz C.L., Hastie C., Ferguson L.D., Berry C., Mackay D.F., Gill J.M., et al. Modifiable and Non-Modifiable Risk Factors for COVID-19, and Comparison to Risk Factors for Influenza and Pneumonia: Results from a UK Biobank Prospective Cohort Study. BMJ Open. 2020;10:e040402. doi: 10.1136/bmjopen-2020-040402. - DOI - PMC - PubMed
Grants and funding
LinkOut - more resources
Full Text Sources
Miscellaneous
