

Unveiling Morphine: A Rapid and Selective Fluorescence Sensor for Forensic and Medical Analysis
- PMID: 38543983
- PMCID: PMC10974434
- DOI: 10.3390/s24061722
Unveiling Morphine: A Rapid and Selective Fluorescence Sensor for Forensic and Medical Analysis
Abstract
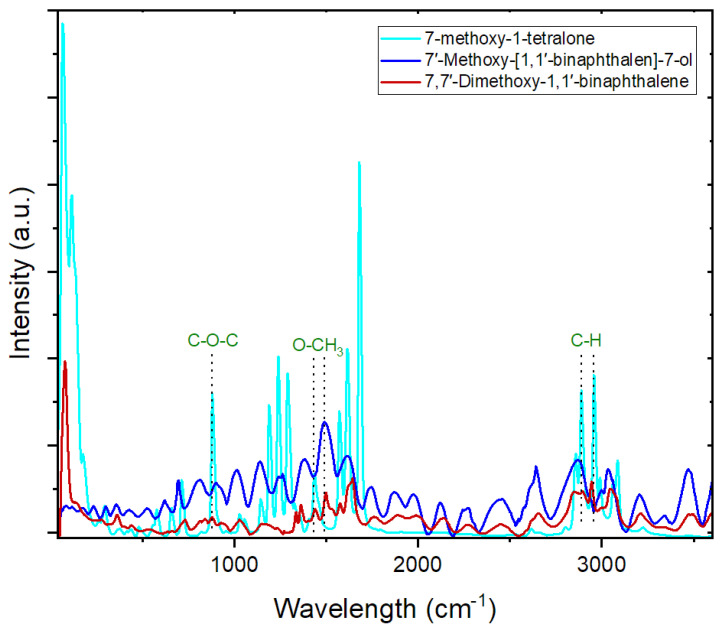
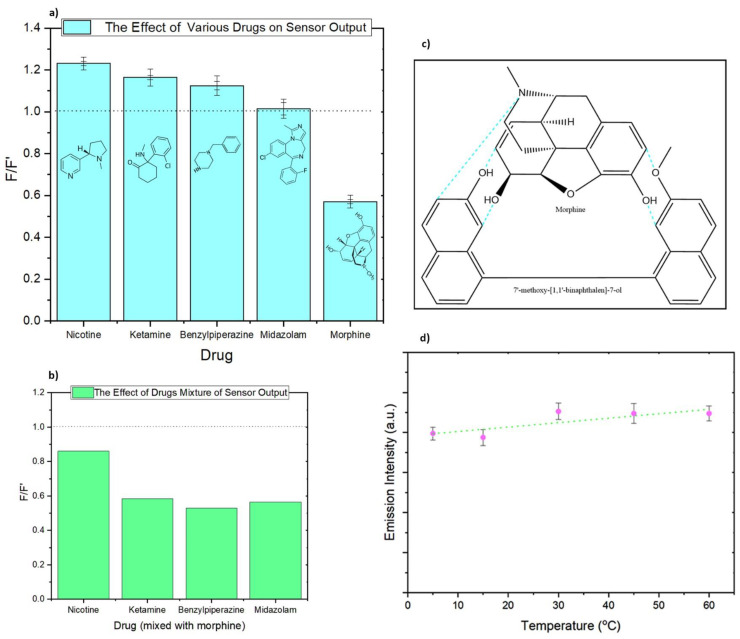
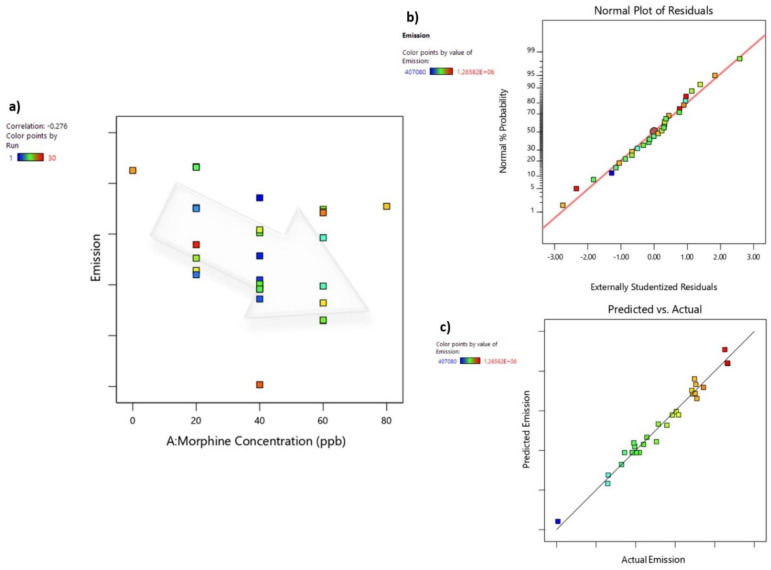
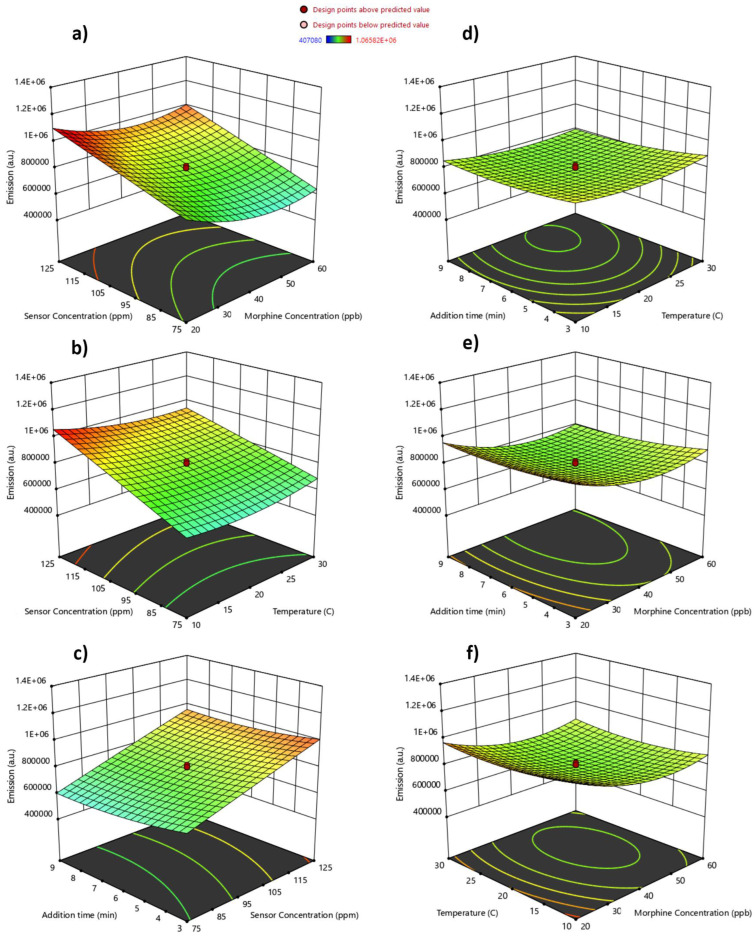
Opioid use, particularly morphine, is linked to CNS-related disorders, comorbidities, and premature death. Morphine, a widely abused opioid, poses a significant global health threat and serves as a key metabolite in various opioids. Here, we present a turn-off fluorescent sensor capable of detecting morphine with exceptional sensitivity and speed in various samples. The fluorescent sensor was developed through the dimerization process of 7-methoxy-1-tetralone and subsequent demethylation to produce the final product. Despite morphine possessing inherent fluorophoric properties and emitting light in an approximately similar wavelength as the sensor's fluorescent blue light, the introduction of the target molecule (morphine) in the presence of the sensor caused a reduction in the sensor's fluorescence intensity, which is attributable to the formation of the sensor-morphine complex. By utilizing this fluorescence quenching sensor, the chemo-selective detection of morphine becomes highly feasible, encompassing a linear range from 0.008 to 40 ppm with an impressive limit of detection of 8 ppb. Consequently, this molecular probe demonstrates a successful application in determining trace amounts of morphine within urine, yielding satisfactory analytical results. The study also explores the effect of several variables on the sensor's response and optimizes the detection of morphine in urine using a response surface methodology with a central composite design.
Keywords: CCD-RSM; forensic biological fluids; morphine; toxicology; turn-off sensor.
Conflict of interest statement
The authors declare no conflict of interest.
Figures


Similar articles
-
Rapid Discovery of Illuminating Peptides for Instant Detection of Opioids in Blood and Body Fluids.Molecules. 2019 May 10;24(9):1813. doi: 10.3390/molecules24091813. Molecules. 2019. PMID: 31083395 Free PMC article.
-
Dual-Emission Carbon-Dot Ratiometric Fluorescence Sensor for Morphine Recognition in Biological Samples.Biosensors (Basel). 2023 Jan 15;13(1):143. doi: 10.3390/bios13010143. Biosensors (Basel). 2023. PMID: 36671978 Free PMC article.
-
Fluorometric determination of morphine via its effect on the quenching of fluorescein by gold nanoparticles through a surface energy transfer process.Mikrochim Acta. 2018 Nov 6;185(12):532. doi: 10.1007/s00604-018-3050-9. Mikrochim Acta. 2018. PMID: 30402728
-
A new and highly selective turn-on fluorescent sensor with fast response time for the monitoring of cadmium ions in cosmetic, and health product samples.Spectrochim Acta A Mol Biomol Spectrosc. 2016 Jun 15;163:120-6. doi: 10.1016/j.saa.2016.03.011. Epub 2016 Mar 15. Spectrochim Acta A Mol Biomol Spectrosc. 2016. PMID: 27045784
-
How new nanotechnologies are changing the opioid analysis scenery? A comparison with classical analytical methods.Forensic Sci Res. 2024 Jan 5;9(1):owae001. doi: 10.1093/fsr/owae001. eCollection 2024 Mar. Forensic Sci Res. 2024. PMID: 38560581 Free PMC article. Review.
Cited by
-
Rank annihilation factor analysis for kinetic spectrophotometric determination of morphine in unknown samples.Sci Rep. 2025 Apr 11;15(1):12523. doi: 10.1038/s41598-025-97220-y. Sci Rep. 2025. PMID: 40217073 Free PMC article.
-
Poly-taurine/poly-L-glutamic acid double-layer coating as potential candidates for surface modification of carbon felt electrode for discrimination and simultaneous detection of morphine and tramadol.Mikrochim Acta. 2025 Mar 24;192(4):249. doi: 10.1007/s00604-025-07034-y. Mikrochim Acta. 2025. PMID: 40126639
References
-
- Elmizadeh H., Bardajee G.R., Moaddeli A. Ultrasensitive and rapid detection of methamphetamine in forensic biological fluids using fluorescent apta-nanobiosensors based on CdTe quantum dots. Microchem. J. 2023;189:108519. doi: 10.1016/j.microc.2023.108519. - DOI
-
- Zanfrognini B., Pigani L., Zanardi C. Recent advances in the direct electrochemical detection of drugs of abuse. J. Solid State Electrochem. 2020;24:2603–2616. doi: 10.1007/s10008-020-04686-z. - DOI
MeSH terms
Substances
LinkOut - more resources
Full Text Sources
