. 2024 Mar 7;24(6):1720.
doi: 10.3390/s24061720.

How Approaching Angle, Bottleneck Width and Walking Speed Affect the Use of a Bottleneck by Individuals

Affiliations

How Approaching Angle, Bottleneck Width and Walking Speed Affect the Use of a Bottleneck by Individuals

Ann Katrin Boomers et al. Sensors (Basel). .

Abstract

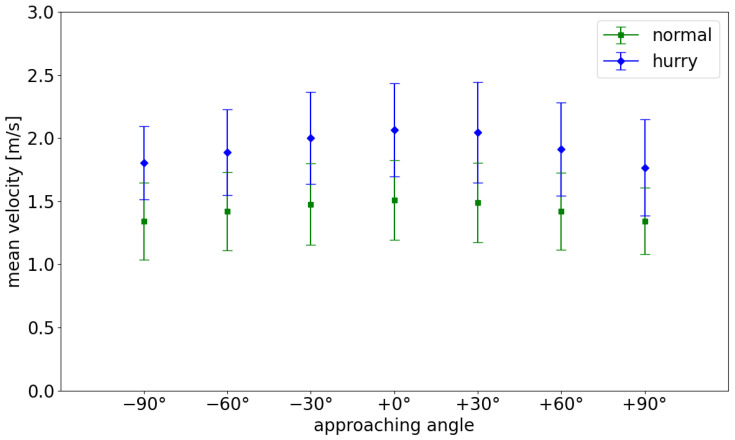
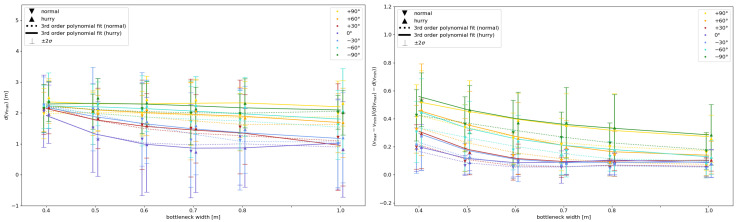
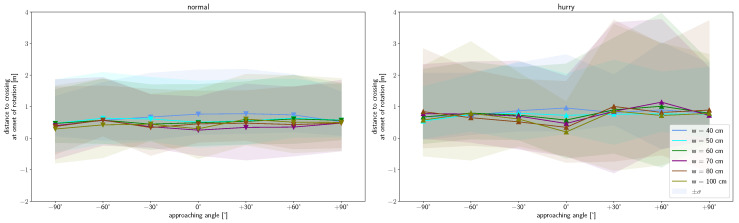
Understanding pedestrian dynamics at bottlenecks and how pedestrians interact with their environment-particularly how they use and move in the space available to them-is of safety importance, since bottlenecks are a key point for pedestrian flow. We performed a series of experiments in which participants walked through a bottleneck individually for varying combinations of approaching angle, bottleneck width and walking speed, to investigate the dependence of the movement on safety-relevant influencing factors. Trajectories as well as 3D motion data were recorded for every participant. This paper shows that (1) the maximum amplitude of shoulder rotation is mainly determined by the ratio of the bottleneck width to the shoulder width of the participant, while the direction is determined by the starting angle and the foot position; (2) the 'critical point' is not invariant to the starting angle and walking speed; (3) differences between the maximum and minimum speed values arise mainly from the distribution of deceleration patterns; and (4) the position of crossing shifts by 1.75 cm/10 cm, increasing the bottleneck width in the direction of origin.

Keywords: 3D motion capturing; bottleneck; bottleneck crossing; pedestrian movement; shoulder rotation.


Conflict of interest statement

The authors declare no conflicts of interest.

Figures

Figure A1
Figure A1
Mean velocity values for approaching angles as shown in Figure 1(left). Green squares denote data of normal walking speed condition and blue diamonds of hurried walking condition. Whiskers denote 2σ interval.
Figure A2
Figure A2
Upward pointing triangles denote data of hurried speed condition, downward pointing triangles denote data of normal walking speed condition. Colors denote approaching angle, whiskers show the 2σ interval. Solid/dashed lines show third-order polynomial fit for hurried/normal walking, respectively. Panels show (left) distance to crossing at time of vmax against bottleneck width and (right) decline in speed from vmax to vmin over time for increasing bottleneck widths.
Figure A3
Figure A3
Exemplary deceleration curves from categories ‘long & strong’ (upper, left), ‘short & strong’ (upper, right), ‘long & weak’ (middle, left), ‘none’ (middle, right) and ‘none at all’ (bottom) as a function of distance to crossing. Blue crosses denote original data, green line denotes smoothed curve of original data, red line denotes evaluated group and grey shading denotes threshold calculated from 3σ of acceleration during straight walking phase. Orange dot denotes the deceleration point.
Figure A4
Figure A4
Parameters a, b, c and d of exponential fit function f(x)=aebx+c+d, as mentioned in Section 3.
Figure A5
Figure A5
Scatterplot of maximum shoulder rotation as a function of the distance to crossing at the time of the onset of shoulder rotation for all runs. Subfigures show profiles for different starting angles: (left) 0°, (upper, left to right) +30°, +60°, +90° and (lower, left to right) −30°, −60°, −90°. The foot on the floor at the time of maximum rotation is indicated by the color (orange: left, blue: right, grey: no foot).
Figure A6
Figure A6
Scatterplot of maximum shoulder rotation as a function of the distance to crossing at the time of maximum rotation for all runs. Subfigures show profiles for different starting angles: (left) 0°, (upper, left to right) +30°, +60°, +90° and (lower, left to right) −30°, −60°, −90°. The foot on the floor at the time of maximum rotation is indicated by the color (orange: left, blue: right, grey: no foot).
Figure 1
Figure 1
(left) Sketch of experimental setup and coordinate system exemplary for bottleneck width of 1.0 m. Bottleneck geometry is given in grey. Orange squares denote starting areas of participants. Red star denotes center of bottleneck. (right) Snapshot of participant walking individually from starting position at angle of +90° in software PeTrack [32]. Trajectories for each person visible in the snapshot are displayed as overlay in red.
Figure 2
Figure 2
(left) Top view and (right) side view of participant equipped with orange hat, individual code, marked shoulders and motion capturing suit.
Figure 3
Figure 3
Histogram of frequency of occurrence of deceleration curves rated as ‘long & strong’, ‘short & strong’, ‘long & weak’, ‘none’ or ‘none at all’ depending on the starting angle. (left) For normal walking and (right) for hurried walking.
Figure 4
Figure 4
Schematic visualizing definition of shoulder rotation. The movement direction is indicated by the red arrow and the shoulderline by the black arrow. Blue and green circles symbolize colored shoulder markers of participants (c.f. Figure 2). Subfigures show (left) left turn, (middle) no rotation and (right) right turn.
Figure 5
Figure 5
Speed profiles as a function of the distance to crossing the bottleneck. Subfigures show profiles for different starting angles: (left) 0°, (upper, left to right) +30°, +60°, +90° and (lower, left to right) −30°, −60°, −90°. Thick lines denote mean profiles calculated from individual profiles plotted as thin lines. Dotted lines denote runs under normal walking conditions; solid lines denote runs under hurried walking conditions. Colors denote bottleneck widths.
Figure 6
Figure 6
Start of deceleration as a function of starting angle (left) for normal walking and (right) for hurried walking. Colors denote bottleneck width. Markers indicate mean values. Shaded area denotes 2σ interval.
Figure 7
Figure 7
(left) Normalized heatmap showing probability of walking paths from COM trajectories for all seven starting angles, exemplarily for a bottleneck width of 0.5 m. (right) Crossing point as a function of bottleneck width calculated from COM trajectories. Triangles denote mean values for both speed conditions (up/hurried, down/normal) and are shifted apart for better visibility. Whiskers denote 2σ interval; colors indicate starting angles. The linear fit is shown in dotted lines for normal and in solid lines for hurried walking.
Figure 8
Figure 8
Absolute rotation profiles as a function of the distance to crossing the bottleneck. Subfigures show profiles for different starting angles: (left) 0°, (upper, left to right) +30°, +60°, +90° and (lower, left to right) −30°, −60°, −90°. Thick lines denote mean profiles calculated from individual profiles plotted as thin lines. Dotted lines denote runs under normal walking conditions and solid lines runs under hurried walking conditions. Colors denote bottleneck widths.
Figure 9
Figure 9
Distance to crossing at the onset of shoulder rotation as a function of approaching angle for normal (left) and hurried (right) walking. Markers show mean values and shaded area the 2σ interval. Colors denote respective bottleneck widths.
Figure 10
Figure 10
Distance to crossing at the time at which the maximum amplitude of shoulder rotation is exerted as a function of approaching angle for normal (left) and hurried (right) walking. Markers show mean values and shaded area the 2σ interval. Colors denote respective bottleneck widths.
Figure 11
Figure 11
Maximum absolute shoulder rotation as a function of the ratio R=w/s. Subfigures show data points for different starting angles: (left) 0°, (upper, left to right) +30°, +60°, +90° and (lower, left to right) −30°, −60°, −90°. Solid lines show exponential fit for hurried and dashed lines for normal walking conditions. Markers show individual data points (green: normal, blue: hurried).
Figure 12
Figure 12
Critical point Rcrit as a function of approaching angle for normal (green) and hurried (blue) walking.
Figure 13
Figure 13
Scatterplot of maximum shoulder rotation as a function of the distance to crossing at the time of maximum rotation for runs with R1.3. Subfigures show profiles for different starting angles: (left) 0°, (upper, left to right) +30°, +60°, +90° and (lower, left to right) −30°, −60°, −90°. The foot on the floor at the time of maximum rotation is denoted by the color (orange: left, blue: right, grey: no foot).
Figure 14
Figure 14
Heatmap of correlation matrix between parameters connected to the rotation process for data where (left) R ≤ 1.3 and (right) R> 1.3. Values that are not significant on a 95% level are not displayed. Color coding highlights the magnitude of correlation.

Similar articles

References

    1. Liddle J., Seyfried A., Steffen B., Klingsch W., Rupprecht T., Winkens A., Boltes M. Microscopic insights into pedestrian motion through a bottleneck, resolving spatial and temporal variations. Collect. Dyn. 2022;7:1–23. doi: 10.17815/CD.2022.139. - DOI
    1. Boltes M., Seyfried A. Collecting Pedestrian Trajectories. Neurocomputing Spec. Issue Behav. Video. 2013;100:127–133. doi: 10.1016/j.neucom.2012.01.036. - DOI
    1. Kretz T., Grünebohm A., Schreckenberg M. Experimental study of pedestrian flow through a bottleneck. J. Stat. Mech. Theory Exp. 2006;2006:P10014. doi: 10.1088/1742-5468/2006/10/P10014. - DOI
    1. Shi X., Ye Z., Shiwakoti N., Tang D., Lin J. Examining effect of architectural adjustment on pedestrian crowd flow at bottleneck. Phys. A Stat. Mech. Appl. 2019;522:350–364. doi: 10.1016/j.physa.2019.01.086. - DOI
    1. Yanagisawa D., Feliciani C., Nishinari K. Unidirectional and Bidirectional Flow in a Narrow Corridor with Body Rotation. Coll. Dyn. 2020;5:A37. doi: 10.17815/CD.2020.37. - DOI

LinkOut - more resources