. 2024 Mar 9;24(6):1768.
doi: 10.3390/s24061768.

Development and Testing of a Rocket-Based Sensor for Atmospheric Sensing Using an Unmanned Aerial System

Affiliations

Development and Testing of a Rocket-Based Sensor for Atmospheric Sensing Using an Unmanned Aerial System

Ryan Thalman. Sensors (Basel). .

Abstract

Measurements of the vertical structure of the lower atmosphere are important to the understanding of air quality. Unmanned Aerial Systems (UASs, drones) can provide low cost, repeatable measurements of the temperature, pressure, and relative humidity. A set of inexpensive sensors controlled with an Arduino microprocessor board were tested on a UAS against a meteorology grade sensor. Two modes of operation for sampling were tested: a forward moving sampler and a vertical ascent sampler. A small particle sensor (Sensiron SPS30) was integrated and was capable of retrieving vertical aerosol distributions during an inversion event. The thermocouple-based temperature probe and the relative humidity measurement on the Bosch BME280 sensor correlated well with the meteorological sensor. The temperature and relative humidity sensors were then deployed on a rocket sounding platform. The rocket sounding system performed well up to a height of 400 m. The inexpensive sensors were found to perform adequately for low-cost development and uses in education and research.

Keywords: UAS; atmospheric chemistry; atmospheric measurements; drone; rocketsonde; sonde measurements.


Conflict of interest statement

The author declares no conflicts of interest.

Figures

Figure 1
Figure 1
(a) DJI Phantom 3 Standard quadcopter with attached Arduino sensor. (b) Phantom 3 Standard flight path and altitude profile. (c) Arris M900 Quadcopter with attached meteorology sensors. (d) Side view showing the typical air movement around the drone during ascent.
Figure 2
Figure 2
(a) Map showing the locations of the test flights from 13 to 14 October 2023. (b) Side view showing the height of the flight path.
Figure 3
Figure 3
Retrieved altitude from the GPS and barometric sensors. Uncertainty in the GPS signal is given as ±6 m. The barometric sensor signals lead to better precision and less noise than the GPS.
Figure 4
Figure 4
Configuration and set up of the rocket as shown by (a) the rocket on the launch pad ready for launch, (b) BME 280 sensor exposed through payload housing, (c) thermocouple sensor protruding from rocket payload section exposed to outside air during flight.
Figure 5
Figure 5
Retrieved data from prototype flights including (a) binned temperature data including raw data showing both ascending and descending flight, (b) relative humidity, (c) temperature, and (d) pressure. The blue box highlights the section of the flight where the UAS is ascending from 1 March 2022.
Figure 6
Figure 6
Retrieved data from Flight #2 including (a) altitude, (b) pressure, (c) temperature, and (d) relative humidity. The black box highlights the section of the flight where the UAS is ascending.
Figure 7
Figure 7
Binned data from Flight #2 showing (a) temperature and (b) relative humidity. Error bars for temperature are variability from the average of the altitude bin. Error bars for RH show the absolute accuracy of the RH measurements ±5% RH.
Figure 8
Figure 8
Binned data from all flights for (a) temperature and (b) relative humidity. Error bars for temperature and relative humidity are variability from the average of each altitude bin.
Figure 9
Figure 9
Binned data from rocket tests for (A) afternoon flight with normal lapse rate and (B) a set of morning flights showing an inverted temperature profile. Error bars for temperature are ±0.25 °C.
Figure 10
Figure 10
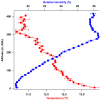
Binned data from rocket tests for 29 January 2024, showing the temperature and relative humidity, and sampled height of 400 m.
Figure 11
Figure 11
Particulate data from 12 December 2023 showing morning and afternoon flights.
Figure 12
Figure 12
Correlation of temperature data from all five sUAS flights between the IMET and rocket sensor with a slope of 0.90, an offset of 1.7, and an R2 of 0.98.
Figure 13
Figure 13
Correlation of temperature data from launches 1 and 2 from 15 December shown with a slope of 1.02, an offset of 0.2, and an R2 of 0.98.

Similar articles

Cited by

References

    1. Pope C.A., Dockery D.W. Health Effects of Fine Particulate Air Pollution: Lines that Connect. J. Air Waste Manag. Assoc. 2006;56:709–742. doi: 10.1080/10473289.2006.10464485. - DOI - PubMed
    1. Villalobos-Pietrini R., Hernández-Mena L., Amador-Muñoz O., Munive-Colín Z., Bravo-Cabrera J.L., Gómez-Arroyo S., Frías-Villegas A., Waliszewski S., Ramírez-Pulido J., Ortiz-Muñiz R. Biodirected mutagenic chemical assay of {PM10} extractable organic matter in Southwest Mexico City. Mutat. Res. Toxicol. Environ. Mutagen. 2007;634:192–204. doi: 10.1016/j.mrgentox.2007.07.004. - DOI - PubMed
    1. Lareau N.P., Crosman E., Whiteman C.D., Horel J.D., Hoch S.W., Brown W.O.J., Horst T.W. The Persistent Cold-Air Pool Study. Bull. Am. Meteorol. Soc. 2013;94:51–63. doi: 10.1175/BAMS-D-11-00255.1. - DOI
    1. Finlayson-Pitts B.J., Pitts J.N. Chapter 2—The Atmospheric System. In: Finlayson-Pitts B.J., Pitts J.N., editors. Chemistry of the Upper and Lower Atmosphere. Academic Press; San Diego, CA, USA: 2000. pp. 15–42. - DOI
    1. Mahrt L. Boundary Layer. In: Holton J.R., editor. Encyclopedia of Atmospheric Sciences. Academic Press; Oxford, UK: 2003. pp. 298–305. - DOI

LinkOut - more resources