

Utilizing Wearable Device Data for Syndromic Surveillance: A Fever Detection Approach
- PMID: 38544080
- PMCID: PMC10975930
- DOI: 10.3390/s24061818
Utilizing Wearable Device Data for Syndromic Surveillance: A Fever Detection Approach
Abstract
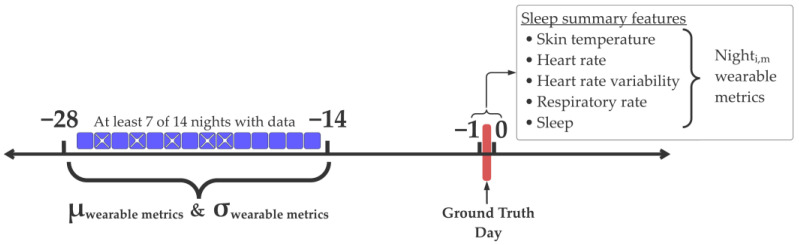
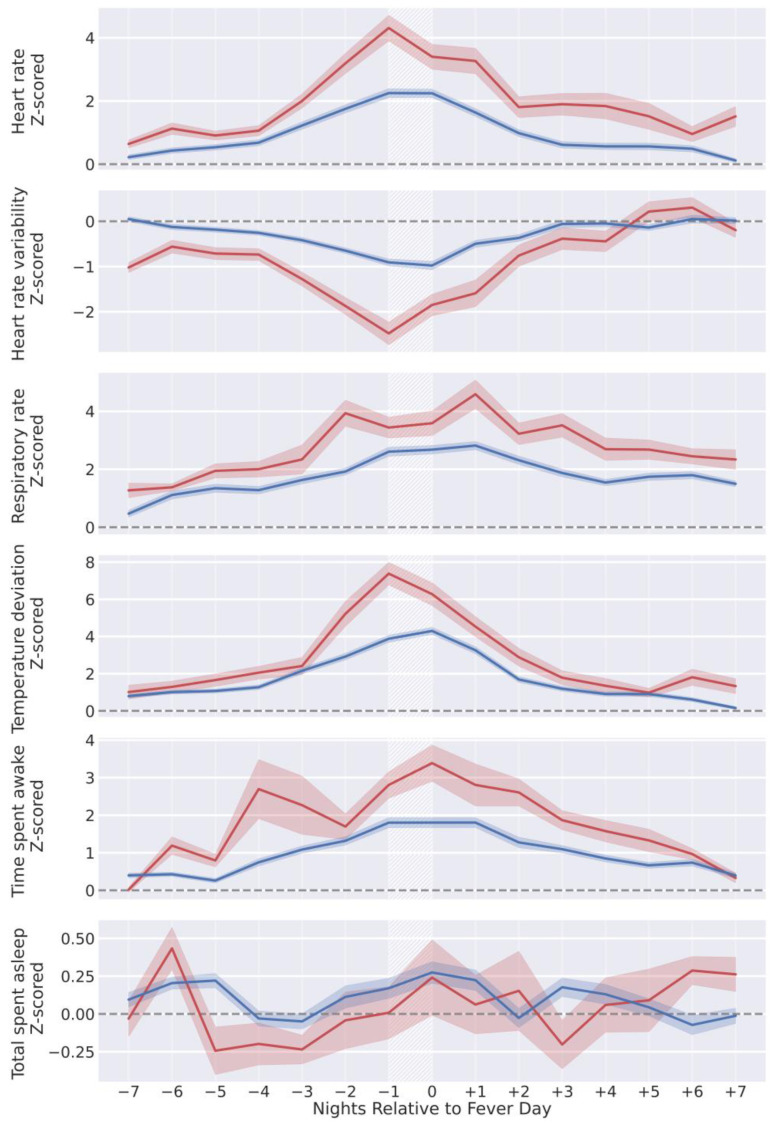
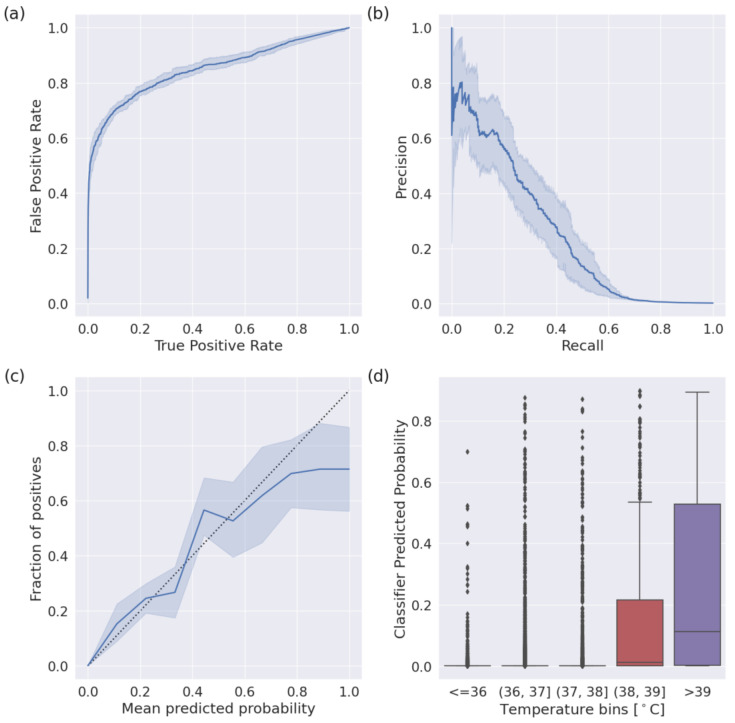
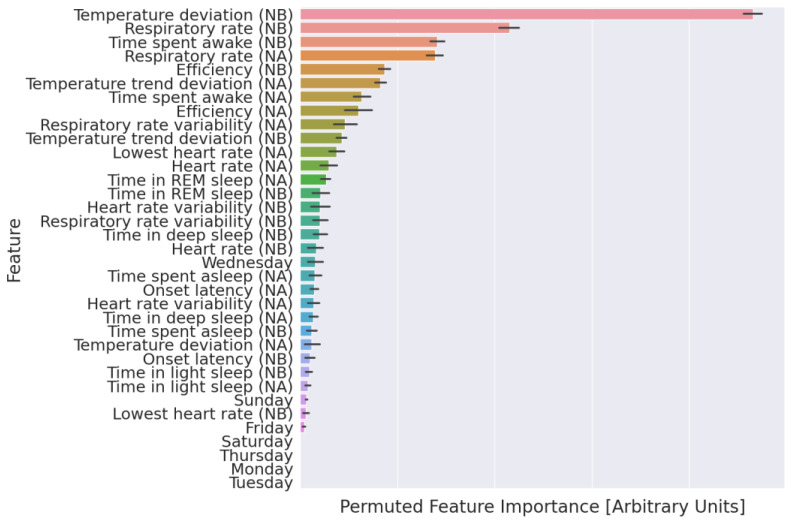
Commercially available wearable devices (wearables) show promise for continuous physiological monitoring. Previous works have demonstrated that wearables can be used to detect the onset of acute infectious diseases, particularly those characterized by fever. We aimed to evaluate whether these devices could be used for the more general task of syndromic surveillance. We obtained wearable device data (Oura Ring) from 63,153 participants. We constructed a dataset using participants' wearable device data and participants' responses to daily online questionnaires. We included days from the participants if they (1) completed the questionnaire, (2) reported not experiencing fever and reported a self-collected body temperature below 38 °C (negative class), or reported experiencing fever and reported a self-collected body temperature at or above 38 °C (positive class), and (3) wore the wearable device the nights before and after that day. We used wearable device data (i.e., skin temperature, heart rate, and sleep) from the nights before and after participants' fever day to train a tree-based classifier to detect self-reported fevers. We evaluated the performance of our model using a five-fold cross-validation scheme. Sixteen thousand, seven hundred, and ninety-four participants provided at least one valid ground truth day; there were a total of 724 fever days (positive class examples) from 463 participants and 342,430 non-fever days (negative class examples) from 16,687 participants. Our model exhibited an area under the receiver operating characteristic curve (AUROC) of 0.85 and an average precision (AP) of 0.25. At a sensitivity of 0.50, our calibrated model had a false positive rate of 0.8%. Our results suggest that it might be possible to leverage data from these devices at a public health level for live fever surveillance. Implementing these models could increase our ability to detect disease prevalence and spread in real-time during infectious disease outbreaks.
Keywords: illness detection; syndromic surveillance; wearables.
Conflict of interest statement
Patent applications US App. No. 17/357,922, US App. No. 17/357,930, and PCT App. No. PCT/US21/39260 were filed as of July 2021 by Oura Health Oy on behalf of UCSD. Authors A.E.M. and B.L.S. are listed as the co-inventors of these applications. A.E.M. received remuneration for consulting work from Oura Ring Inc. but declares no non-financial competing interests. B.L.S. received remuneration for consulting work from, and has a financial interest in, Oura Ring Inc. but declares no non-financial competing interests. All other authors declare no financial or non-financial competing interests.
Figures

Similar articles
-
Feasibility of continuous fever monitoring using wearable devices.Sci Rep. 2020 Dec 14;10(1):21640. doi: 10.1038/s41598-020-78355-6. Sci Rep. 2020. PMID: 33318528 Free PMC article.
-
A Novel Wearable Device for Continuous Temperature Monitoring & Fever Detection.IEEE J Transl Eng Health Med. 2021 Jul 19;9:2700407. doi: 10.1109/JTEHM.2021.3098127. eCollection 2021. IEEE J Transl Eng Health Med. 2021. PMID: 34765323 Free PMC article.
-
Detecting sleep using heart rate and motion data from multisensor consumer-grade wearables, relative to wrist actigraphy and polysomnography.Sleep. 2020 Jul 13;43(7):zsaa045. doi: 10.1093/sleep/zsaa045. Sleep. 2020. PMID: 32215550 Free PMC article.
-
Wearable Devices in Health Monitoring from the Environmental towards Multiple Domains: A Survey.Sensors (Basel). 2021 Mar 18;21(6):2130. doi: 10.3390/s21062130. Sensors (Basel). 2021. PMID: 33803745 Free PMC article. Review.
-
Continuous physiological monitoring using wearable technology to inform individual management of infectious diseases, public health and outbreak responses.Int J Infect Dis. 2020 Jul;96:648-654. doi: 10.1016/j.ijid.2020.05.086. Epub 2020 Jun 1. Int J Infect Dis. 2020. PMID: 32497806 Free PMC article. Review.
References
-
- Mandl K.D., Overhage J.M., Wagner M.M., Lober W.B., Sebastiani P., Mostashari F., Pavlin J.A., Gesteland P.H., Treadwell T., Koski E., et al. Implementing Syndromic Surveillance: A Practical Guide Informed by the Early Experience. J. Am. Med. Inform. Assoc. 2004;11:141–150. doi: 10.1197/jamia.M1356. - DOI - PMC - PubMed
-
- Smith G.E., Elliot A.J., Lake I., Edeghere O., Morbey R., Catchpole M., Heymann D.L., Hawker J., Ibbotson S., McCloskey B., et al. Syndromic Surveillance: Two Decades Experience of Sustainable Systems—Its People Not Just Data! Epidemiol. Infect. 2019;147:e101. doi: 10.1017/S0950268819000074. - DOI - PMC - PubMed
-
- Overview of Syndromic Surveillance What Is Syndromic Surveillance? [(accessed on 22 August 2023)]; Available online: https://www.cdc.gov/mmwr/preview/mmwrhtml/su5301a3.htm.
