. 2024 Mar;30(3):e14700.
doi: 10.1111/cns.14700.

Identifying of immune-associated genes for assessing the obesity-associated risk to the offspring in maternal obesity: A bioinformatics and machine learning

Affiliations

Identifying of immune-associated genes for assessing the obesity-associated risk to the offspring in maternal obesity: A bioinformatics and machine learning

Yanxing Shang et al. CNS Neurosci Ther. 2024 Mar.

Abstract

Background: Perinatal exposure to maternal obesity predisposes offspring to develop obesity later in life. Immune dysregulation in the hypothalamus, the brain center governing energy homeostasis, is pivotal in obesity development. This study aimed to identify key candidate genes associated with the risk of offspring obesity in maternal obesity.

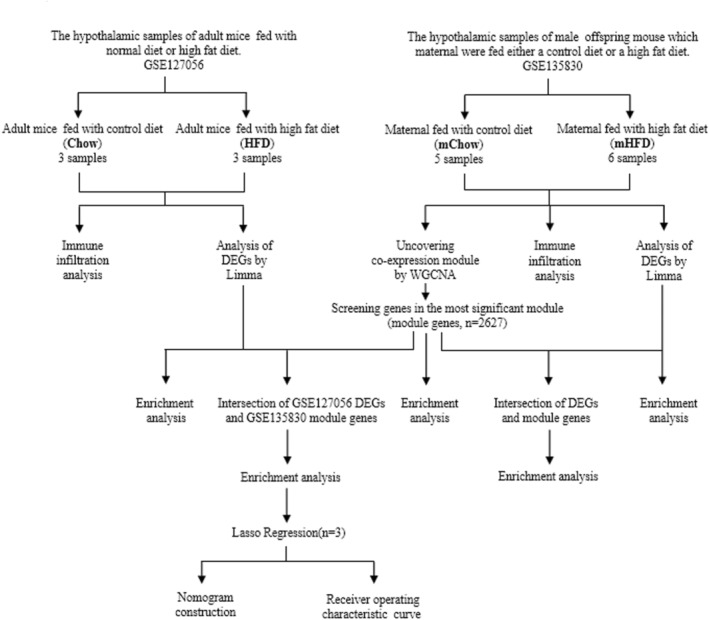
Methods: We obtained obesity-related datasets from the Gene Expression Omnibus (GEO) database. GSE135830 comprises gene expression data from the hypothalamus of mouse offspring in a maternal obesity model induced by a high-fat diet model (maternal high-fat diet (mHFD) group and maternal chow (mChow) group), while GSE127056 consists of hypothalamus microarray data from young adult mice with obesity (high-fat diet (HFD) and Chow groups). We identified differentially expressed genes (DEGs) and module genes using Limma and weighted gene co-expression network analysis (WGCNA), conducted functional enrichment analysis, and employed a machine learning algorithm (least absolute shrinkage and selection operator (LASSO) regression) to pinpoint candidate hub genes for diagnosing obesity-associated risk in offspring of maternal obesity. We constructed a nomogram receiver operating characteristic (ROC) curve to evaluate the diagnostic value. Additionally, we analyzed immune cell infiltration to investigate immune cell dysregulation in maternal obesity. Furthermore, we verified the expression of the candidate hub genes both in vivo and in vitro.

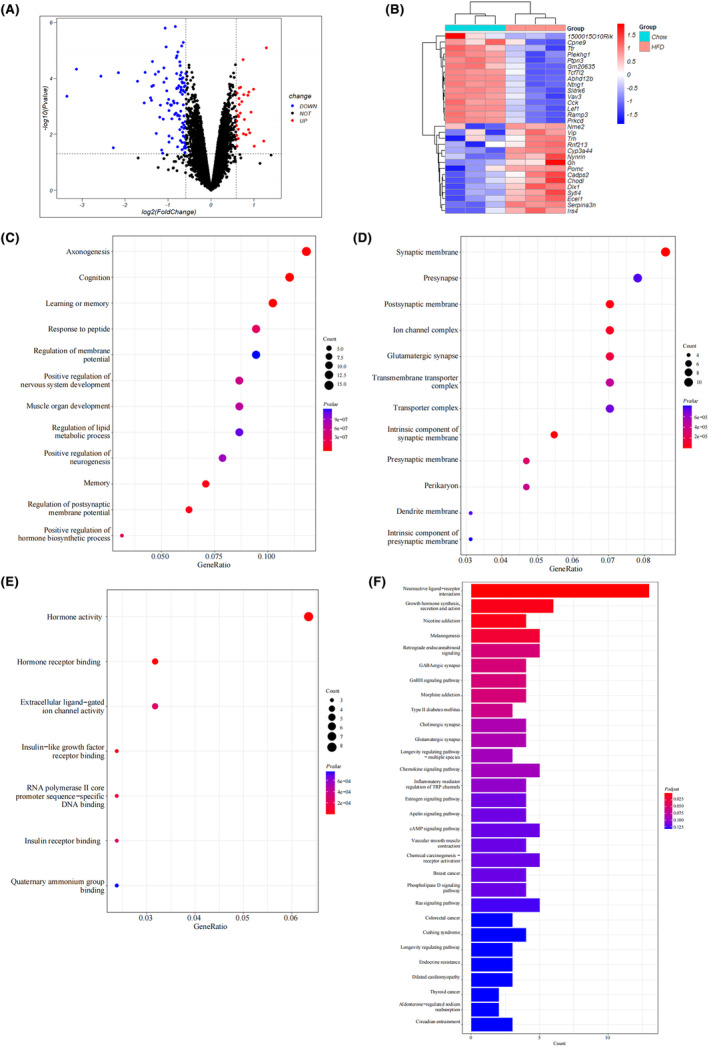
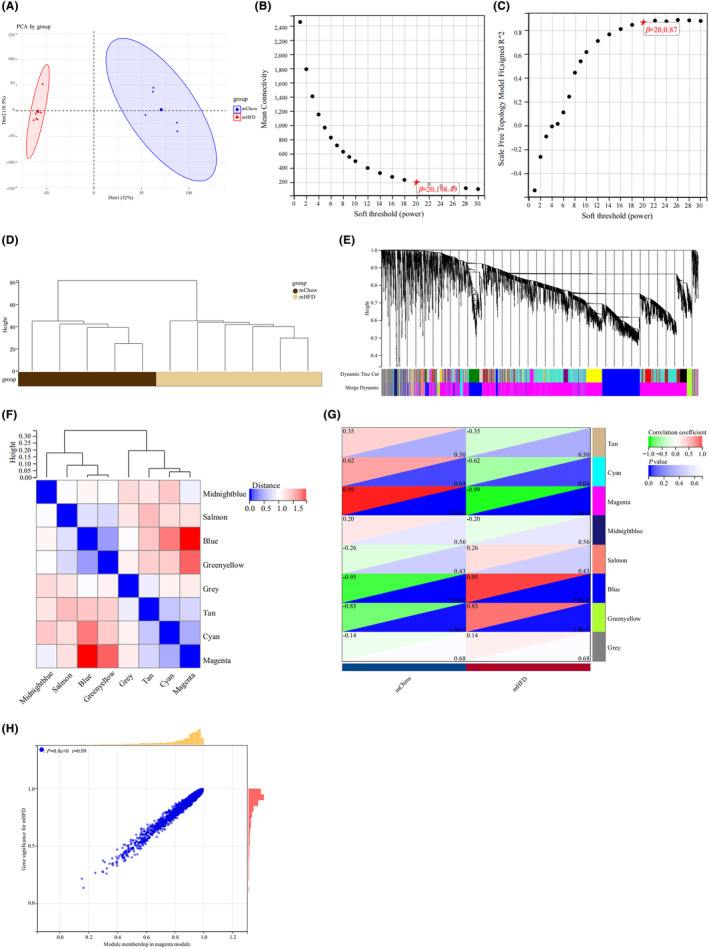
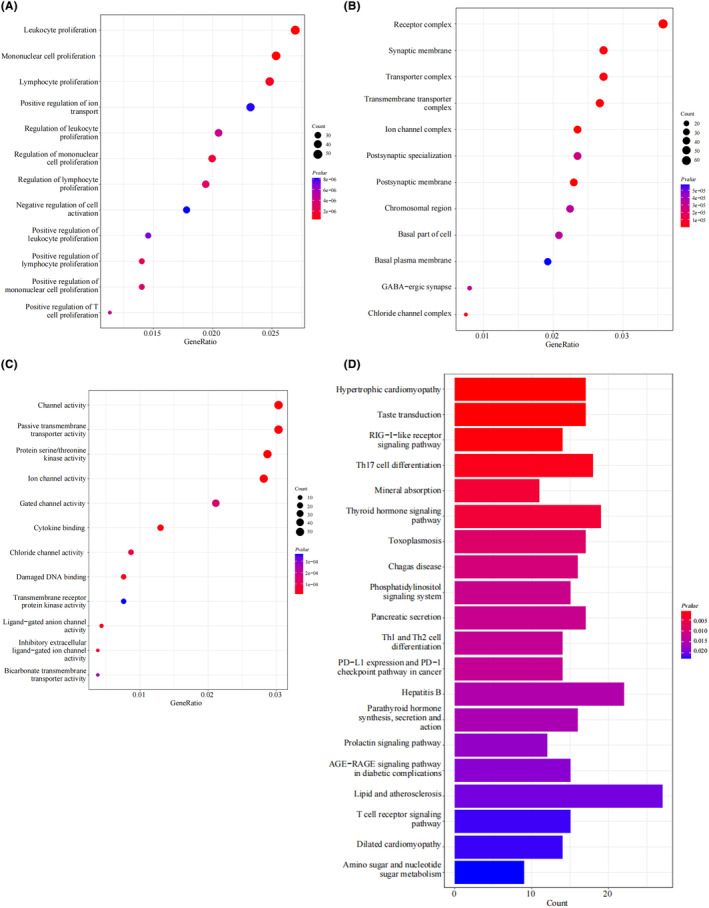
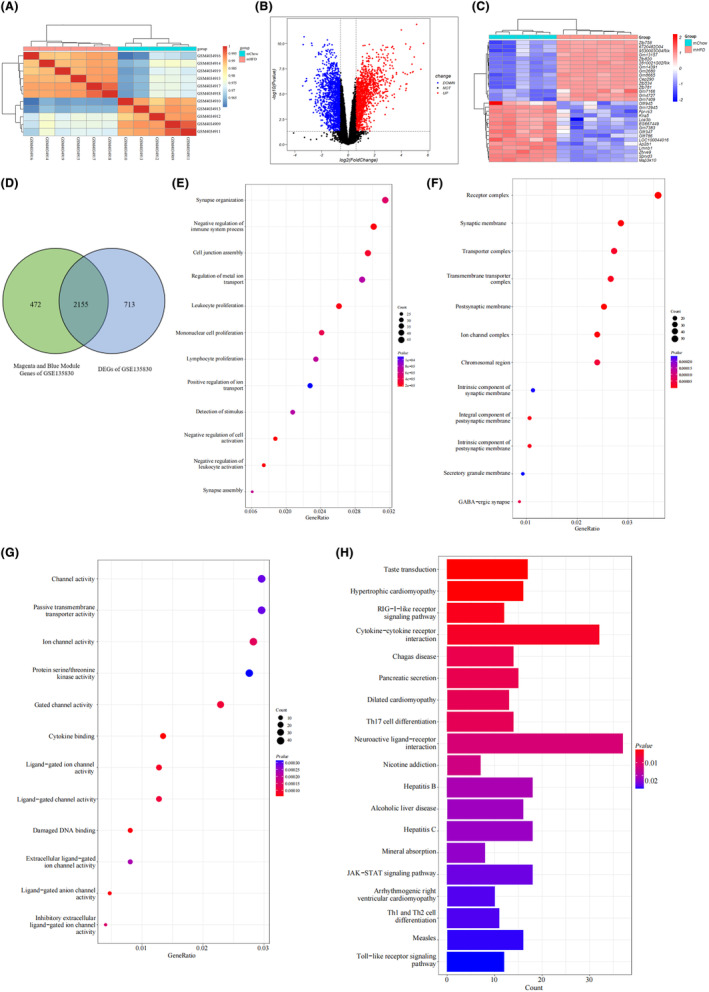
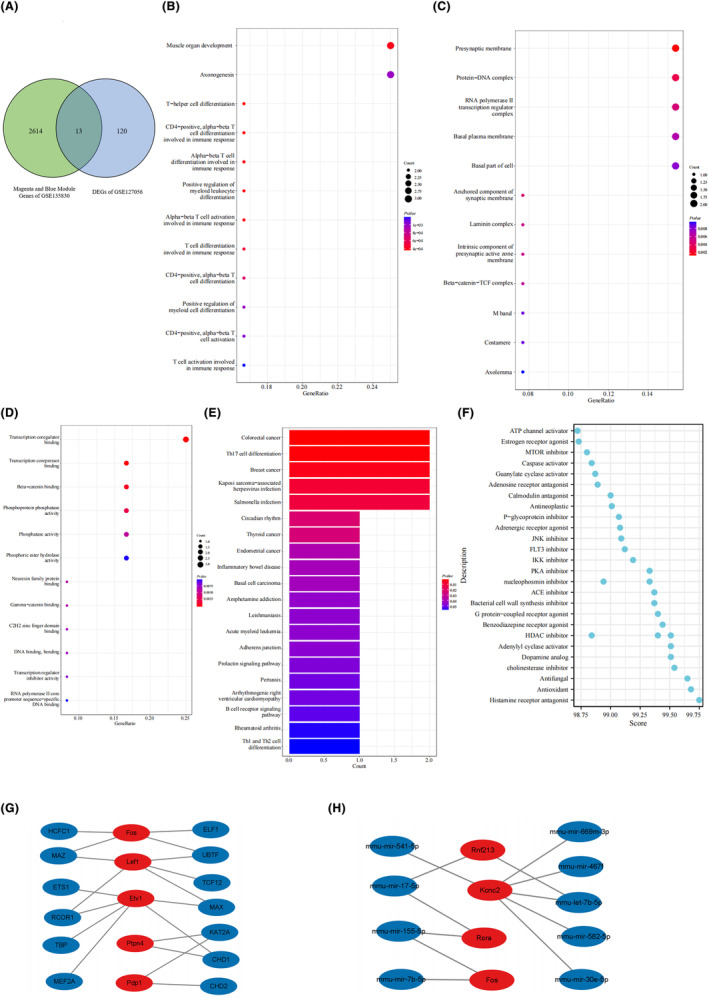
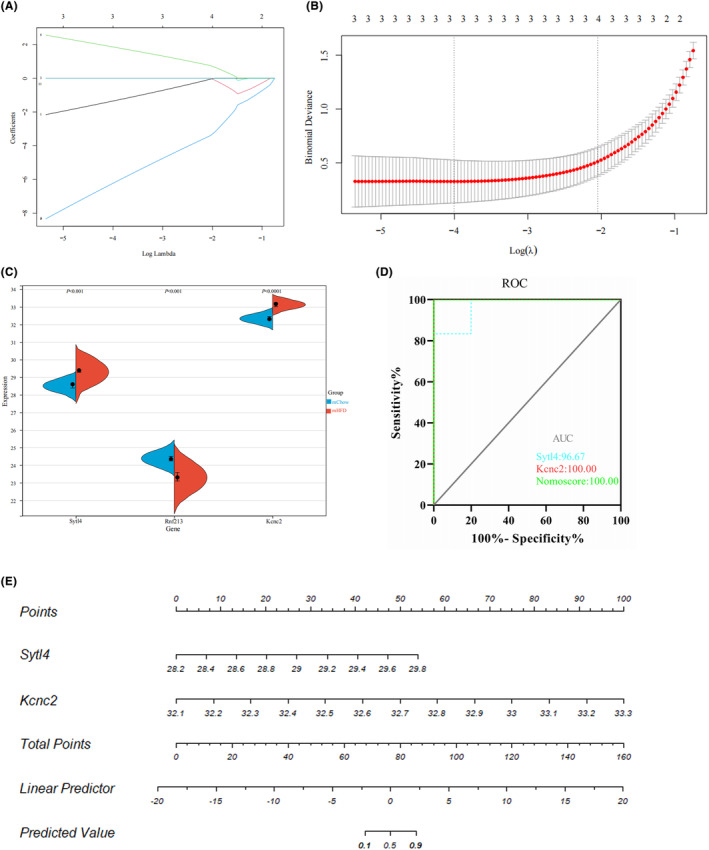
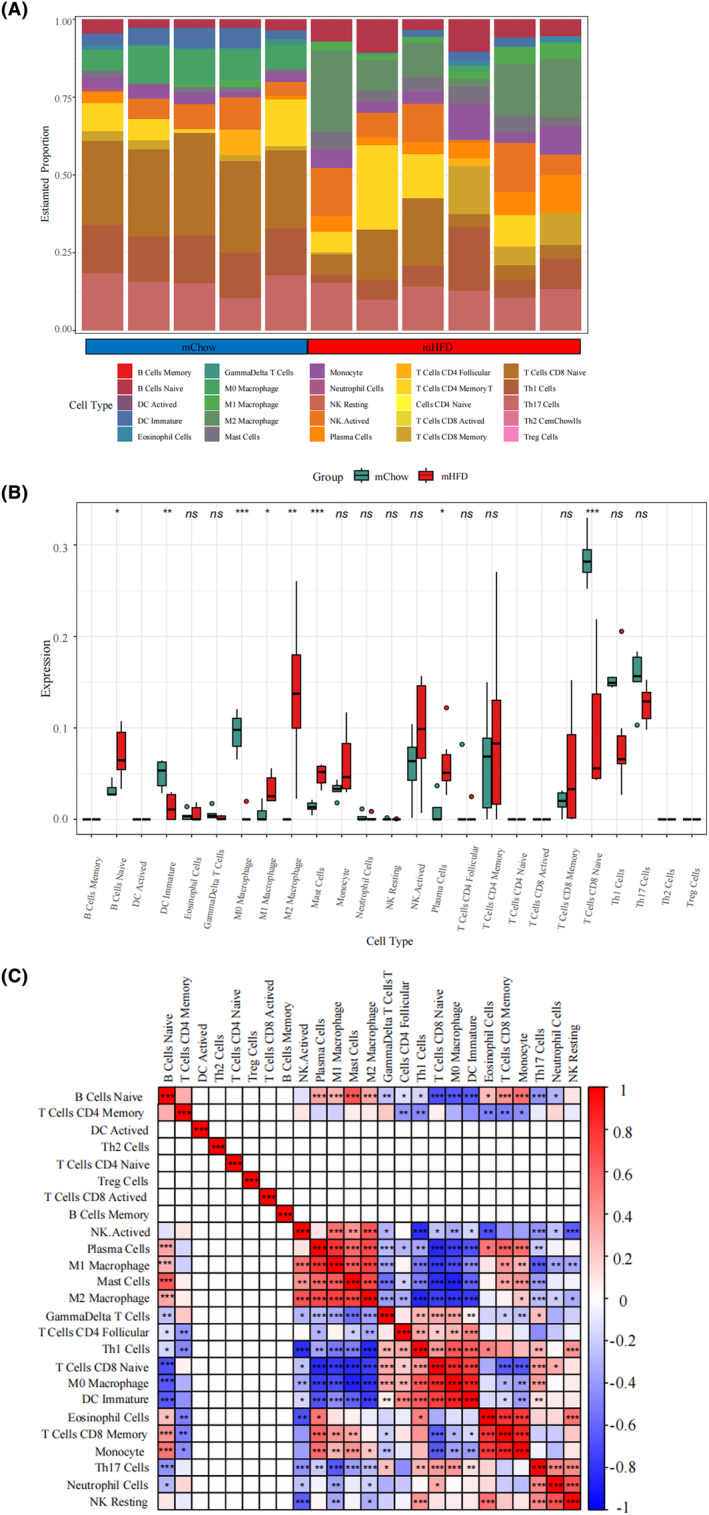
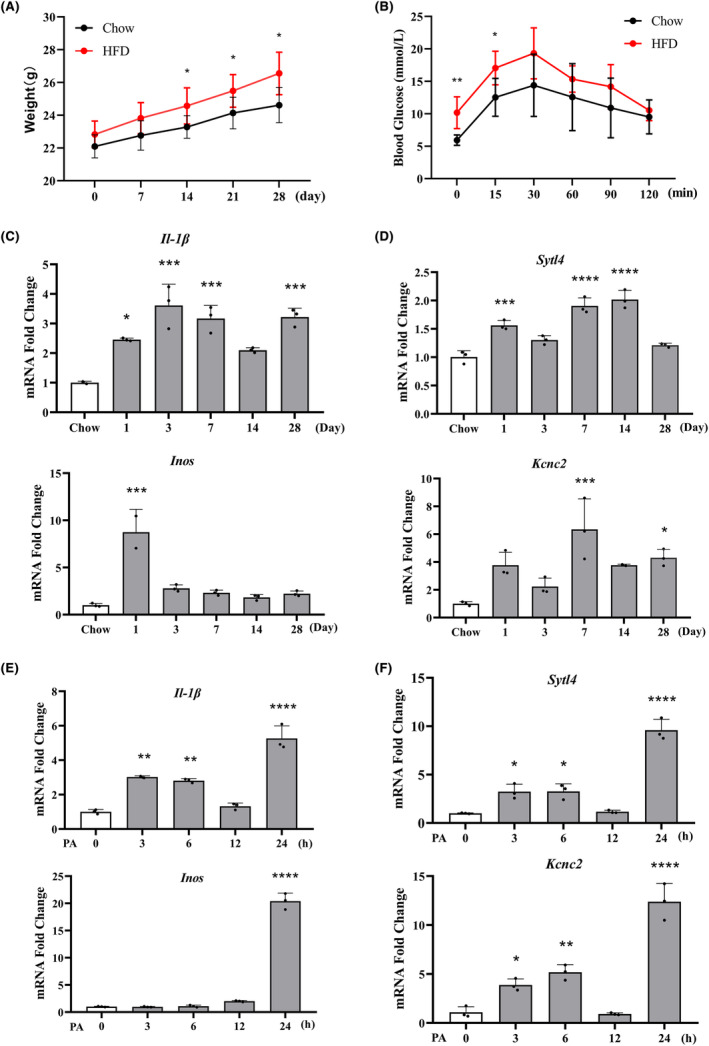
Results: The GSE135830 dataset revealed 2868 DEGs between the mHFD offspring and the mChow group and 2627 WGCNA module genes related to maternal obesity. The overlap of DEGs and module genes in the offspring with maternal obesity in GSE135830 primarily enriched in neurodevelopment and immune regulation. In the GSE127056 dataset, 133 DEGs were identified in the hypothalamus of HFD-induced adult obese individuals. A total of 13 genes intersected between the GSE127056 adult obesity DEGs and the GSE135830 maternal obesity module genes that were primarily enriched in neurodevelopment and the immune response. Following machine learning, two candidate hub genes were chosen for nomogram construction. Diagnostic value evaluation by ROC analysis determined Sytl4 and Kncn2 as hub genes for maternal obesity in the offspring. A gene regulatory network with transcription factor-miRNA interactions was established. Dysregulated immune cells were observed in the hypothalamus of offspring with maternal obesity. Expression of Sytl4 and Kncn2 was validated in a mouse model of hypothalamic inflammation and a palmitic acid-stimulated microglial inflammation model.

Conclusion: Two candidate hub genes (Sytl4 and Kcnc2) were identified and a nomogram was developed to predict obesity risk in offspring with maternal obesity. These findings offer potential diagnostic candidate genes for identifying obesity-associated risks in the offspring of obese mothers.

Keywords: bioinformatics analysis; biomarkers; differentially expressed genes; hypothalamus; obesity.


Conflict of interest statement

The authors declare that they have no conflict of interest.

Figures

FIGURE 1
FIGURE 1
Study flowchart. DEGs, differentially expressed genes; GSE, gene expression omnibus series; Limma, linea models for microarray data; ROC, receiver operating characteristic; WGCNA, weighted gene coexpression network analysis.
FIGURE 2
FIGURE 2
Identification and enrichment analysis of different expressed genes (DEGs) of the mouse hypothalamus between obesity and non‐obesity groups in GSE127056. (A) Volcano plot of DEGs. Red and blue dots represent DEGs with higher and lower expression levels in the mouse hypothalamus of the high‐fat diet (HFD) group compared with the Chow cases, respectively. (B) The heatmap shows the top 30 upregulated and downregulated DEGs, which are shown in red and blue colors, respectively. Each row shows the DEGs and each column refers to one of the samples of HFD cases or controls. (C–E) GO analysis of DEGs, including biological process (BP), cellular component (CC), and molecular function (MF). The y‐axis represents different GO terms, the x‐axis represents the gene ratio enriched in relative GO terms, the circle size refers to gene numbers, and the color represents the p value. (F) KEGG pathway analysis of DEGs. The y‐axis represents different signal pathway terms, the x‐axis represents the gene ratio enriched in relative KEGG terms, the bar length indicates gene numbers, and the color represents the p value.
FIGURE 3
FIGURE 3
Identification of module genes related to maternal obesity offspring. WGCNA was performed on GSE135830, a microarray database of mouse hypothalamus from offsprings of maternal obesity. “mHFD” refers to the offspring of maternal obesity group in which the mouse dams fed high‐fat diet and “mChow” refers to the control offspring group of dams fed the chow diet. (A) Principal components analysis (PCA) score plot illustrates the distinction between mHFD and mChow groups. (B, C) β = 20 was chosen as the soft threshold based on the scale independence and average connectivity. (D) Clustering dendrogram displays the grouping of the mHFD and control samples. (E) Different colors represent gene co‐expression under the gene tree. (F) Heatmap of eigengene adjacency. (G) Heatmap of the association between modules and maternal obesity (mHFD). The magenta and blue modules demonstrate a significant correlation with mHFD. The numbers in the top and bottom brackets indicate the correlation coefficient and p value, respectively. (H) Correlation plot depicts the relationship between module membership and gene significance of magenta module genes.
FIGURE 4
FIGURE 4
Functional enrichment analysis of WGCNA module genes related to maternal obesity offspring. (A–C) GO analysis of the 2627 genes in the magenta and blue modules selected by WGCNA on GSE135830, including biological process (BP), cellular component (CC) and molecular function (MF). (D) KEGG pathway analysis of the magenta and blue module genes.
FIGURE 5
FIGURE 5
Functional enrichment analysis of the intersection genes of WGCNA key modules and DEGs of maternal obesity in GSE135830. (A) Heatmap of samples. Cyan represents the hypothalamic samples of the mChow offspring and red represents the mHFD offspring. (B) Volcano plot of DEGs. Red and blue dots represent DEGs with upregulated and downregulated expression level in the hypothalamus of the mHFD versus mChow group, respectively. (C) Heatmap of the top 30 DEGs. Each row shows the DEGs and each column refers to one of the samples of mHFD offsprings or mChow controls. (D) Venn diagram of 2155 common genes which were identified from the intersection of DEGs and WGCNA key module genes of maternal obesity. (E–G) GO analysis of the common genes. (H) KEGG pathway analysis of the common genes.
FIGURE 6
FIGURE 6
Functional enrichment analysis of the common genes of the WGCNA module linked to maternal obesity offspring in GSE135830 and DEGs of adult obesity in GSE127056. (A) A Venn diagram demonstrates the identification of 13 common genes resulting from the intersection of DEGs from GSE127065 and WGCNA module genes from GSE135830. (B–D) GO analysis of the intersection genes, including biological process, cellular component and molecular function. (E) KEGG pathway analysis of the intersection genes. (F) The dot plot shows the predicted compounds that may act on the 13 common genes by clue.io. The y‐axis represents different compounds and the x‐axis represents the score of compounds. (G, H) Gene regulatory network with transcription factor–gene interactions and gene–miRNA interactions constructed using the Network Analyst online tool. The red dot represents the 13 common genes and the blue represents the predicted transcription factors and miRNAs.
FIGURE 7
FIGURE 7
Machine learning screening of candidate biomarkers for offspring obesity induced by maternal obesity. (A, B) Biomarker screening in the Lasso model. The number of genes (n = 3) corresponding to the lowest point of the curve is the most suitable for offspring obesity diagnosis. (C) Split violin plots of the three candidate biomarkers. Red represents the mHFD offspring and blue represents the mChow offspring. (D, E) The ROC curve of each candidate gene (Sytl4 and Kcnc2) and nomogram show a significant diagnostic value for offspring obesity.
FIGURE 8
FIGURE 8
Immune cell infiltration analysis between the mHFD offspring and mChow control groups. (A) Barblot showing the proportion of 25 immune cell types in different samples. (B) Boxplot showing the comparison regarding the proportions of 25 immune cell types between the mHFD offspring and mChow control groups. (C) Correlation of the compositions of 25 immune cell types. *p < 0.05, **p < 0.01, ***p < 0.001.
FIGURE 9
FIGURE 9
Validation of the hub gene expression in hypothalamic inflammation of obesity in vivo and in vitro. (A, B) The mice were fed with either a normal chow diet (Chow) or a high‐fat diet (HFD) for 28 days. Changes in body weight and glucose tolerance tests after 12‐h fasting. (C, D) The mRNA expression of proinflammatory markers (Il‐1β and Inos) and two hub genes (Sytl4 and Kcnc2) was analyzed by RT‐qPCR in the mouse hypothalamus, respectively. (E, F) Mouse microglial cell BV2 was treated with palmitic acid (PA, 200 μmol/L) and the mRNA expression of Il‐1β, Inos and the screened hub genes (Sytl4 and Kcnc2) was assessed using RT‐qPCR. Compared with the control group: *p < 0.05, **p < 0.01, ***p < 0.001, ****p < 0.0001.

Similar articles

Cited by

References

    1. Zhang J, Li S, Luo X, Zhang C. Emerging role of hypothalamus in the metabolic regulation in the offspring of maternal obesity. Front Nutr. 2023;10:1094616. - PMC - PubMed
    1. Basak S, Das RK, Banerjee A, Paul S, Pathak S, Duttaroy AK. Maternal obesity and gut microbiota are associated with fetal brain development. Nutrients. 2022;14(21):4515. - PMC - PubMed
    1. St‐Germain LE, Castellana B, Baltayeva J, Beristain AG. Maternal obesity and the uterine immune cell landscape: the shaping role of inflammation. Int J Mol Sci. 2020;21(11):3776. - PMC - PubMed
    1. Denizli M, Capitano ML, Kua KL. Maternal obesity and the impact of associated early‐life inflammation on long‐term health of offspring. Front Cell Infect Microbiol. 2022;12:940937. - PMC - PubMed
    1. Segovia SA, Vickers MH, Gray C, Reynolds CM. Maternal obesity, inflammation, and developmental programming. Biomed Res Int. 2014;2014:418975. - PMC - PubMed

Publication types

LinkOut - more resources