The chromosome-scale genome and population genomics reveal the adaptative evolution of Populus pruinosa to desertification environment
- PMID: 38544549
- PMCID: PMC10967694
- DOI: 10.1093/hr/uhae034
The chromosome-scale genome and population genomics reveal the adaptative evolution of Populus pruinosa to desertification environment
Abstract
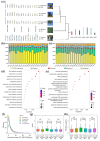
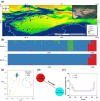
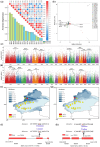
The Populus pruinosa is a relic plant that has managed to survive in extremely harsh desert environments. Owing to intensifying global warming and desertification, research into ecological adaptation and speciation of P. pruinosa has attracted considerable interest, but the lack of a chromosome-scale genome has limited adaptive evolution research. Here, a 521.09 Mb chromosome-level reference genome of P. pruinosa was reported. Genome evolution and comparative genomic analysis revealed that tandemly duplicated genes and expanded gene families in P. pruinosa contributed to adaptability to extreme desert environments (especially high salinity and drought). The long terminal repeat retrotransposons (LTR-RTs) inserted genes in the gene body region might drive the adaptive evolution of P. pruinosa and species differentiation in saline-alkali desert environments. We recovered genetic differentiation in the populations of the northern Tianshan Mountain and southern Tianshan Mountain through whole-genome resequencing of 156 P. pruinosa individuals from 25 populations in China. Further analyses revealed that precipitation drove the local adaptation of P. pruinosa populations via some genetic sites, such as MAG2-interacting protein 2 (MIP2) and SET domain protein 25 (SDG25). This study will provide broad implications for adaptative evolution and population studies by integrating internal genetic and external environmental factors in P. pruinosa.
© The Author(s) 2024. Published by Oxford University Press on behalf of Nanjing Agricultural University.
Conflict of interest statement
The authors declare no competing interests.
Figures


Similar articles
-
The draft genome sequence of a desert tree Populus pruinosa.Gigascience. 2017 Sep 1;6(9):1-7. doi: 10.1093/gigascience/gix075. Gigascience. 2017. PMID: 28938721 Free PMC article.
-
Phylogeography Reveals Geographic and Environmental Factors Driving Genetic Differentiation of Populus sect. Turanga in Northwest China.Front Plant Sci. 2021 Aug 11;12:705083. doi: 10.3389/fpls.2021.705083. eCollection 2021. Front Plant Sci. 2021. PMID: 34456946 Free PMC article.
-
Rapidly evolving genes and stress adaptation of two desert poplars, Populus euphratica and P. pruinosa.PLoS One. 2013 Jun 11;8(6):e66370. doi: 10.1371/journal.pone.0066370. Print 2013. PLoS One. 2013. PMID: 23776666 Free PMC article.
-
Complete chloroplast genome sequence of Populus pruinosa Schrenk from PacBio Sequel II Platform.Mitochondrial DNA B Resour. 2020 Sep 29;5(3):3452-3454. doi: 10.1080/23802359.2020.1824593. Mitochondrial DNA B Resour. 2020. PMID: 33458201 Free PMC article.
-
In-depth analysis of genomes and functional genomics of orchid using cutting-edge high-throughput sequencing.Front Plant Sci. 2022 Sep 23;13:1018029. doi: 10.3389/fpls.2022.1018029. eCollection 2022. Front Plant Sci. 2022. PMID: 36212315 Free PMC article. Review.
Cited by
-
Haplotype-resolved genome of Prunus zhengheensis provides insight into its evolution and low temperature adaptation in apricot.Hortic Res. 2024 Apr 8;11(4):uhae103. doi: 10.1093/hr/uhae103. eCollection 2024 Apr. Hortic Res. 2024. PMID: 38689698 Free PMC article.
-
Genome-Wide Identification of DNA Methyltransferase and Demethylase in Populus sect. Turanga and Their Potential Roles in Heteromorphic Leaf Development in Populus euphratica.Plants (Basel). 2025 Aug 1;14(15):2370. doi: 10.3390/plants14152370. Plants (Basel). 2025. PMID: 40805719 Free PMC article.
-
Comprehensive Identification of AREB Gene Family in Populus euphratica Oliv. and Functional Analysis of PeAREB04 in Drought Tolerance.Int J Mol Sci. 2025 Jan 9;26(2):518. doi: 10.3390/ijms26020518. Int J Mol Sci. 2025. PMID: 39859230 Free PMC article.
-
Pan-Genome-Based Characterization of the PYL Transcription Factor Family in Populus.Plants (Basel). 2025 Aug 15;14(16):2541. doi: 10.3390/plants14162541. Plants (Basel). 2025. PMID: 40872164 Free PMC article.
-
The Identification and Characterization of the PeGRF Gene Family in Populus euphratica Oliv. Heteromorphic Leaves Provide a Theoretical Basis for the Functional Study of PeGRF9.Int J Mol Sci. 2024 Dec 25;26(1):66. doi: 10.3390/ijms26010066. Int J Mol Sci. 2024. PMID: 39795925 Free PMC article.
References
-
- Bradshaw HD, Ceulemans R, Davis J. et al. . Emerging model systems in plant biology: poplar (Populus) as a model forest tree. J Plant Growth Regul. 2000;19:306–13
-
- Brunner AM, Busov VB, Strauss SH. Poplar genome sequence: functional genomics in an ecologically dominant plant species. Trends Plant Sci. 2004;9:49–56 - PubMed
-
- Dickmann DI, Kuzovkina J. In: Isebrands JG, Richardson J, eds. Poplars and Willows: Trees for Society and the Environment. Rome, Italy: CABI, 2014;15–6
-
- Stettler RF, Bradshaw HD Jr, Heilman PE. et al. . Biology of Populus and its Implications for Management and Conservation. Ottawa, Ontario, Canada: NRC Research Press, 1996;457–58
LinkOut - more resources
Full Text Sources
Miscellaneous

