

Editorial
doi: 10.21037/qims-24-164.
Epub 2024 Feb 20.
Potential diverse applications of diffusion-derived vessel density (DDVD) pixel-by-pixel mapping
Affiliations
- PMID: 38545048
- PMCID: PMC10963825
- DOI: 10.21037/qims-24-164
Item in Clipboard
Editorial
Potential diverse applications of diffusion-derived vessel density (DDVD) pixel-by-pixel mapping
Quant Imaging Med Surg.
.
No abstract available
Keywords: Diffusion-weighted imaging (DW imaging); diffusion-derived vessel density (DDVD); fibrosis; oncology; placenta accreta.
Conflict of interest statement
Conflicts of Interest: All authors have completed the ICMJE uniform disclosure form (available at https://qims.amegroups.com/article/view/10.21037/qims-24-164/coif). Y.X.J.W. serves as the Editor-in-Chief of Quantitative Imaging in Medicine and Surgery. Y.X.J.W. is the founder of Yingran Medicals Ltd., which develops medical image-based diagnostics software. The other authors have no conflicts of interest to declare.
Figures
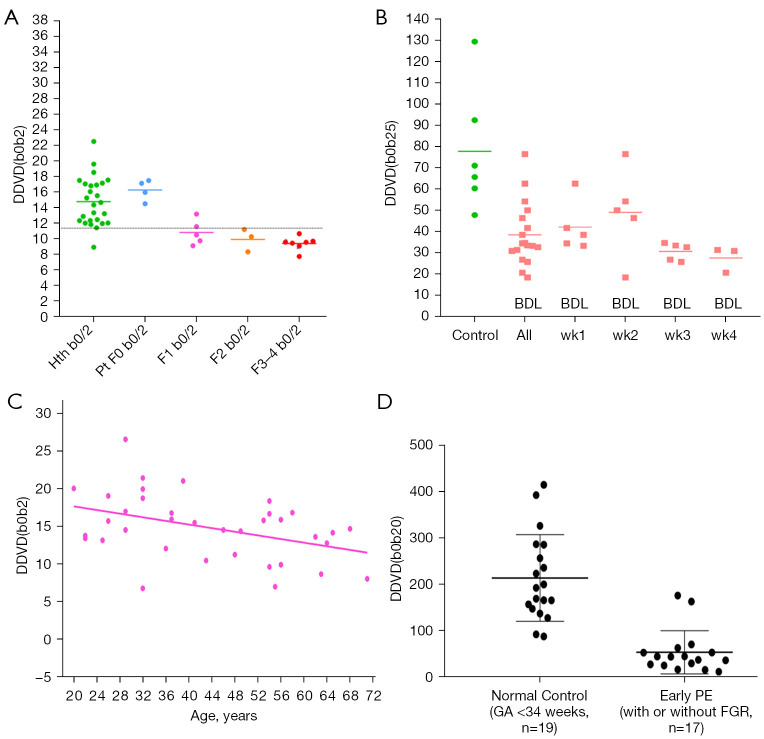
Examples of DDVD in tissue characterization. (A) Compared with healthy livers, lower DDVD value is noted for fibrotic livers (Hth b0/2: healthy volunteers. Pt F0 b0/2: patients with biopsy histology confirmed without liver fibrosis. F1, b0/2: cases of viral hepatitis type-B caused stage-1 liver fibrosis; F2, b0/2: cases of viral hepatitis type-B caused stage-2 liver fibrosis; F3-4, b0/2: cases of viral hepatitis type-B caused stage-3 and stage-4 liver fibrosis). DDVD(b0b2) is computed from b=0 and b=2 s/mm2 DW images. (B) Rat livers with BDL show lower DDVD than healthy control rat livers. All: all BDL rats. wk1: rats of 1 week after BDL. wk2: rats of 2 weeks after BDL. wk3: rats of 3 weeks after BDL. wk4: rats of 4 weeks after BDL. DDVD(b0b25) is computed from b=0 and b=25 s/mm2 DW images. (C) Aged-related liver perfusion reduction, as shown with DDVD, among healthy women. (D) Placenta with early PE show lower DDVD than normal control placenta. DDVD(b0b20) is computed from b=0 and b=20 s/mm2 DW images. (A-D) are reused with permission from the studies (2,3,5,6), respectively. DDVD, diffusion-derived vessel density; BDL, biliary duct ligation; GA, gestational age; PE, preeclampsia; FGR, fetal growth restriction; DW, diffusion weighted.
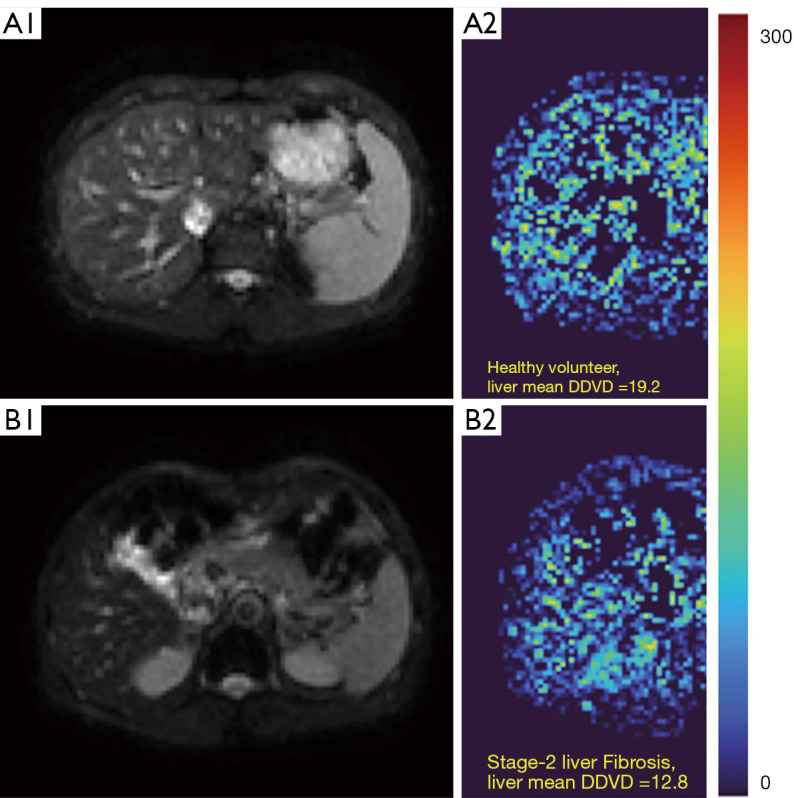
A case of normal liver (A) and a case of viral hepatitis type-B caused stage-2 liver fibrosis (B). DDVD map is computed from b=0 and b=2 s/mm2 DW images. The fibrotic liver shows lower DDVD signal, thus lower blood perfusion, than the case of normal liver. (A1 and B1) b=0 s/mm2 DW image. (A2 and B2) right liver DDVD map after the removal of vessel pixels [see description in the study (2)]. These two cases’ materials are from reference (2). DDVD, diffusion-derived vessel density; DW, diffusion weighted.
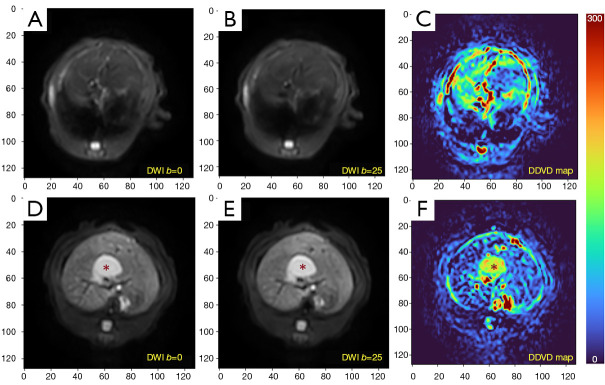
Liver DDVD maps of a control rat and a rat of 4 weeks after BDL. DW imaging included b=0 and b=25 s/mm2 images [(A-C) control rat; (D-F) BDL rat]. DDVD map is computed from b=0 and b=25 s/mm2 DW images. DDVD maps show higher liver parenchyma value for the control rat [(C) 58.2 arbitrary unit/pixel] than for the BDL rat [(F) 27.8 arbitrary unit/pixel]. Lower DDVD in the BDL rat liver is considered due to lower blood perfusion associated with liver fibrosis. A few artefacts are noted on DDVD map. In (C and F), the peripheral high signal rims around the liver are caused by misalignment between b=0 and b=25 s/mm2 images, which is likely caused by respiration motion. Dilated biliary duct (*) also shows high signal on (F). Dilated biliary duct is without blood perfusion. The dilated biliary duct’s falsely high DDVD value and also the CSF DDVD values are considered to be due to T2 effect. According to the initial definition of DDVD, the second b-value should be very low so to eliminate the T2 effect (1). For this rat study, since the second b-value was 25 s/mm2, then T2 effect is introduced for tissues/structures with long T2 leading to high value on DDVD map (see explanation in Figure 4). The rat materials are from reference (3). DWI, diffusion-weighted imaging; DDVD, diffusion-derived vessel density; BDL, biliary duct ligation; DW, diffusion weighted; CSF, cerebrospinal fluid.
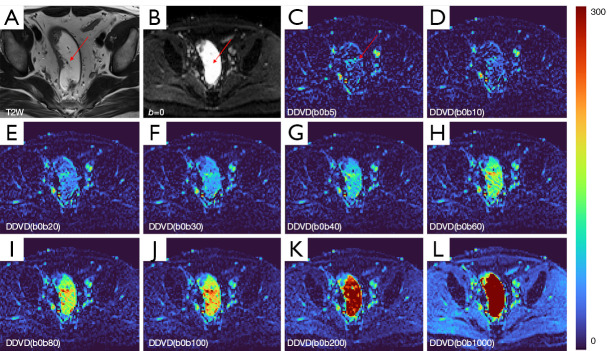
The impact of T2 relaxation time on DDVD map calculation. (A,B) T2 weighted image and b=0 s/mm2 DW image respectively, with the fluid in the sigmoid (arrow) showing high signal due to its long T2. DDVD(b0b5) map is computed from b=0 and b=5 s/mm2 DW images, and DDVD(b0b10) map is computed from b=0 and b=10 s/mm2 DW images. (C,D) DDVD(b0b5) and DDVD(b0b10) maps show the fluid in the sigmoid is low signal. (K,L) DDVD(b0b200) and DDVD(b0b1000) maps show the fluid in the sigmoid is very high signal due to its long T2. (E) DDVD(b0b20) map; (F) DDVD(b0b30) map; (G) DDVD(b0b40) map; (H) DDVD(b0b60) map; (I) DDVD(b0b80) map; (J) DDVD(b0b100) map. From DDVD(b0b20) to DDVD(b0b1000), the fluid in the sigmoid shows increasingly higher signal on DDVD map. Commonly, when the second b-value is less than 10 s/mm2, the T2 effect of a tissue or a substance is not apparent on DDVD map, while after second b-value is more than 10 s/mm2, the T2 effect of a tissue or a substance is visible on DDVD map. Therefore, we advocate the second b-value for DDVD calculation should be small (1). T2W, T2 weighted; DDVD, diffusion-derived vessel density; DW, diffusion weighted.
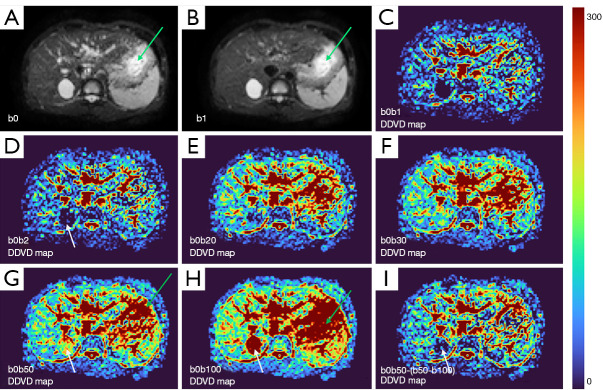
Appearance of a hepatic cyst (white arrow) on DDVD map. DDVD(b0b1) map (C) is computed from b=0 and b=1 s/mm2 DW images, and DDVD(b0b2) map (D) is computed from b=0 and b=2 s/mm2 DW images. On DDVD(b0b1) map and DDVD(b0b2) map, the hepatic cyst shows very low signal, consistent with that hepatic cyst has no perfusion. Due to the long T2 of hepatic cyst, hepatic cyst shows iso- signal to adjacent liver on DDVD(b0b30) map, higher signal compared with the adjacent liver on DDVD(b0b50) map and DDVD(b0b100) map. On the DDVD map (I) entitled ‘b0b50-(b50-b100)’, [i.e., (signal at b0 − signal at b50) − (signal at b50 − signal at b100), hereby ‘signal at b0’ refers to signal intensity on b=0 s/mm2 DW image], we aim to minimise the diffusion effect while maintaining the perfusion effect. We assume that, approximately diffusion effect (b0-b50) = diffusion effect (b50-b100), while perfusion effect (b0-b50) >> perfusion effect (b50-b100). Green arrow denotes the signal due to fluid in the stomach. As the images in this case were acquired with respiratory gating (rather than breath-holding), the alignment of images of varying b-values are not perfect. (A) b=0 s/mm2 DW image. (B) b=1 s/mm2 DW image. (E) DDVD(b0b20) map; (F) DDVD(b0b30) map; (G) DDVD(b0b50) map; (H) DDVD(b0b100) map. DDVD, diffusion-derived vessel density; DW, diffusion weighted.
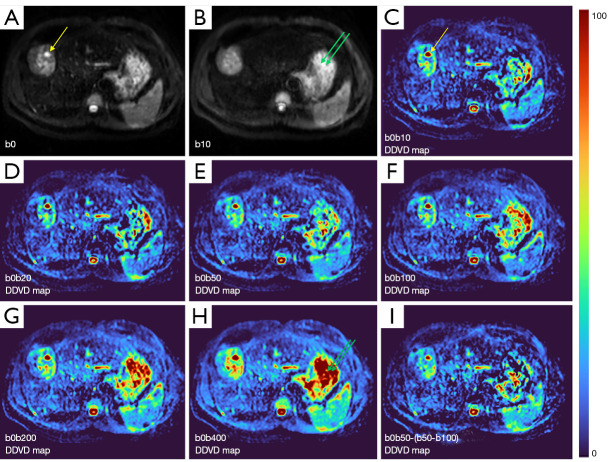
Appearance of a hepatocellular carcinoma on DDVD map. DDVD(b0b10) map (C) is computed from b=0 and b=10 s/mm2 DW images, and DDVD(b0b20) map (D) is computed from b=0 and b=20 s/mm2 DW images. On DDVD(b0b10) map, the hepatocellular carcinoma shows higher signal compared with the adjacent liver. The same as in Figure 5, on the DDVD map (I) entitled ‘b0b50-(b50-b100)’, [i.e., (signal at b0 − signal at b50) − (signal at b50 − signal at b100), hereby ‘signal at b0’ refers to signal intensity on b=0 s/mm2 DW image], we aim to minimise the diffusion effect while maintaining the perfusion effect. We assume that, approximately diffusion effect (b0-b50) = diffusion effect (b50-b100), while perfusion effect (b0-b50) >> perfusion effect (b50-b100). With Figure 5, the hepatic cyst shows low signal on DDVD map of ‘b0b50-(b50-b100)’. The hepatocellular carcinoma remains higher signal compared with the adjacent liver on DDVD map of ‘b0b50-(b50-b100)’ in this figure. The yellow arrow denotes a focus of necrotic change which was imaged on b=0 s/mm2 image while missed on b=10 s/mm2 image (of this slice), and this also cause an artefact on subsequent DDVD maps. As the images in this case were acquired with free-breathing, the alignment of images of varying b-values is not perfect. Green arrows denote the signal due to fluid in the stomach. (A) b=0 s/mm2 DW image. (B) b=10 s/mm2 DW image. (E) DDVD(b0b50) map; (F) DDVD(b0b100) map; (G) DDVD(b0b200) map. (H) DDVD(b0b400) map. DDVD, diffusion-derived vessel density; DW, diffusion weighted.
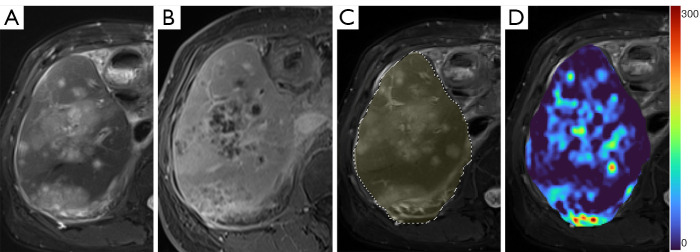
An example of DDVD map with liver region segmented and overlayed on b=0 s/mm2 DW image. This patient had cholangiocarcinoma with metastasis and was under treatment. DDVD map is computed from b=0 and b=10 s/mm2 images, showing multiple tumor sites with increased DDVD relative to the liver parenchyma and thus suggesting increased blood perfusion for the tumor nodules. (A) T2-weighted anatomical image; (B) gadolinium enhanced T1-weighted image; (C) b=0 s/mm2 DW image with liver region segmented by a ROI (dashed circle); (D) DDVD map of the liver region is overlayed on b=0 s/mm2 DW image. DDVD, diffusion-derived vessel density; DW, diffusion weighted; ROI, region-of-interest.
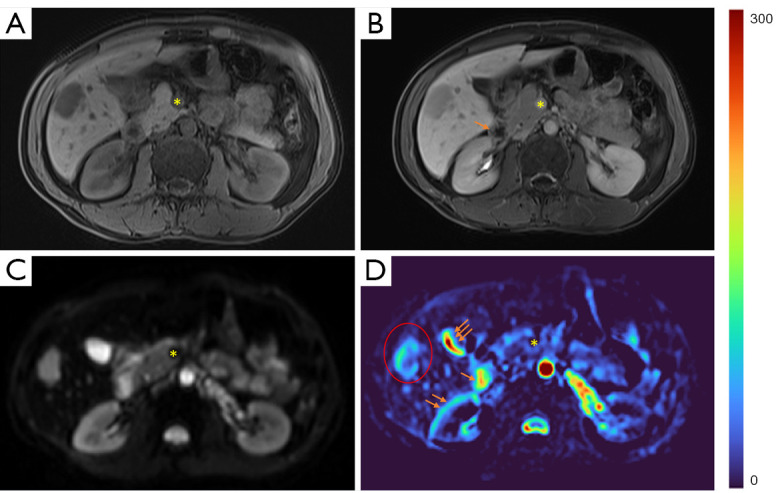
An example of liver DDVD map with a metastatic tumor from nasopharyngeal carcinoma. DDVD map is computed from b=0 and b=10 s/mm2 DW images. Tumor (red circle) appears higher perfusion relative to adjacent liver. (A) T1-weighted anatomical image; (B) gadolinium enhanced T1-weighted image; (C) b=0 s/mm2 DW image; (D) DDVD map. *, superior mesenteric artery shows flow-related signal void on DW image (C) and DDVD map (D). Single arrow denotes duodenum showing high signal on DDVD map which is caused by the fluid in the lumen and duodenum peristalsis during the DW imaging. This is a common artifact of gastrointestinal tract. Double arrows for right kidney border and triple arrows for gallbladder denote artifacts due to misalignment between b=0 and b=10 s/mm2 images. Note that right renal veins are well shown with high value on DDVD map. CSF commonly shows high value on DDVD map. DDVD, diffusion-derived vessel density; DW, diffusion weighted; CSF, cerebrospinal fluid.
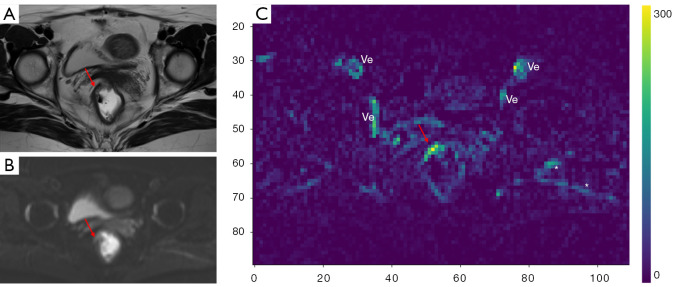
An example of DDVD map showing a hyper-vascular rectal carcinoma (arrow). DDVD map is computed from b=0 and b=5 s/mm2 DW images. (A) T2-weighted anatomical image; (B) b=0 s/mm2 DW image; (C) DDVD map. *, artefacts due to fatty fascia misalignment between b=0 and b=5 s/mm2 images. Ve, vessels; DDVD, diffusion-derived vessel density; DW, diffusion weighted.
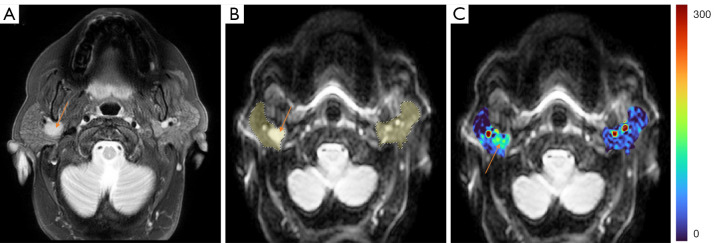
A case of right parotid gland malignant tumor (arrow) with bilateral parotid gland segmented and overlayed on b=0 s/mm2 DW image. DDVD map is computed from b=0 and b=20 s/mm2 images. Tumor appears higher perfusion relative to adjacent parotid gland tissue. Note that vessels near the parotid gland show very high signal on DDVD map. (A) T2-weighted anatomical image; (B) b=0 s/mm2 DW image with bilateral parotid glands and tumor segmented by ROIs (dashed circles); (C) DDVD maps of bilateral parotid glands and tumor are overlayed on b=0 s/mm2 DW image. DDVD, diffusion-derived vessel density; DW, diffusion weighted; ROI, region-of-interest.
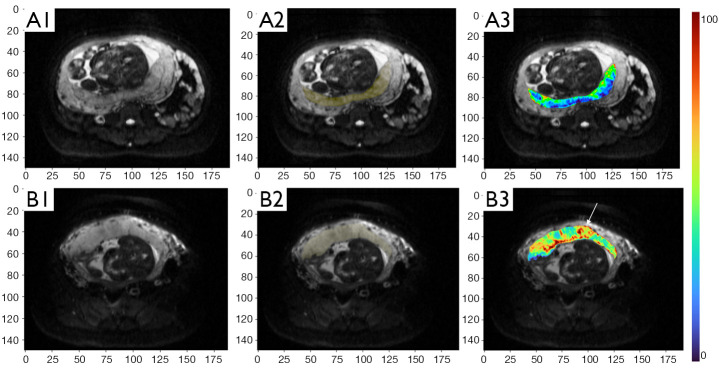
DDVD map, computed from b=0 and b=50 s/mm2 images, of placenta percreta demonstrates higher blood perfusion. (A) Normal placenta; (B) placenta percreta. (A1) is a b=0 s/mm2 DW image showing normal placenta. (A2) Placenta region in (A1) is segmented with a ROI. (A3) DDVD map of the placenta region is overlayed on b=0 s/mm2 DW image, with ROI based on (A2). (B1) is a b=0 s/mm2 DW image with placenta percreta. (B2) Placenta region in (B1) is segmented with a ROI. (B3) DDVD color map of the placenta region is overlayed on b=0 s/mm2 DW image, with ROI based on (B2). Compared the case in (A3), the placenta in (B3) shows both general and focal (arrow) increased DDVD signal. DDVD, diffusion-derived vessel density; DW, diffusion weighted; ROI, region-of-interest.
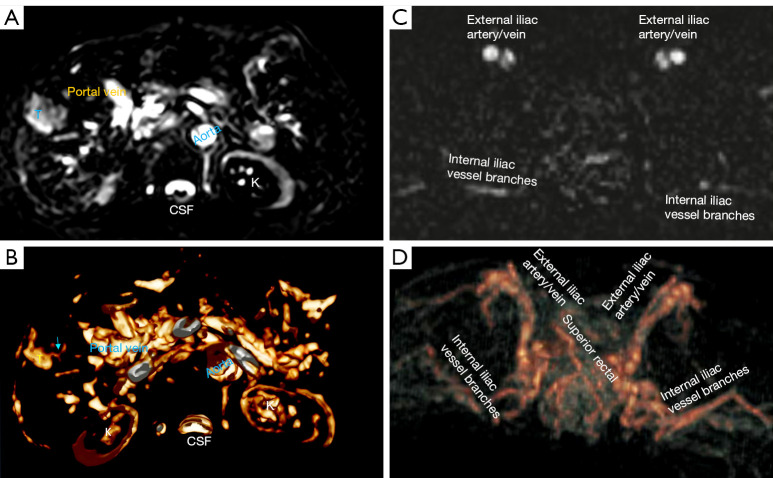
3D surface-rendering of DDVD map. (A) A DDVD map showing a hepatocellular carcinoma (T). DDVD map is computed from b=0 and b=2 s/mm2 DW images. The filling defect in aorta is likely an artefact. The voxel size of the original DW imaging for (A) is 0.76×0.76×7 mm3. (B) 3D surface-rendering of DDVD maps at the level of the hepatocellular carcinoma (T). Arrow in (B) denotes a vessel, possibly a vein. The visualization of mesenteric vessels in this image is contaminated by signal from bowels. (C) A DDVD map at the pelvis level. DDVD map is computed from b=0 and b=5 s/mm2 DW images. The voxel size of the original DW imaging for (C) is 2.73×2.73×6.0 mm3. (D) 3D surface-rendering of DDVD maps of the pelvis. This approach described here can in theory be used for angiography. The patient in (C,D) was scanned with the rectum extended with fluid. CSF, cerebrospinal fluid; K, kidney; 3D, three-dimensional; DDVD, diffusion-derived vessel density; DW, diffusion weighted.
References
-
- Hu GW, Zheng CJ, Zhong WX, Zhuang DP, Xiao BH, Wáng YXJ. Usefulness of diffusion derived vessel density computed from a simplified IVIM imaging protocol: An experimental study with rat biliary duct blockage induced liver fibrosis. Magn Reson Imaging 2021;84:115-23. 10.1016/j.mri.2021.09.013 - DOI - PubMed
Publication types
LinkOut - more resources
Full Text Sources