

Immune cell expression patterns of CD39/CD73 ectonucleotidases in rodent models of cardiac arrest and resuscitation
- PMID: 38545102
- PMCID: PMC10967020
- DOI: 10.3389/fimmu.2024.1362858
Immune cell expression patterns of CD39/CD73 ectonucleotidases in rodent models of cardiac arrest and resuscitation
Abstract
Background: Cardiac arrest (CA) is a significant public health concern. There is the high imminent mortality and survival in those who are resuscitated is substantively compromised by the post-CA syndrome (PCAS), characterized by multiorgan ischemia-reperfusion injury (IRI). The inflammatory response in PCAS is complex and involves various immune cell types, including lymphocytes and myeloid cells that have been shown to exacerbate organ IRI, such as myocardial infarction. Purinergic signaling, as regulated by CD39 and CD73, has emerged as centrally important in the context of organ-specific IRI. Hence, comprehensive understanding of such purinergic responses may be likewise imperative for improving outcomes in PCAS.
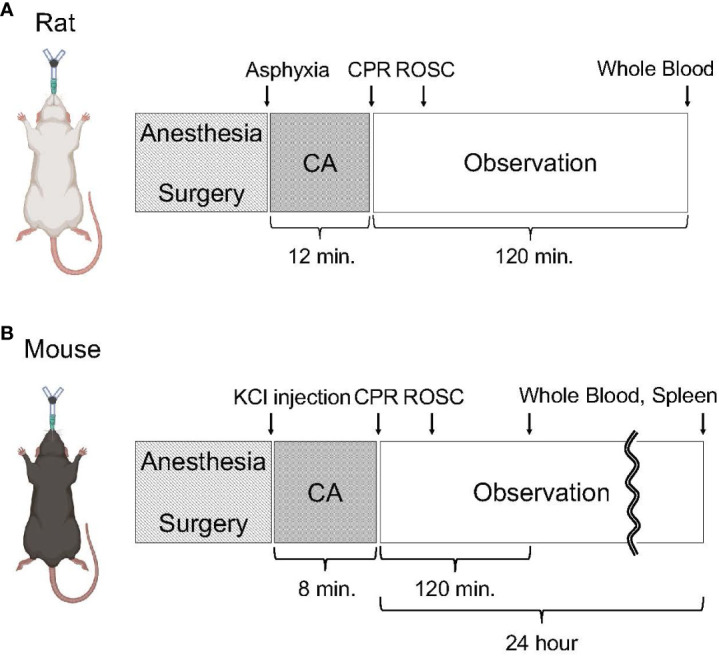
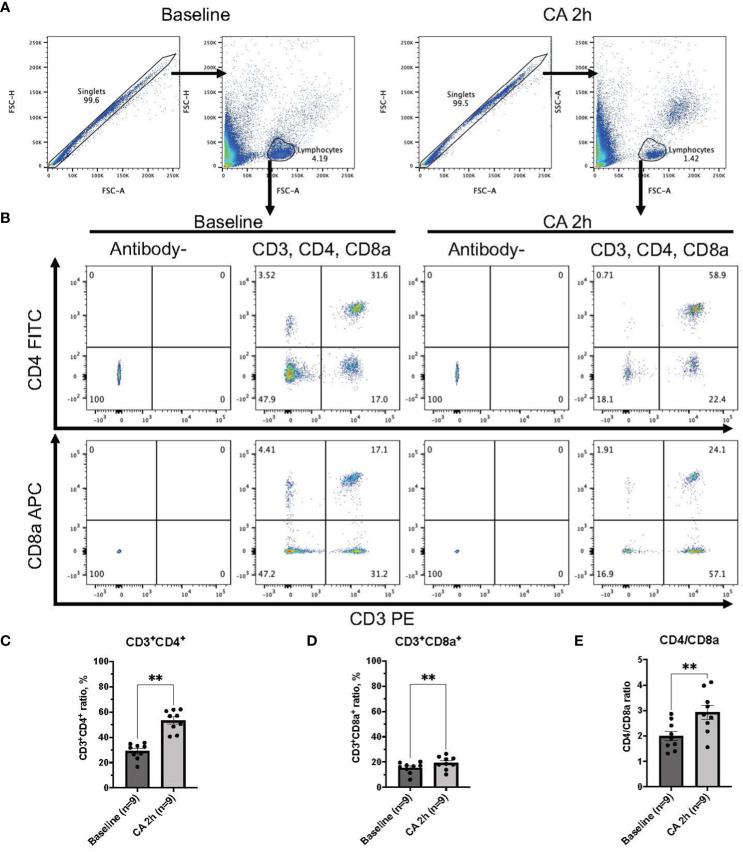
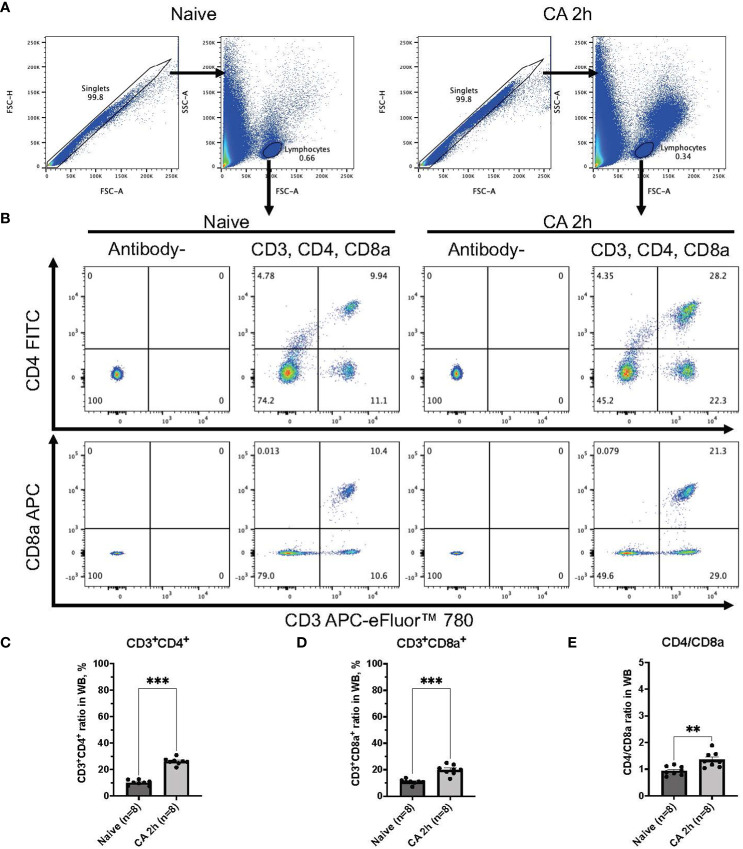
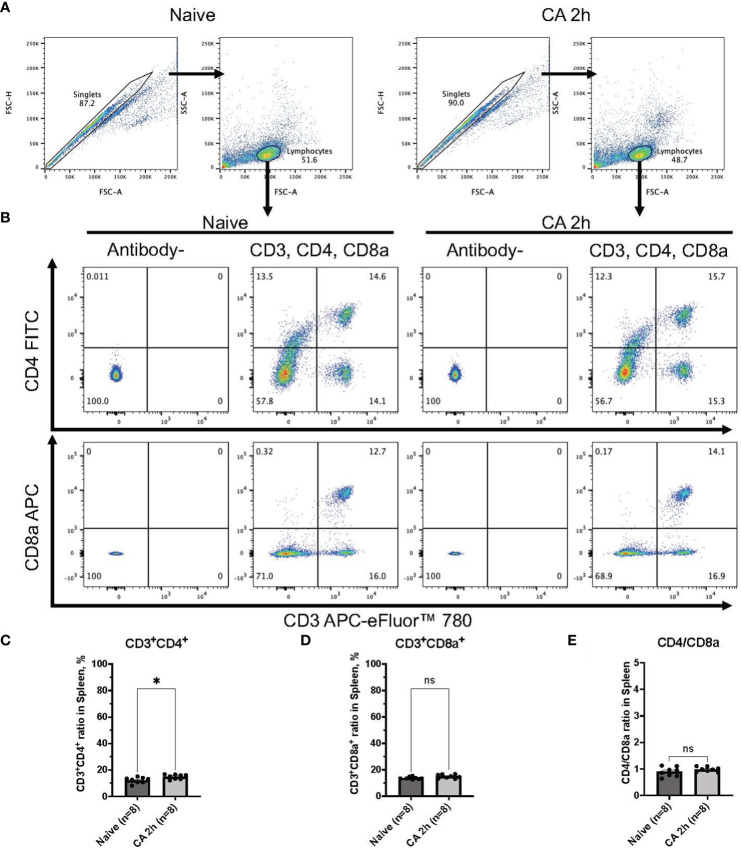
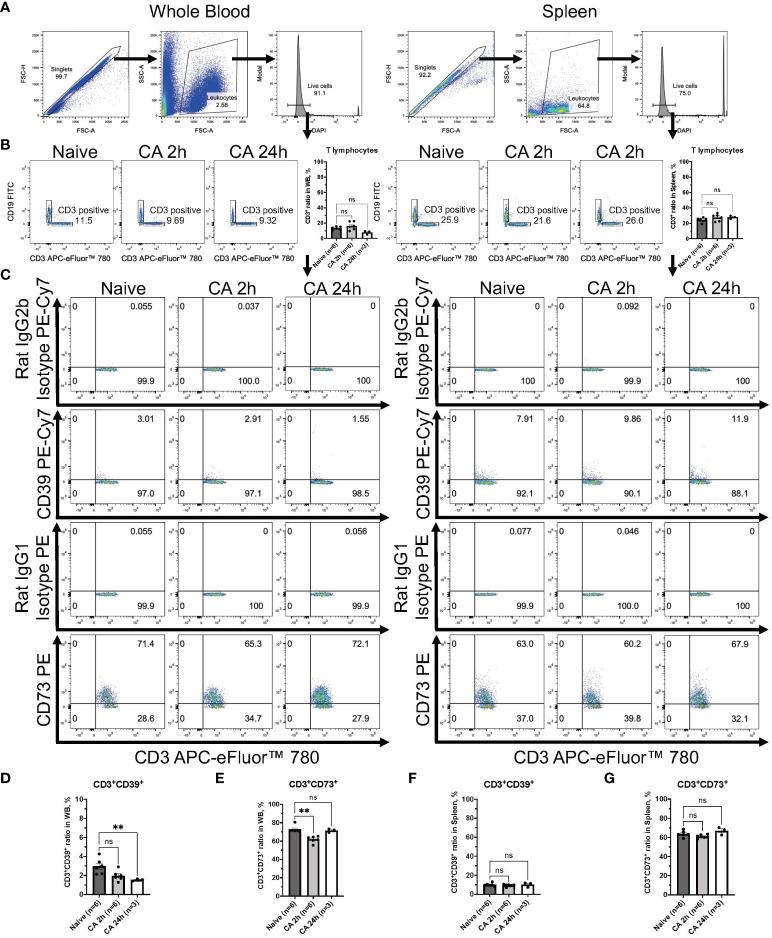
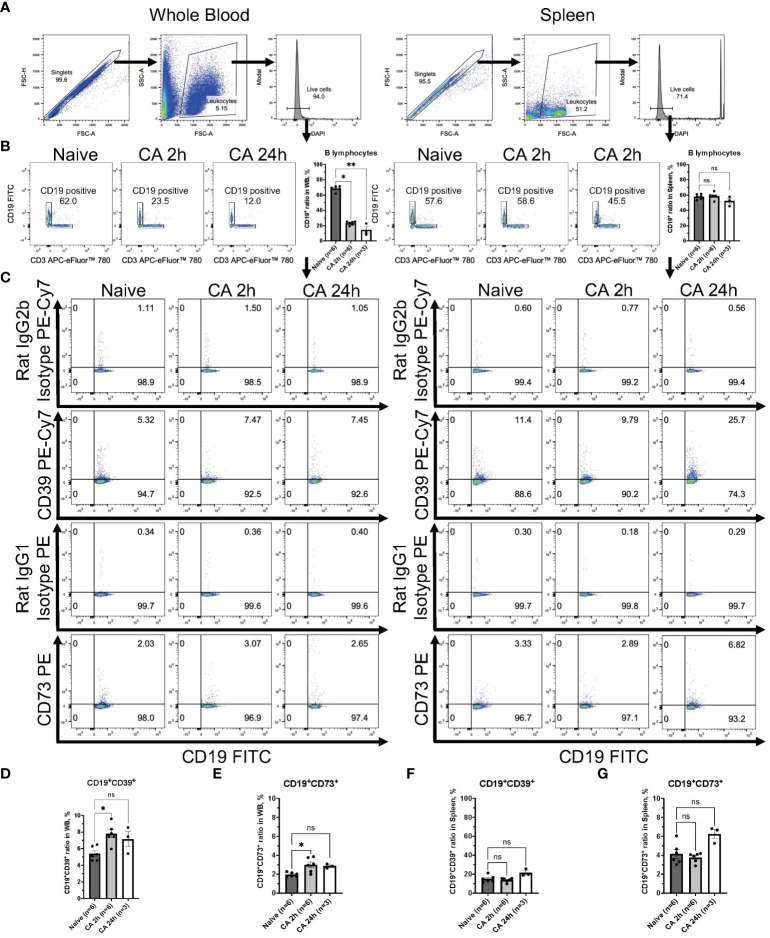
Methods: We have investigated alterations of immune cell populations after CA by utilizing rodent models of PCAS. Blood and spleen were collected after CA and resuscitation and underwent flow cytometry analysis to evaluate shifts in CD3+CD4+ helper T cells, CD3+CD8a+ cytotoxic T cells, and CD4/CD8a ratios. We then examined the expression of CD39 and CD73 across diverse cell types, including myeloid cells, T lymphocytes, and B lymphocytes.
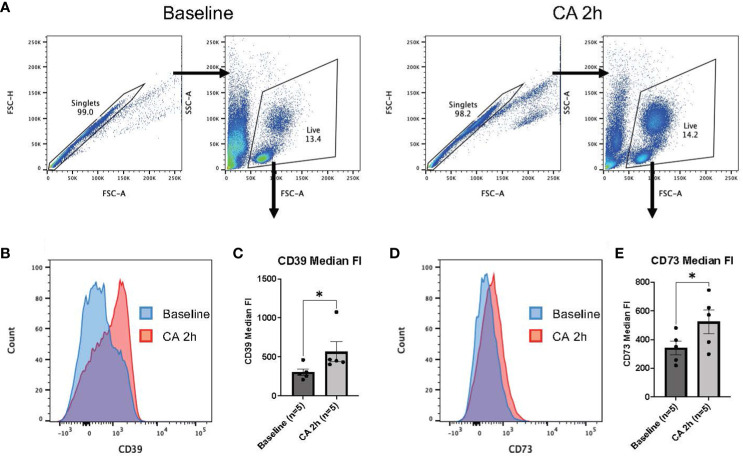
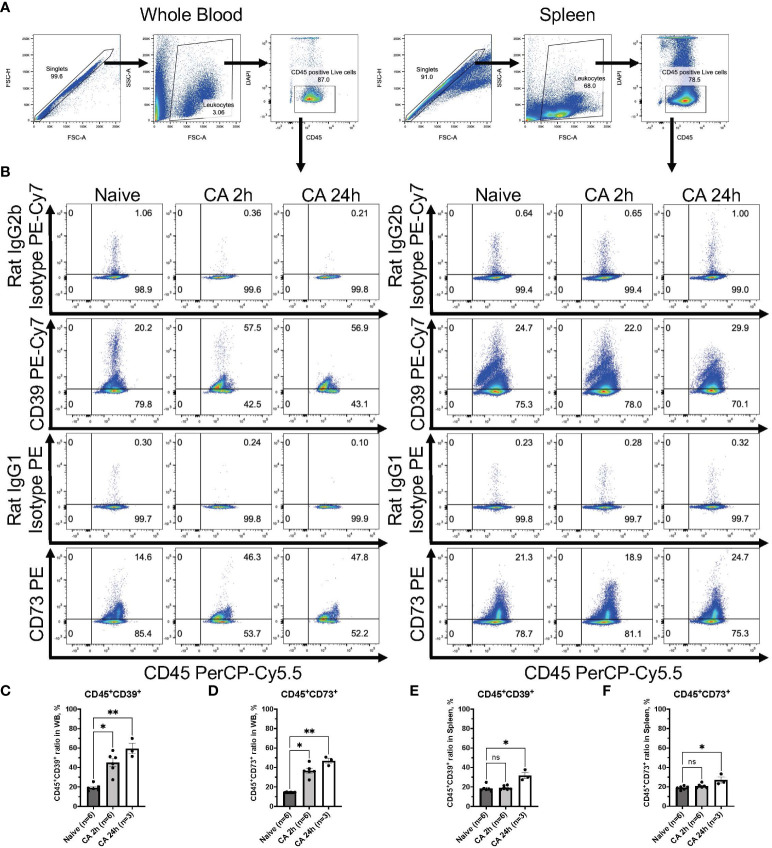
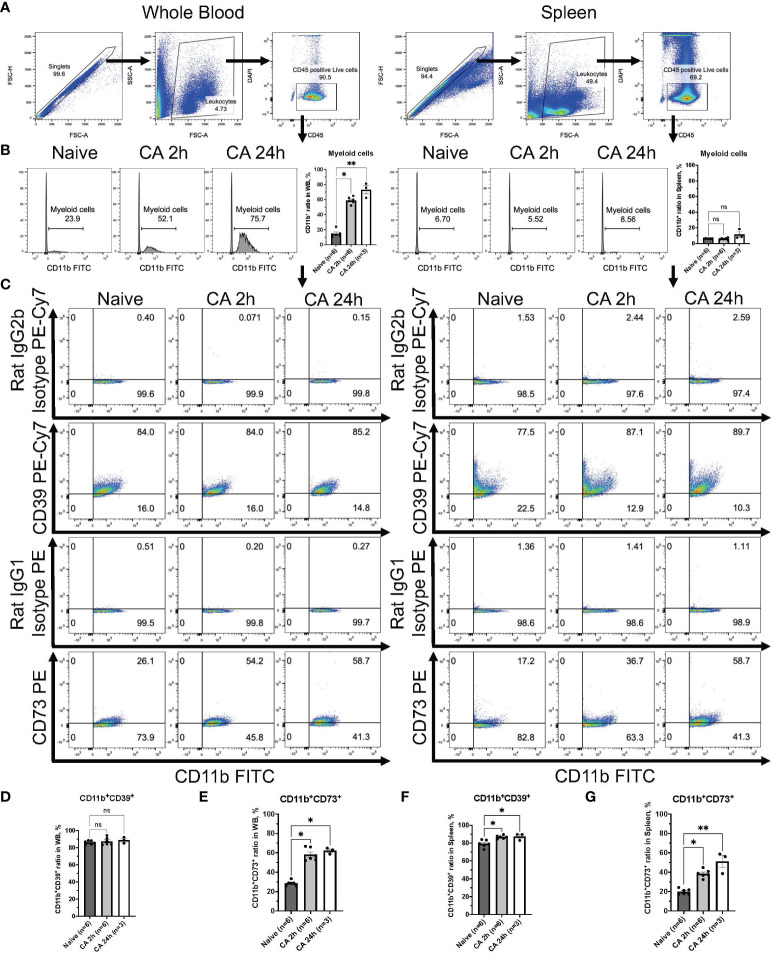
Results: In both rat and mouse models, there were significant increases in the frequency of CD3+CD4+ T lymphocytes in PCAS (rat, P < 0.01; mouse, P < 0.001), with consequently elevated CD4/CD8a ratios in whole blood (both, P < 0.001). Moreover, CD39 and CD73 expression on blood leukocytes were markedly increased (rat, P < 0.05; mouse, P < 0.01 at 24h). Further analysis in the experimental mouse model revealed that CD11b+ myeloid cells, with significant increase in their population (P < 0.01), had high level of CD39 (88.80 ± 2.05 %) and increased expression of CD73 (P < 0.05). CD19+ B lymphocytes showed slight increases of CD39 (P < 0.05 at 2h) and CD73 (P < 0.05 at 2h), while, CD3+ T lymphocytes had decreased levels of them. These findings suggested a distinct patterns of expression of CD39 and CD73 in these specific immune cell populations after CA.
Conclusions: These data have provided comprehensive insights into the immune response after CA, highlighting high-level expressions of CD39 and CD73 in myeloid cells.
Keywords: B cells; T cells; cardiopulmonary resuscitation; heart arrest; ischemia; monocytes; reperfusion injury; rodent.
Copyright © 2024 Aoki, Wong, Yin, Nakamura, Endo, Hayashida, Robson, Nandurkar, Diamond, Kim, Murao, Wang, Becker and Shinozaki.
Conflict of interest statement
The authors declare that the research was conducted in the absence of any commercial or financial relationships that could be construed as a potential conflict of interest.
Figures
Similar articles
-
Resident cardiac immune cells and expression of the ectonucleotidase enzymes CD39 and CD73 after ischemic injury.PLoS One. 2012;7(4):e34730. doi: 10.1371/journal.pone.0034730. Epub 2012 Apr 13. PLoS One. 2012. PMID: 22514659 Free PMC article.
-
CD73 on T Cells Orchestrates Cardiac Wound Healing After Myocardial Infarction by Purinergic Metabolic Reprogramming.Circulation. 2017 Jul 18;136(3):297-313. doi: 10.1161/CIRCULATIONAHA.116.023365. Epub 2017 Apr 21. Circulation. 2017. PMID: 28432149
-
CD39 expression on T lymphocytes correlates with severity of disease in patients with chronic lymphocytic leukemia.Clin Lymphoma Myeloma Leuk. 2011 Aug;11(4):367-72. doi: 10.1016/j.clml.2011.06.005. Clin Lymphoma Myeloma Leuk. 2011. PMID: 21816376 Free PMC article.
-
Ectonucleotidases in Ischemia Reperfusion Injury: Unravelling the Interplay With Mitochondrial Dysfunction in Liver Transplantation.Transplant Proc. 2024 Sep;56(7):1598-1606. doi: 10.1016/j.transproceed.2024.07.009. Epub 2024 Aug 24. Transplant Proc. 2024. PMID: 39183080 Review.
-
CD73 and CD39 ectonucleotidases in T cell differentiation: Beyond immunosuppression.FEBS Lett. 2015 Nov 14;589(22):3454-60. doi: 10.1016/j.febslet.2015.07.027. Epub 2015 Jul 29. FEBS Lett. 2015. PMID: 26226423 Review.
Cited by
-
Feasibility of Xenogeneic Mitochondrial Transplantation in Neuronal Systems: An Exploratory Study.Life (Basel). 2025 Jun 23;15(7):998. doi: 10.3390/life15070998. Life (Basel). 2025. PMID: 40724501 Free PMC article.
-
Engaging natural regulatory myeloid cells to restrict T-cell hyperactivation-induced liver inflammation via extracellular vesicle-mediated purine metabolism regulation.Theranostics. 2024 Aug 12;14(12):4874-4893. doi: 10.7150/thno.97427. eCollection 2024. Theranostics. 2024. PMID: 39239508 Free PMC article.
References
-
- Nolan JP, Neumar RW, Adrie C, Aibiki M, Berg RA, Bottiger BW, et al. . Post-cardiac arrest syndrome: epidemiology, pathophysiology, treatment, and prognostication. A Scientific Statement from the International Liaison Committee on Resuscitation; the American Heart Association Emergency Cardiovascular Care Committee; the Council on Cardiovascular Surgery and Anesthesia; the Council on Cardiopulmonary, Perioperative, and Critical Care; the Council on Clinical Cardiology; the Council on Stroke. Resuscitation. (2008) 79:350–79. doi: 10.1016/j.resuscitation.2008.09.017 - DOI - PubMed
-
- Callaway CW, Donnino MW, Fink EL, Geocadin RG, Golan E, Kern KB, et al. . Part 8: post-Cardiac arrest care: 2015 American Heart Association guidelines update for cardiopulmonary resuscitation and emergency cardiovascular care. Circulation. (2015) 132:S465–82. doi: 10.1161/CIR.0000000000000262 - DOI - PMC - PubMed
Publication types
MeSH terms
Substances
LinkOut - more resources
Full Text Sources
Medical
Molecular Biology Databases
Research Materials