. 2024 Mar 19;10(6):e28163.
doi: 10.1016/j.heliyon.2024.e28163. eCollection 2024 Mar 30.

Nanopore-based metagenomics analysis reveals microbial presence in amniotic fluid: A prospective study

Affiliations

Nanopore-based metagenomics analysis reveals microbial presence in amniotic fluid: A prospective study

Lihang Zhong et al. Heliyon. .

Abstract

Background: Current research on amniotic fluid (AF) microbiota yields contradictory data, necessitating an accurate, comprehensive, and scientifically rigorous evaluation.

Objective: This study aimed to characterise the microbial features of AF and explore the correlation between microbial information and clinical parameters.

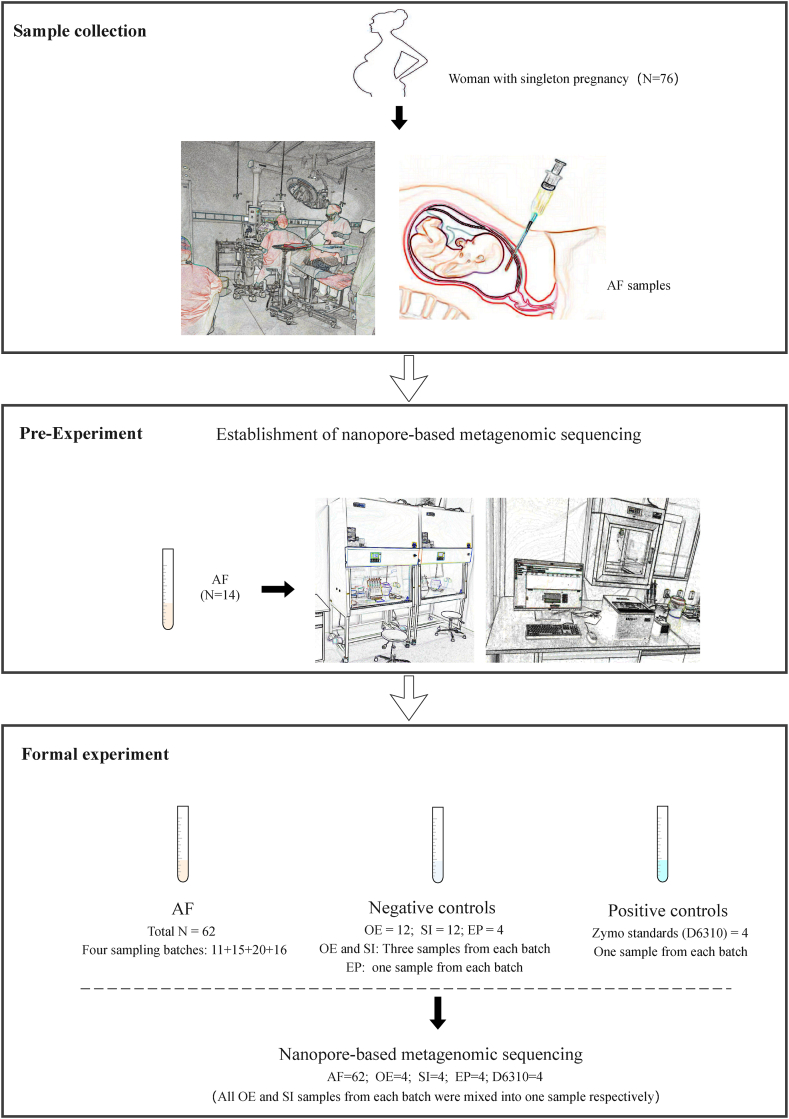
Methods: 76 AF samples were collected in this prospective cohort study. Fourteen samples were utilised to establish the nanopore metagenomic sequencing methodology, whereas the remaining 62 samples underwent a final statistical analysis along with clinical information. Negative controls included the operating room environment (OE), surgical instruments (SI), and laboratory experimental processes (EP) to elucidate the background contamination at each step. Simultaneously, levels of five cytokines (IL-1β, IL-6, IL-8, TNF-α, MMP-8) in AF were assessed.

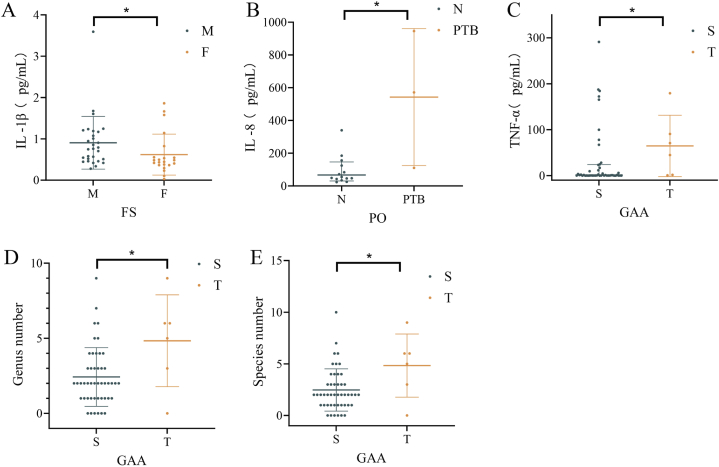
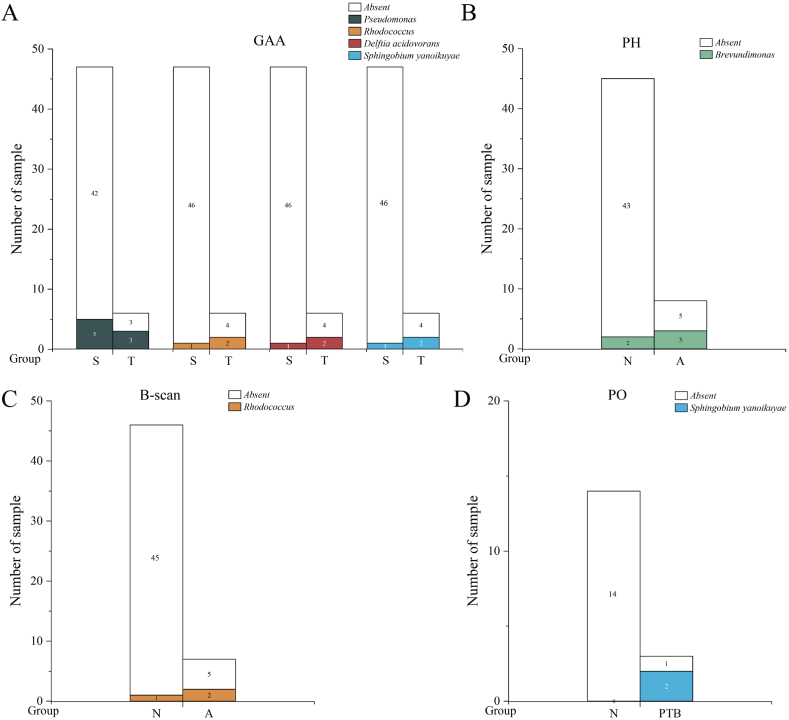
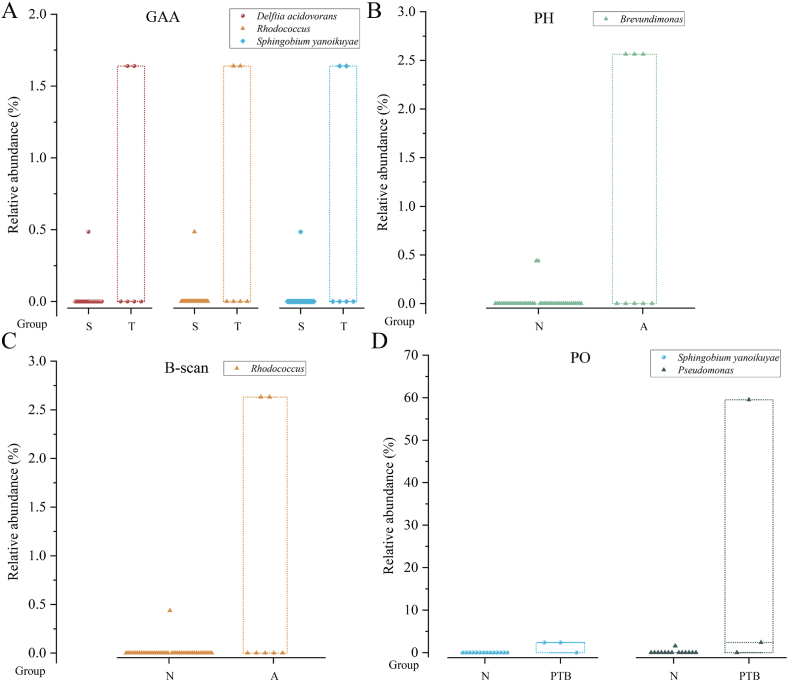
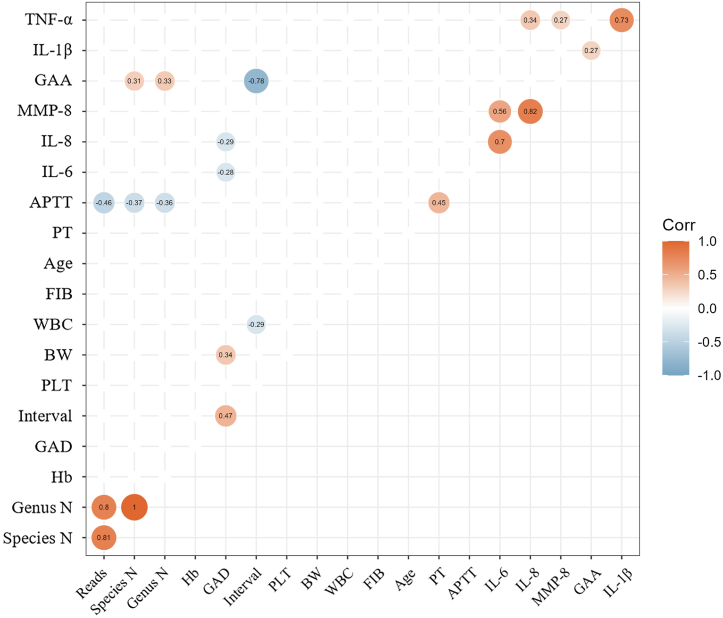
Results: Among the 62 AF samples, microbial analysis identified seven without microbes and 55 with low microbial diversity and abundance. No significant clinical differences were observed between AF samples with and without microbes. The correlation between microbes and clinical parameters in AF with normal chromosomal structure revealed noteworthy findings. In particular, the third trimester exhibited richer microbial diversity. Pseudomonas demonstrated higher detection rates and relative abundance in the second trimester and Preterm Birth (PTB) groups. S. yanoikuyae in the PTB group exhibited elevated detection frequencies and relative abundance. Notably, Pseudomonas negatively correlated with activated partial thromboplastin time (APTT) (r = -0.329, P = 0.016), while Staphylococcus showed positive correlations with APTT (r = 0.395, P = 0.003). Furthermore, Staphylococcus negatively correlated with birth weight (r = -0.297, P = 0.034).

Conclusion: Most AF samples exhibited low microbial diversity and abundance. Certain microbes in AF may correlate with clinical parameters such as gestational age and PTB. However, these associations require further investigation. It is essential to expand the sample size and undertake more comprehensive research to elucidate the clinical implications of microbial presence in AF.

Keywords: Amniotic fluid; Cytokines; Microbes; Nanopore metagenomic sequencing; Pregnancy outcomes.


Conflict of interest statement

The authors declare that they have no known competing financial interests or personal relationships that could have appeared to influence the work reported in this paper.

Figures

Fig. 1
Fig. 1
The flow chart of the study design.
Fig. 2
Fig. 2
Distribution of clinical characteristics. PH: pregnancy history, Hb: haemoglobin, PLT: platelet count, PT: prothrombin time, APTT: activated partial thromboplastin time, FIB: fibrinogen, B-scan: results of B-scan ultrasonography, Chr: chromosome structure; PO: pregnancy outcome, WBC: white blood cell count. Each dot represents normal clinical indicators in one individual.
Fig. 3
Fig. 3
Microbial distribution at the genus (A) and species (B) levels. B1-1∼B1-11 represent 11 samples from the first batch and the same for the second, third and fourth batches. OE: operating room environment, SI: surgical instruments, EP: experimental process, RS: samples containing microbial reads, NRS: none-reads samples.
Fig. 4
Fig. 4
Sankey diagram of microbes in AF samples. We show the taxonomic ranks domain, kingdom, phylum, class, and genus.
Fig. 5
Fig. 5
Microbial diversity analysis. (A): Rarefaction curve of AF samples. The abscissa represents the number of randomly selected sequences in each sample, and the ordinate represents the corresponding number of species. (B): Rank-abundance of AF samples. Each line means each sample. (C): Distribution of fungi, bacteria, and viruses in all samples. (D): Number of samples with different microbial species. (E): Number of microbial species with different reads.
Fig. 6
Fig. 6
Microbial distribution of dominant species and genera. Relative abundance at the genus (A) and species (B) levels. Microbial reads with fewer than six reads were classified as “Others”. The number of samples and reads at the genus (C) and species (D) levels, with less than three samples or reads not shown.
Fig. 7
Fig. 7
Differences in clinical parameters and microbial species, genera, and reads between categorical variable groups. The figure only shows the groups with significant differences (P < 0.05). * indicates P < 0.05.
Fig. 8
Fig. 8
Differences in microbial detection frequency between two groups of categorical variables. The figure only shows the groups with significant differences (P < 0.05). Table S8 shows the specific positive sample ID and P-values.
Fig. 9
Fig. 9
Differences in the relative abundance of microorganisms between two groups of categorical variables. The figure only shows groups with significant differences (P < 0.05). Table S9 shows the specific positive sample ID and P-values. This figure is an overlay of the box and dot plots. Circle, triangle, and diamond symbols represent samples, and the top and bottom edges of the box represent the maximum and minimum values of abundance. Different colors represent different microbes. The horizontal coordinate indicates the grouping under that variable.
Fig. 10
Fig. 10
Correlation analysis of continuous variables. The graph only shows the correlation test with P < 0.05.

Similar articles

References

    1. Consortium H.M.P. Structure, function and diversity of the healthy human microbiome. Nature. 2012;486(7402):207–214. - PMC - PubMed
    1. Gaufin T., TobinG N.H., Aldrovandi M. The importance of the microbiome in pediatrics and pediatric infectious diseases. Curr. Opin. Pediatr. 2018;30(1):117–124. - PMC - PubMed
    1. Lim E.S., Wang D., Holtz L.R. The bacterial microbiome and virome milestones of infant development. Trends Microbiol. 2016;24(10):801–810. - PubMed
    1. Funkhouser L.J., Bordenstein S.R. Mom knows best: the universality of maternal microbial transmission. PLoS Biol. 2013;11(8) - PMC - PubMed
    1. Collado M.C., Rautava S., Aakko J., et al. Human gut colonisation may be initiated in utero by distinct microbial communities in the placenta and amniotic fluid. Sci. Rep. 2016;6 - PMC - PubMed

LinkOut - more resources