

Investigation of Plasma Cell-Free DNA and MiRNA in Cholangiocarcinoma and Opisthorchiasis Viverrini Patients
- PMID: 38546056
- PMCID: PMC11152403
- DOI: 10.31557/APJCP.2024.25.3.739
Investigation of Plasma Cell-Free DNA and MiRNA in Cholangiocarcinoma and Opisthorchiasis Viverrini Patients
Abstract
Objectives: This study aimed to assess the diagnostic potential of cell-free DNA (cfDNA) and cell-free miRNA (cf-miRNA) for distinguishing between Healthy, asymptomatic opisthorchiasis viverrini and cholangiocarcinoma in a preliminary manner.
Methods: In this study, 36 participants were enrolled into three health status groups: a healthy control group (HC), Opisthorchis viverrini-infected group (OV), and a cholangiocarcinoma group (CCA), each comprising 12 participants. Concentration measurements of cfDNA and cf-miRNA from plasma were conducted. Additionally, ultra-low-pass whole-genome sequencing (ULP-WGS) was employed to investigate DNA alterations.
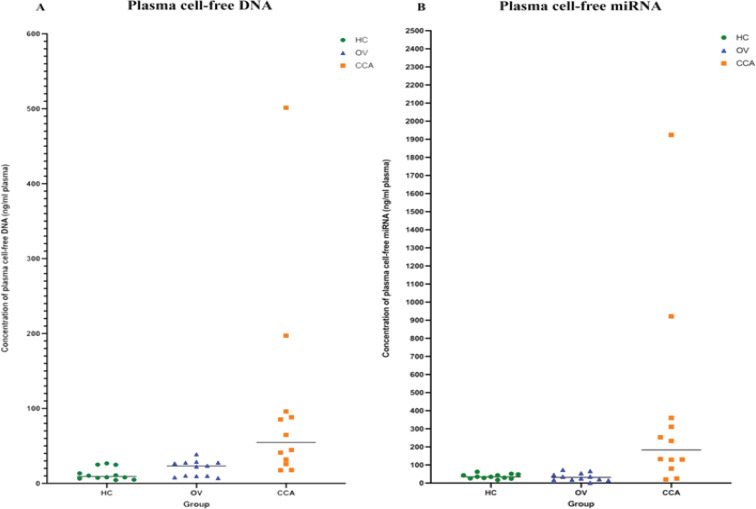
Results: The study revealed a significant elevation in plasma cfDNA concentration in the cholangiocarcinoma (CCA) group compared to healthy controls (HC) and Opisthorchis viverrini-infected (OV) groups (P < 0.001). The cfDNA concentration demonstrated a sensitivity of 75.00% and specificity of 95.83% for differentiating cholangiocarcinoma, with a cut-off of > 30.50 ng/ml plasma. Likewise, the concentration of cf-miRNA in the CCA group significantly differed from that in the HC and OV groups, demonstrating a sensitivity of 83.33% and specificity of 95.83% with a cut-off set at > 70.50 ng/ml plasma. Furthermore, a positive correlation between plasma concentrations of cfDNA and cf-miRNA suggests a potential relationship between these two biomarkers. These findings indicated the diagnostic potential of cfDNA and cf-miRNA in distinguishing cholangiocarcinoma, emphasizing their role as promising biomarkers for further investigation and clinical applications.
Conclusion: Elevated plasma concentrations of cfDNA and cf-miRNA could serve as potential diagnostic tools for distinguishing cholangiocarcinoma from other conditions. cf-miRNA was superior to cfDNA in terms of sensitivity.
Keywords: Cell-free DNA; Diagnosis; Opisthorchis viverrini; cell-free miRNA; cholangiocarcinoma.
Conflict of interest statement
The authors declared no conflict of interest for this study.
Figures


Similar articles
-
Biomarker potential of plasma cell-free DNA for cholangiocarcinoma.Heliyon. 2024 Dec 6;10(24):e41008. doi: 10.1016/j.heliyon.2024.e41008. eCollection 2024 Dec 30. Heliyon. 2024. PMID: 39735621 Free PMC article.
-
microRNA profiling of exosomes derived from plasma and their potential as biomarkers for Opisthorchis viverrini-associated cholangiocarcinoma.Acta Trop. 2024 Oct;258:107362. doi: 10.1016/j.actatropica.2024.107362. Epub 2024 Aug 14. Acta Trop. 2024. PMID: 39151716
-
Rapid assessment of Opisthorchis viverrini IgG antibody in serum: A potential diagnostic biomarker to predict risk of cholangiocarcinoma in regions endemic for opisthorchiasis.Int J Infect Dis. 2022 Mar;116:80-84. doi: 10.1016/j.ijid.2021.12.347. Epub 2021 Dec 23. Int J Infect Dis. 2022. PMID: 34954313 Free PMC article.
-
Current State of Knowledge on Blood and Tissue-Based Biomarkers for Opisthorchis viverrini-induced Cholangiocarcinoma: A Review of Prognostic, Predictive, and Diagnostic Markers.Asian Pac J Cancer Prev. 2024 Jan 1;25(1):25-41. doi: 10.31557/APJCP.2024.25.1.25. Asian Pac J Cancer Prev. 2024. PMID: 38285765 Free PMC article. Review.
-
Epigenetic Biomarkers and the Wnt/β-Catenin Pathway in Opisthorchis viverrini-associated Cholangiocarcinoma: A Scoping Review on Therapeutic Opportunities.PLoS Negl Trop Dis. 2024 Sep 5;18(9):e0012477. doi: 10.1371/journal.pntd.0012477. eCollection 2024 Sep. PLoS Negl Trop Dis. 2024. PMID: 39236081 Free PMC article.
Cited by
-
Circulating tumor DNA in cholangiocarcinoma: current clinical applications and future perspectives.Front Cell Dev Biol. 2025 Jul 2;13:1616064. doi: 10.3389/fcell.2025.1616064. eCollection 2025. Front Cell Dev Biol. 2025. PMID: 40673275 Free PMC article. Review.
-
Plasma Cell-Free DNA and MiRNA in Cholangiocarcinoma and Opisthorchiasis Viverrini Patients: Comment.Asian Pac J Cancer Prev. 2024 Aug 1;25(8):2579. doi: 10.31557/APJCP.2024.25.8.2579. Asian Pac J Cancer Prev. 2024. PMID: 39205552 Free PMC article. No abstract available.
-
Differential circulating miRNA profiles identified miR-423-5p, miR-93-5p, and miR-4532 as potential biomarkers for cholangiocarcinoma diagnosis.PeerJ. 2024 Dec 10;12:e18367. doi: 10.7717/peerj.18367. eCollection 2024. PeerJ. 2024. PMID: 39677943 Free PMC article.
-
Biomarker potential of plasma cell-free DNA for cholangiocarcinoma.Heliyon. 2024 Dec 6;10(24):e41008. doi: 10.1016/j.heliyon.2024.e41008. eCollection 2024 Dec 30. Heliyon. 2024. PMID: 39735621 Free PMC article.
-
New Relevant Evidence in Cholangiocarcinoma Biology and Characterization.Cancers (Basel). 2024 Dec 19;16(24):4239. doi: 10.3390/cancers16244239. Cancers (Basel). 2024. PMID: 39766138 Free PMC article. Review.
References
-
- Das J, Kelley SO. High‐performance nucleic acid sensors for liquid biopsy applications. Angewandte Chemie. 2020;132(7):2574–84. - PubMed
MeSH terms
Substances
LinkOut - more resources
Full Text Sources
Medical