. 2025 Jun;40(6):891-901.
doi: 10.1002/tox.24250. Epub 2024 Mar 28.

Exploring gene biomarkers and targeted drugs for ferroptosis and cuproptosis in osteosarcoma: A bioinformatic approach

Affiliations

Exploring gene biomarkers and targeted drugs for ferroptosis and cuproptosis in osteosarcoma: A bioinformatic approach

Yingnan Ji et al. Environ Toxicol. 2025 Jun.

Abstract

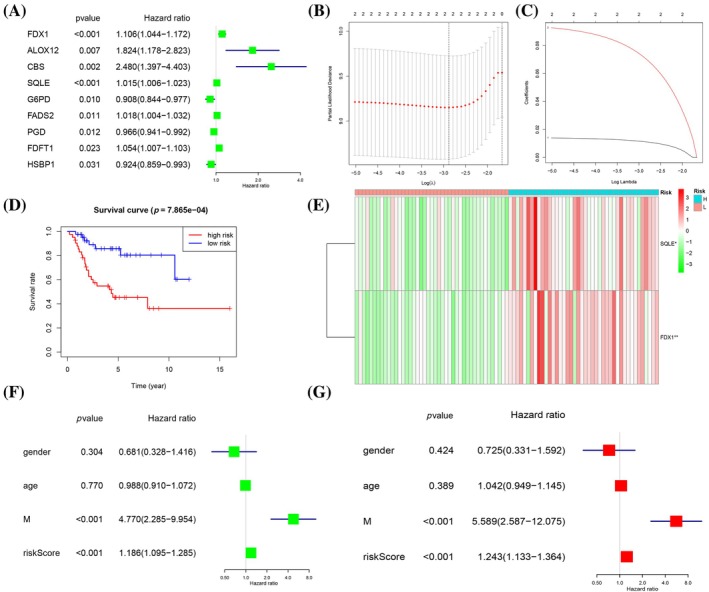
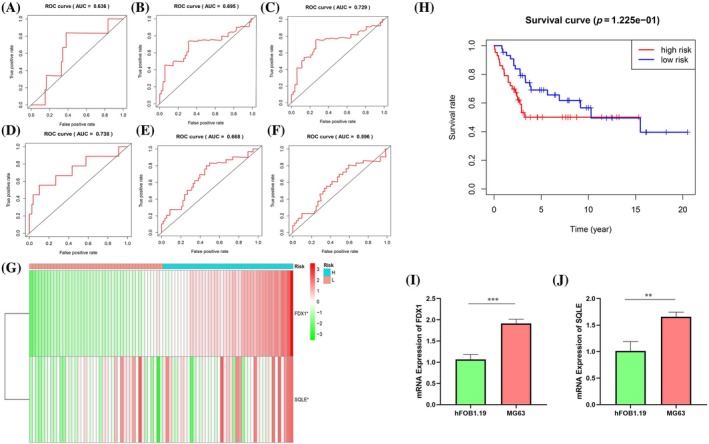
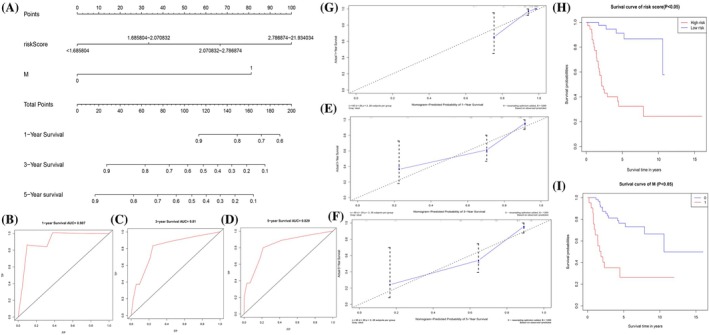
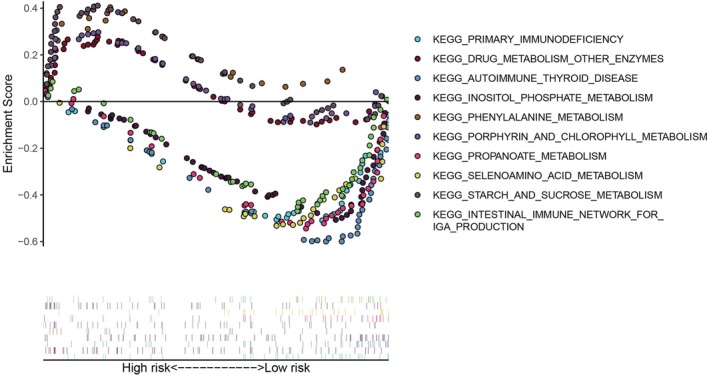
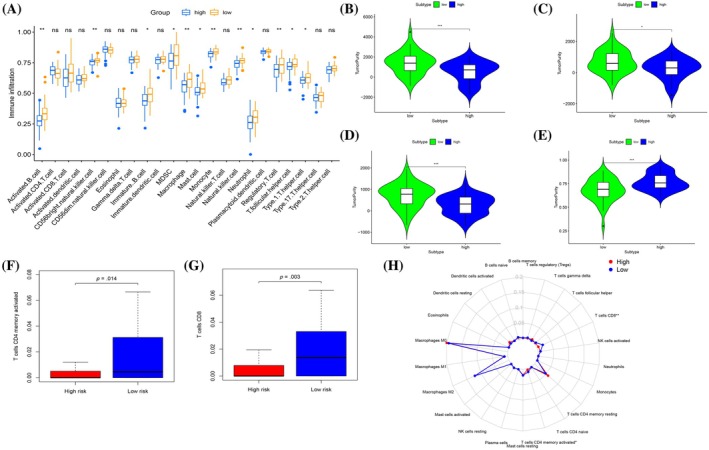
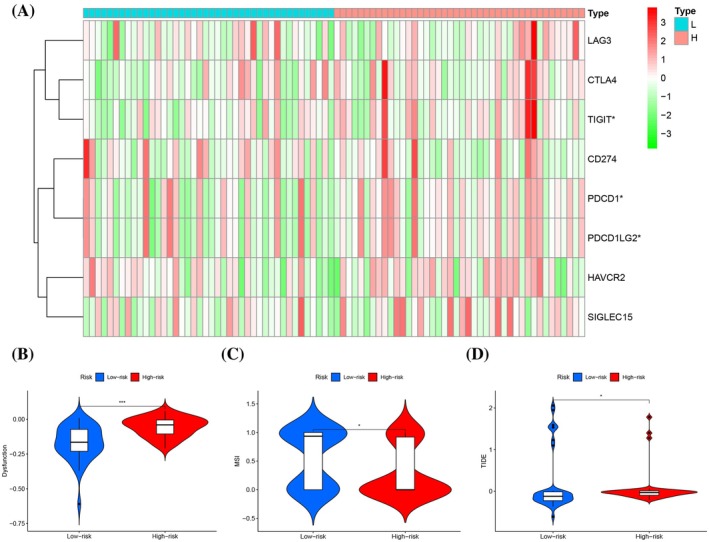
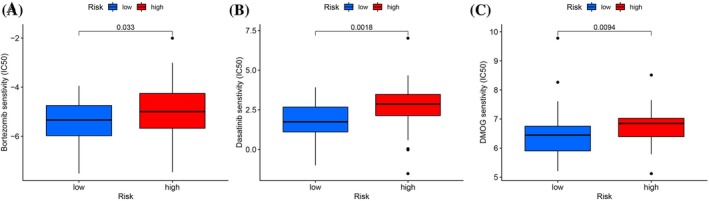
Osteosarcoma predominantly affects adolescents and young adults and is characterized as a malignant bone tumor. In recent decades, substantial advancements have been achieved in both diagnosing and treating osteosarcoma. Resulting in enhanced survival rates. Despite these advancements, the intricate relationship between ferroptosis and cuproptosis genes in osteosarcoma remains inadequately understood. Leveraging TARGET and GEO datasets, we conducted Cox regression analysis to select prognostic genes from a cohort of 71 candidates. Subsequently, a novel prognostic model was engineered using the LASSO algorithm. Kaplan-Meier analysis demonstrated that patients stratified as low risk had a substantially better prognosis compared with their high-risk counterparts. The model's validity was corroborated by the area under the receiver operating characteristic (ROC) curve. Additionally, we ascertained independent prognostic indicators, including clinical presentation, metastatic status, and risk scores, and crafted a clinical scoring system via nomograms. The tumor immune microenvironment was appraised through ESTIMATE, CIBERSORT, and single-sample gene set enrichment analysis. Gene expression within the model was authenticated through PCR validation. The prognostic model, refined by Cox regression and the LASSO algorithm, comprised two risk genes. Kaplan-Meier curves confirmed a significantly improved prognosis for the low-risk group in contrast to those identified as high-risk. For the training set, the ROC area under the curve (AUC) values stood at 0.636, 0.695, and 0.729 for the 1-, 3-, and 5-year checkpoints, respectively. Although validation set AUCs were 0.738, 0.668, and 0.596, respectively. Immune microenvironmental analysis indicated potential immune deficiencies in high-risk patients. Additionally, sensitivity to three small molecule drugs was investigated in the high-risk cohort, informing potential immunotherapeutic strategies for osteosarcoma. PCR analysis showed increased mRNA levels of the genes FDX1 and SQLE in osteosarcoma tissues. This study elucidates the interaction of ferroptosis and cuproptosis genes in osteosarcoma and paves the way for more targeted immunotherapy.

Keywords: cuproptosis; ferroptosis; osteosarcoma; prognostic marker.


Conflict of interest statement

The authors declare that they have no competing interests.

Figures

FIGURE 1
FIGURE 1
Kaplan–Meier curves for the 34 genes in osteosarcoma patients from TARGET database.
FIGURE 2
FIGURE 2
A network of correlations including FRGs and CUGs in the TARGET cohort. (*p < .05; **p < .01; ***p < .001).
FIGURE 3
FIGURE 3
Prognostic relevance and construction of the risk signature of FRGs and CUGs in osteosarcoma (OS). (A) The prognostic analyses for nine genes using univariate Cox regression model. (B, C) LASSO coefficient profiles of the two genes. (D) The Kaplan–Meier analysis showed that patients in the low‐risk group presented better osteosarcoma than those in the high‐risk group for training set. (E) Expression patterns of two selected prognostic genes in high‐and low‐risk groups for training set. (F, G) The training set of forrest plot of the independent prognostic factors in OS.
FIGURE 4
FIGURE 4
Validation of model for predicting the prognosis of osteosarcoma (OS) patients. (A, B, C) The training set of the receiver operating characteristic (ROC) curve for evaluating the prediction efficiency of the prognostic signature. (D, E, F) The testing set of the ROC curve for evaluating the prediction efficiency of the prognostic signature. (G) Expression patterns of two selected prognostic genes in high‐and low‐risk groups for testing set. (H) The Kaplan–Meier analysis showed that patients in the low‐risk group presented better OS than those in the high‐risk group for testing set. (I) mRNA expression of FDX1. (J) mRNA expression of SQLE.
FIGURE 5
FIGURE 5
Construction and validation of a nomogram for predicting the prognosis of osteosarcoma (OS) patients. (A) Nomogram for predicting the 1‐, 3‐, and 5‐years OS of osteosarcoma patients in the TARGET‐OS cohort. (B, C, D) The receiver operating characteristic (ROC) curves of the nomograms compared for 1‐, 3‐, and 5‐years OS in osteosarcoma patients, respectively. (E, F, G) Calibration curves for validating the established nomogram. (H) Kaplan–Meier survival curves stratified according to risk scores. (I) Kaplan–Meier survival curves stratified according to metastasis.
FIGURE 6
FIGURE 6
Gene set enrichment analysis analysis between high‐risk and low‐risk groups.
FIGURE 7
FIGURE 7
Prognosis and TME characteristics in two clusters for osteosarcoma (OS) patients. (A) Box plot for the TME cells in distinct risk groups derived from OS patients based on the single‐sample gene set enrichment analysis. The asterisks represented the statistical p value (*p < .05; **p < .01; ***p < .001). (B, C, D, E) Immune, stromal, ESTIMATE and TumorPurity scores within the low‐ and high‐risk groups. (F, G) Expression of two key immune cells in two groups. (H) Summary of the immune cells' abundance for different risk groups.
FIGURE 8
FIGURE 8
Sensitivity of immunotherapy and immune escape in high and low wind groups. (A) Differences between the two groups of eight immune checkpoints. (B, C, D) Comparison of tumor immune dysfunction and exclusion in two risk groups.
FIGURE 9
FIGURE 9
Predicting the responsiveness of osteosarcoma to chemotherapy based on risk model. (A) Bortezomib sensitivity. (B) Dasatinib sensitivity. (C) DMOG sensitivity.

Similar articles

Cited by

References

    1. Chen C, Xie L, Ren T, Huang Y, Xu J, Guo W. Immunotherapy for osteosarcoma: fundamental mechanism, rationale, and recent breakthroughs. Cancer Lett. 2021;500:1‐10. - PubMed
    1. Mou Y, Wang J, Wu J, et al. Ferroptosis, a new form of cell death: opportunities and challenges in cancer. J Hematol Oncol. 2019;12(1):34. - PMC - PubMed
    1. Wen RJ, Dong X, Zhuang HW, et al. Baicalin induces ferroptosis in osteosarcomas through a novel Nrf2/xCT/GPX4 regulatory axis. Phytomedicine. 2023;116:154881. - PubMed
    1. Tsvetkov P, Coy S, Petrova B, et al. Copper induces cell death by targeting lipoylated TCA cycle proteins. Science. 2022;375(6586):1254‐1261. - PMC - PubMed
    1. Cen D, Brayton D, Shahandeh B, Meyskens FL Jr, Farmer PJ. Disulfiram facilitates intracellular Cu uptake and induces apoptosis in human melanoma cells. J Med Chem. 2004;47(27):6914‐6920. - PubMed

LinkOut - more resources