. 2024 Mar 28:12:RP91044.
doi: 10.7554/eLife.91044.

Neurophysiological trajectories in Alzheimer's disease progression

Affiliations

Neurophysiological trajectories in Alzheimer's disease progression

Kiwamu Kudo et al. Elife. .

Abstract

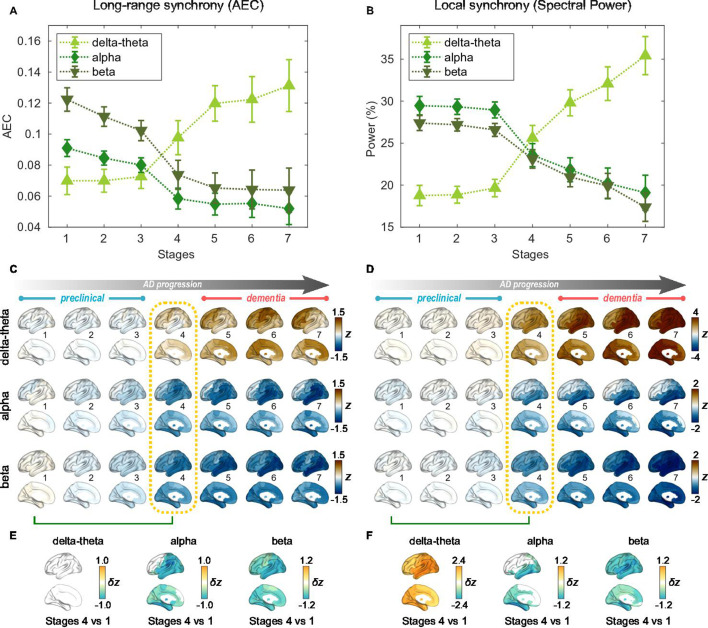
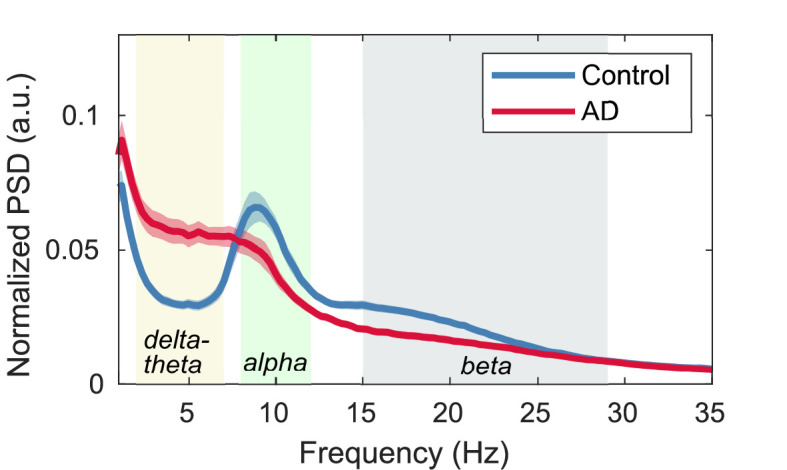
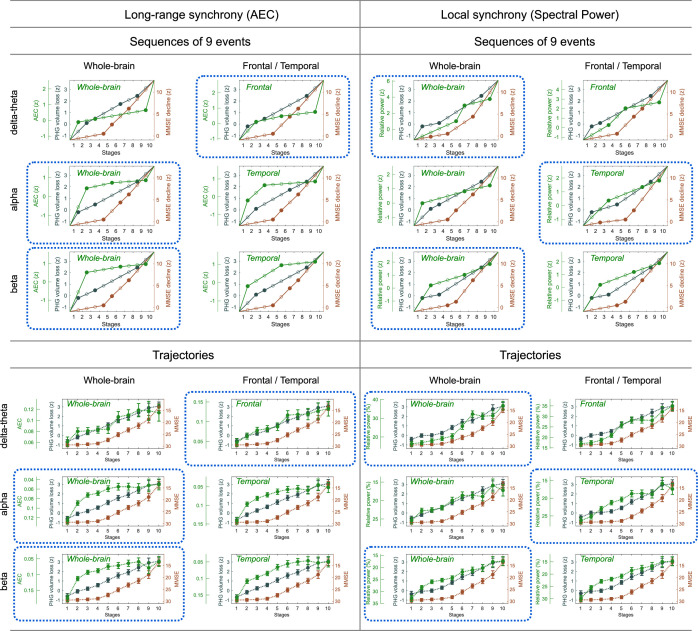
Alzheimer's disease (AD) is characterized by the accumulation of amyloid-β and misfolded tau proteins causing synaptic dysfunction, and progressive neurodegeneration and cognitive decline. Altered neural oscillations have been consistently demonstrated in AD. However, the trajectories of abnormal neural oscillations in AD progression and their relationship to neurodegeneration and cognitive decline are unknown. Here, we deployed robust event-based sequencing models (EBMs) to investigate the trajectories of long-range and local neural synchrony across AD stages, estimated from resting-state magnetoencephalography. The increases in neural synchrony in the delta-theta band and the decreases in the alpha and beta bands showed progressive changes throughout the stages of the EBM. Decreases in alpha and beta band synchrony preceded both neurodegeneration and cognitive decline, indicating that frequency-specific neuronal synchrony abnormalities are early manifestations of AD pathophysiology. The long-range synchrony effects were greater than the local synchrony, indicating a greater sensitivity of connectivity metrics involving multiple regions of the brain. These results demonstrate the evolution of functional neuronal deficits along the sequence of AD progression.

Keywords: Alzheimer's disease; biomarkers; electrophysiology; functional connectivity; human; magnetoencephalography; neuroscience.


Conflict of interest statement

KK KK is a full-time employee of Ricoh Company, Ltd, KR, FS, KR, BM, JK, GR, KV, HK No competing interests declared, HM HM is a full-time employee of Ricoh Company, Ltd, KS KS is an employee of Signal Analysis Inc, SN SSN is a scientific consultant to MEGIN Inc. and a Medical Strategy Adviser to Hippoclinic Inc. He served on the scientific advisory board for Rune Labs Inc. from 2019-2022. He was the recipient of an industry contract from Ricoh MEG USA Inc

Figures

Figure 1.
Figure 1.. Atrophy-cognition event-based sequencing model (EBM) staging of Alzheimer’s disease (AD) progression.
(A) Histogram of parahippocampal gyrus (PHG) volume loss z-scores, zPHG. (B) Histogram of mini-mental state examination (MMSE)-decline z-scores, zMMSE. The z-scores for PHG volume loss and MMSE were standardized by the adjusted scores of the control group and sign-inverted so that higher z-scores denote more severity. (C) Posterior probabilities, pj(k), that a subject j belongs to a stage k evaluated by the Atrophy-Cognition EBM (AC-EBM). (D) The ratio of subjects classified to each stage; blue: Control (clinical dementia rating, CDR 0), orange: MCI due to AD (CDR 0.5), pink: mild AD dementia (CDR 1), and red: moderate AD dementia (CDR 2). (E) Distribution of the stages in the space spanned by PHG volume loss and MMSE score. Each subject j was distinctly assigned to one of the stages with the highest posterior probability, argmaxkpj(k). The colors of the dots denote the seven stages. A star symbol denotes the probability-based weighted means of zPHG and MMSE scores at stage 4 and MMSE =26.3(±0.82). The values in parentheses denote the standard error (SE; Equation 5) of the weighted means. (F) Trajectories of PHG volume loss and MMSE score as a function of the seven stages. Probability-based weighted means (± SE) are shown. The initial and final z-scores used in the AC-EBM were: (zinitial,zfinal)=(1.372,3.804) for PHG volume loss and (0.902,12.712) for MMSE decline, respectively. (G) Progression of GM volume loss (z-scores) from stage 1–7. Regional gray matter (GM) atrophy in the predicted stage of mild cognitive impairment (MCI) (stage 4) was circled with a dotted line.
Figure 1—figure supplement 1.
Figure 1—figure supplement 1.. Steps for computing metric trajectories.
The metrics-trajectory computation steps in the Atrophy-Cognition EBM (AC-EBM) are illustrated. Similar steps were executed for the SAC-EBMs. In an SAC-EBM, the number of iterations in Step 1 was (7C3×7C3×7C3=)42,875. A diagram shown at the bottom of Step 1 represents the relationship between the events and stages in a linear z-score model. A stage is located between two consecutive event occurrence times and its model value (μi(k)) is given by a midpoint value. When a total of N events is set, the models provide N+1 event-based sequencing model (EBM) stages. Positional variance diagrams of the z-score events created from the 50,000 Markov chain Monte Carlo (MCMC) samples indicated that there was no uncertainty in the predicted positions of selected z-score events. Another example of positional variance with positional uncertainty has been shown in Figure 1—figure supplement 3.
Figure 1—figure supplement 2.
Figure 1—figure supplement 2.. An example of positional variance diagram of z-score events.
The z-score events, zPHG=[E1E2E3]=[0.5 0.75 1.5] and,zMMSE=[E4E5E6]=[0.1 0.3 3.0] were selected. Markov chain Monte Carlo (MCMC) sampling (50,000 samples) was performed to find an optimal sequence of events. It should be noted that this set of z-score events was not used in the Atrophy-Cognition EBM (AC-EBM) shown in the main text. This figure is intended to show just an example of positional variance diagrams with positional uncertainty. In the AC-EBM shown in the main text, we obtained the positional variance diagrams without positional uncertainty for the optimal sets of z-score events (Figure 1—figure supplement 3).
Figure 1—figure supplement 3.
Figure 1—figure supplement 3.. Group comparisons of parahippocampal gyrus (PHG) volumes and mini-mental state examination (MMSE) scores.
(A) Group comparison of PHG volume [unpaired t-test: t(143) = -9.508; ***p < 0.001] based on T-statistic while adjusting for the effects of total intracranial volume (TIV), age, and the difference between MRI and magnetoencephalography (MEG) dates. The PHG volume was defined as the sum of the volumes of PHGs from the left and right hemispheres. The average PHG volume in patients with Alzheimer’s disease (AD) was 7.99ml±0.09, and the average PHG volume in controls 9.28ml±0.11. (B) Group comparison of mini-mental state examination (MMSE) scores [unpaired t-test: t(144) = -10.171; ***p < 0.001] based on T-statistic while adjusting for the effects of age and the difference between MMSE and MEG dates. MMSEs were performed within an average of 0.48 years (range: -2.83–1.50) and 0.22 years (range: -1.52–1.01) of the evaluation of MEG for controls and patients, respectively.
Figure 1—figure supplement 4.
Figure 1—figure supplement 4.. Group comparison of gray matter (GM) volumes.
Group comparisons of GM volume for each of the 94 anatomical regions included in the Automated Anatomical Labeling 3 (AAL3) atlas were performed by computing T- and p-values using general linear models (GLMs) with total intracranial volume (TIV), age, and the difference between MRI and magnetoencephalography (MEG) dates as covariates. Eighty-seven regional GM volumes were significantly smaller in patients with Alzheimer’s disease (AD) than in controls, especially in the temporal regions. T-values exceeding threshold (q<0.01, false discovery rate (FDR) corrected) were displayed. Top 10 regions with significant group differences are listed in Supplementary file 4.
Figure 2.
Figure 2.. Profiles of neural synchrony as a function of the Alzheimer’s disease (AD) stages estimated by Atrophy-Cognition EBM (AC-EBM).
(A,B) Profiles of amplitude-envelope correlation (AEC) (A) and spectral power (B) as a function of the seven stages, showing probability-based weighted means (± SE). Neural synchrony increased monotonously with AD progression in the delta-theta band and decreased monotonously in the alpha and beta bands. (C,D) Regional AEC (C) and spectral power (D) as a function of the seven stages. Deviations from the neural-synchrony spatial patterns averaged over the controls are displayed. The deviations were evaluated using the probability-based weighted means of z-scores standardized by the controls. Spatial patterns in the mild cognitive impairment (MCI) stage (stage 4) were circled with dotted lines. (E,F) Changes in neural synchrony during the preclinical stages. Regional comparisons between two stages (stages 4 vs 1) are shown based on non-parametric tests of weighted mean differences δz. Differences that exceed the threshold (q<0.05) are displayed. There were no significant differences in long-range synchrony in the delta-theta band.
Figure 2—figure supplement 1.
Figure 2—figure supplement 1.. Normalized power spectral densities (PSDs) for the Alzheimer’s disease (AD) and control groups.
Power spectral densities (PSDs) were averaged in all regions of the brain (94 Automated Anatomical Labeling 3, AAL3 atlas) for controls and AD patients, respectively. Their 95% confidence intervals are also shown. The shaded areas in the frequency axis denote the canonical frequency bands: delta-theta (2–7 Hz), alpha (8–12 Hz), and beta (15–29 Hz) bands. In terms of the average PSD in AD, a clear alpha peak disappeared. Alpha frequencies in each region in AD patients generally decrease (i.e. alpha slowing) compared to controls. The magnitude of alpha slowing depends on brain regions as well as AD severity; for example, alpha slowing is prominent in temporal regions. Averaging over PSD curves with different alpha peaks results in the disappearance of an alpha peak in the average PSD in patients with AD.
Figure 2—figure supplement 2.
Figure 2—figure supplement 2.. Group comparisons of magnetoencephalography (MEG) metrics.
(A,B) Group comparisons (violin plots) and z-score histograms of the six scalar MEG metrics: [i] frontal delta-theta-band amplitude-envelope correlation (AEC), [ii] whole-brain alpha-band AEC, [iii] whole-brain beta-band AEC, [iv] whole-brain delta-theta-band spectral power, [v] temporal alpha-band spectral power, and [vi] whole-brain beta-band spectral power. Group comparisons were performed by T-statistics while adjusting for the effect of age (***p < 0.001). In terms of the z-scores of the scalar MEG metrics, raw z-score values in alpha and beta bands were negative in patients with AD, and therefore we defined, zMEG multiplying the values by -1 so that higher z-scores denote more severity. The sign-inverted z-scores were included in the SAC-EBMs. (C–F) Group comparisons of the regional MEG metrics based on T-statistic maps of region-wise comparisons (94 Automated Anatomical Labeling 3 , AAL3-atlas regions) while adjusting for the effect of age. For the regional AECs, we considered the connectivity strengths of each ROI. The unit of spectral power is a percentage of total power. T-values exceeding thresholds (q<0.05 for long-range synchrony (E) and q<0.01 for local synchrony (F), false discovery rate,FDR corrected) are displayed. The top 10 regions with significant group differences in long-range (E) and local (F) synchrony are listed in Supplementary file 5 and Supplementary file 6, respectively.
Figure 2—figure supplement 3.
Figure 2—figure supplement 3.. Frontal and temporal regions of interest.
The regions of interests (ROIs) were based on group differences in neural synchrony metrics between patients with Alzheimer’s disease (AD) and controls. ROIs were selected symmetrically for the left and right hemispheres from the regions where large group contrasts were identified (see Figure 2—figure supplement 3E). (F). For the frontal delta-theta-band amplitude-envelope correlation (AEC), 12 subregions were chosen mainly from the frontal area: left and right precentral, superior frontal (dorsolateral/medial), middle frontal, anterior cingulate and paracingulate gyri, and supplementary motor areas. For the temporal alpha-band spectral power, 20 subregions were chosen from the temporal area: left and right parahippocampal, lingual, superior/middle/inferior occipital, fusiform, superior/middle/inferior temporal gyri, and precunei.
Figure 3.
Figure 3.. Trajectories of long-range neural synchrony in delta-theta, alpha, and beta-bands from SAC-EBMs.
(A, E, I) The ratio of subjects classified to each stage. The ratio was evaluated on the basis of the probabilities that each subject will be assigned to each of the ten stages. (B, F, J) Trajectories of long-range synchrony, parahippocampal gyrus (PHG) volume loss, and mini-mental state examination (MMSE) score as a function of the ten stages, showing probability-based weighted means (± SE). The asterisks (*q < 0.05 and ***q < 0.001, false discovery rate - FDR corrected) denote statistical significance in comparisons between stages 5 vs 1. All stage pairs with significant weighted mean differences are listed in Supplementary file 9. Initial and final z-scores of long-range synchrony used in the SAC-EBMs were: (zinitial,zfinal)=(1.083,2.811), (1.542,1.605), and (1.624,1.641) in the delta-theta, alpha, and beta bands, respectively. (C, G, K) Regional amplitude-envelope correlation (AEC) along the stages. The deviations from the regional patterns of the control group are shown. The regional patterns at the onset of the mild cognitive impairment (MCI) stage were circled with dotted lines. (D,H,L) Changes in regional patterns during the preclinical stages. Regional comparisons between two stages are shown based on non-parametric tests of weighted mean differences δz. Differences exceeding threshold (q<0.05, FDR corrected) are displayed. The top 10 regions with significant differences are listed in Supplementary file 10.
Figure 3—figure supplement 1.
Figure 3—figure supplement 1.. Event sequences and trajectories determined by SAC-EBMs.
Sequences of nine events (N=9) are displayed as filled dots. In a linear z-score model, two consecutive events for a metric are linearly interpolated. Stages are located at temporal midpoints between two consecutive event occurrence times. The combinations of frequency bands and regions circled by blue dotted lines were considered in the SAC-EBMs described in the main text. The trajectory panels circled by blue dotted lines are the same as the trajectories shown in Figures 3 and 4 of the main text.
Figure 3—figure supplement 2.
Figure 3—figure supplement 2.. Positional variance diagrams of the z-score events in SAC-EBMs.
The SAC-EBMs with the optimal sets of the z-scores are shown. The labels of the z-score events, E1, E2, , E9, are for the parahippocampal gyrus (PHG) volume loss z-scores, the mini-mental state examination (MMSE) decline z-scores, and the magnetoencephalography (MEG)-metric z-scores, respectively; zPHG=[E1,E2,E3], zMMSE=[E4,E5,E6], and zMEG=[E7,E8,E9]. Positional variance was evaluated based on the Markov chain Monte Carlo (MCMC) samples of the sequence of the optimal set of z-score events, such as Figure 3—figure supplement 3.
Figure 3—figure supplement 3.
Figure 3—figure supplement 3.. Markov chain Monte Carlo (MCMC) samples of the sequence of the optimal set of z-score events in the SAC-EBM including alpha-band amplitude-envelope correlation (AEC).
A positional variance diagram for the SAC-EBM including alpha-band AEC (a upper middle panel in Figure 3—figure supplement 3) was calculated based on this occurrence frequency of the sequence of the z-score events.
Figure 3—figure supplement 4.
Figure 3—figure supplement 4.. Posterior probabilities evaluated by the SAC-EBMs.
The posterior probabilities that a subject j belongs to a stage k are given by pj(k). (upper panels) Posterior probabilities in the SAC-EBM including long-range synchrony. (lower panels) Posterior probabilities in the SAC-EBM including local synchrony.
Figure 4.
Figure 4.. Trajectories of local neural synchrony in delta-theta, alpha, and beta bands from SAC-EBMs.
(A, E, I) The ratio of subjects classified to each stage. (B, F, J) Trajectories of local synchrony, parahippocampal gyrus (PHG) volume loss, and mini-mental state examination (MMSE) score as a function of the 10 stages, show the weighted mean (± SE). Asterisks (***q < 0.001, FDR corrected) denote statistical significance in comparisons between stages 6 vs 1. All stage pairs with significant weighted mean differences are listed in Supplementary file 11. The initial and final z-scores of local synchrony used in the SAC-EBMs were: (zinitial,zfinal)=(1.329,6.097), (1.461,2.866), and (1.810,2.784) in the delta-theta, alpha, and beta bands, respectively. (C, G, K) Regional spectral power along the stages. Deviations from the regional patterns of the control group are shown. The regional patterns at the onset of the mild cognitive impairment (MCI) stages were circled with dotted lines. (D, H, L) Changes in regional patterns during the preclinical stages. Regional comparisons between two stages are shown based on nonparametric tests of weighted mean differences δz. Differences exceeding threshold (q<0.05, false discovery rate - FDR corrected) are displayed. The top 10 regions with significant differences are listed in Supplementary file 12.

Update of

References

    1. Ablin P, Cardoso JF, Gramfort A. Faster independent component analysis by preconditioning with hessian approximations. IEEE Transactions on Signal Processing. 2018;66:4040–4049. doi: 10.1109/TSP.2018.2844203. - DOI
    1. Ahnaou A, Moechars D, Raeymaekers L, Biermans R, Manyakov NV, Bottelbergs A, Wintmolders C, Van Kolen K, Van De Casteele T, Kemp JA, Drinkenburg WH. Emergence of early alterations in network oscillations and functional connectivity in a tau seeding mouse model of Alzheimer’s disease pathology. Scientific Reports. 2017;7:14189. doi: 10.1038/s41598-017-13839-6. - DOI - PMC - PubMed
    1. Albert MS, DeKosky ST, Dickson D, Dubois B, Feldman HH, Fox NC, Gamst A, Holtzman DM, Jagust WJ, Petersen RC, Snyder PJ, Carrillo MC, Thies B, Phelps CH. The diagnosis of mild cognitive impairment due to Alzheimer’s disease: Recommendations from the National Institute on Aging‐Alzheimer’s Association workgroups on diagnostic guidelines for Alzheimer’s disease. Alzheimer’s & Dementia. 2011;7:270–279. doi: 10.1016/j.jalz.2011.03.008. - DOI - PMC - PubMed
    1. Benjamini Y, Hochberg Y. Controlling the false discovery rate: a practical and powerful approach to multiple testing. Journal of the Royal Statistical Society. 1995;57:289–300. doi: 10.1111/j.2517-6161.1995.tb02031.x. - DOI
    1. Briels CT, Schoonhoven DN, Stam CJ, de Waal H, Scheltens P, Gouw AA. Reproducibility of EEG functional connectivity in Alzheimer’s disease. Alzheimer’s Research & Therapy. 2020a;12:1–14. doi: 10.1186/s13195-020-00632-3. - DOI - PMC - PubMed