

Trends in Burdens of Disease by Transmission Source (USA, 2005-2020) and Hazard Identification for Foods: Focus on Milkborne Disease
- PMID: 38546802
- PMCID: PMC11442898
- DOI: 10.1007/s44197-024-00216-6
Trends in Burdens of Disease by Transmission Source (USA, 2005-2020) and Hazard Identification for Foods: Focus on Milkborne Disease
Abstract
Background: Robust solutions to global, national, and regional burdens of communicable and non-communicable diseases, particularly related to diet, demand interdisciplinary or transdisciplinary collaborations to effectively inform risk analysis and policy decisions.
Objective: U.S. outbreak data for 2005-2020 from all transmission sources were analyzed for trends in the burden of infectious disease and foodborne outbreaks.
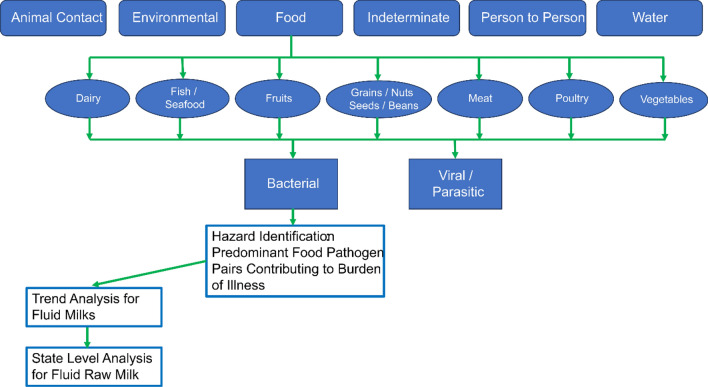
Methods: Outbreak data from 58 Microsoft Access® data tables were structured using systematic queries and pivot tables for analysis by transmission source, pathogen, and date. Trends were examined using graphical representations, smoothing splines, Spearman's rho rank correlations, and non-parametric testing for trend. Hazard Identification was conducted based on the number and severity of illnesses.
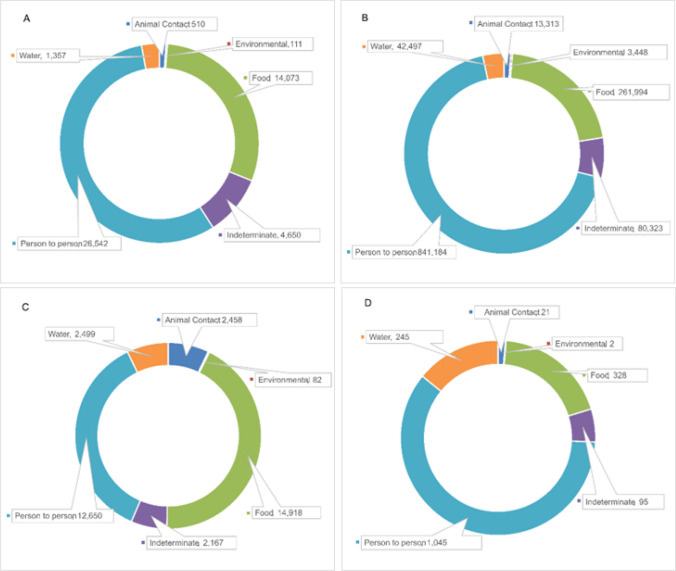
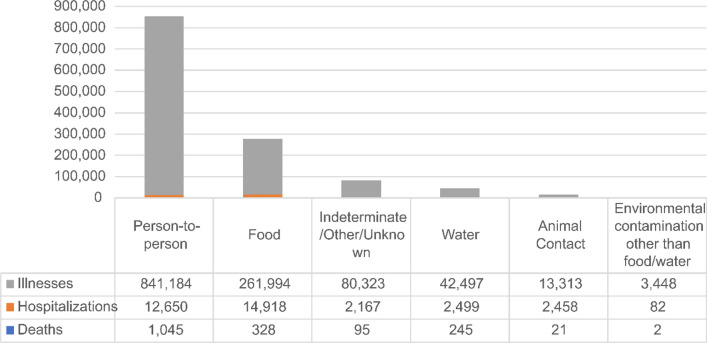
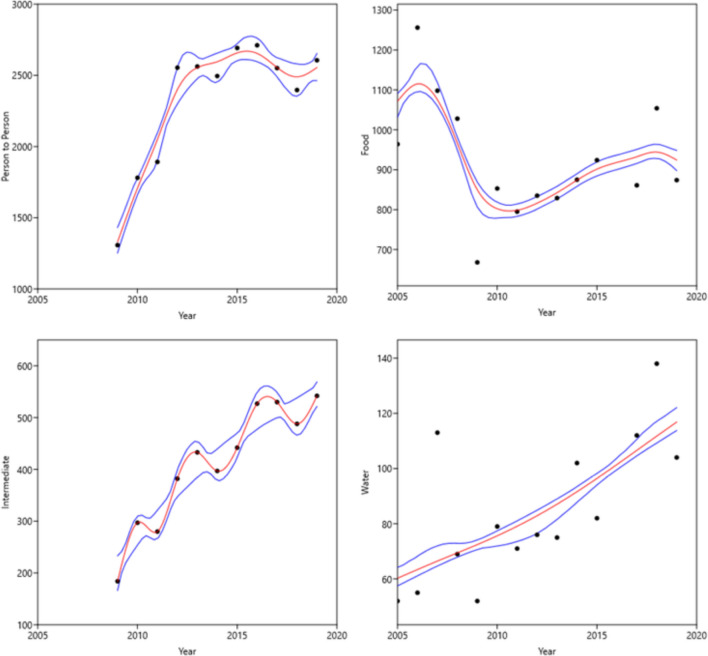
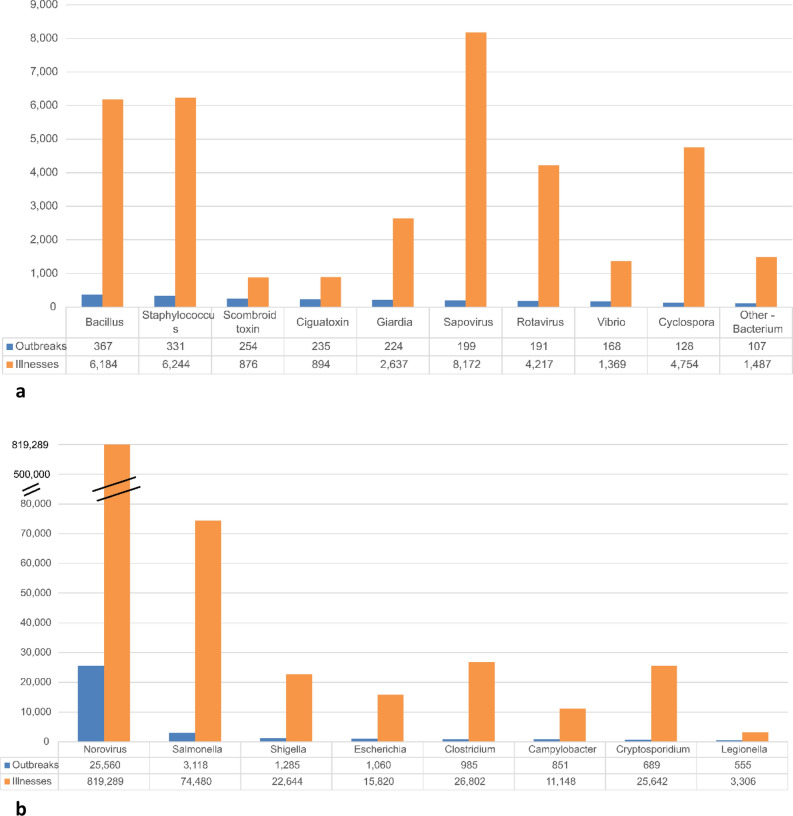
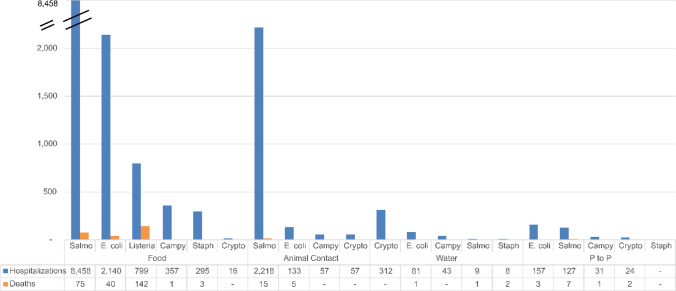
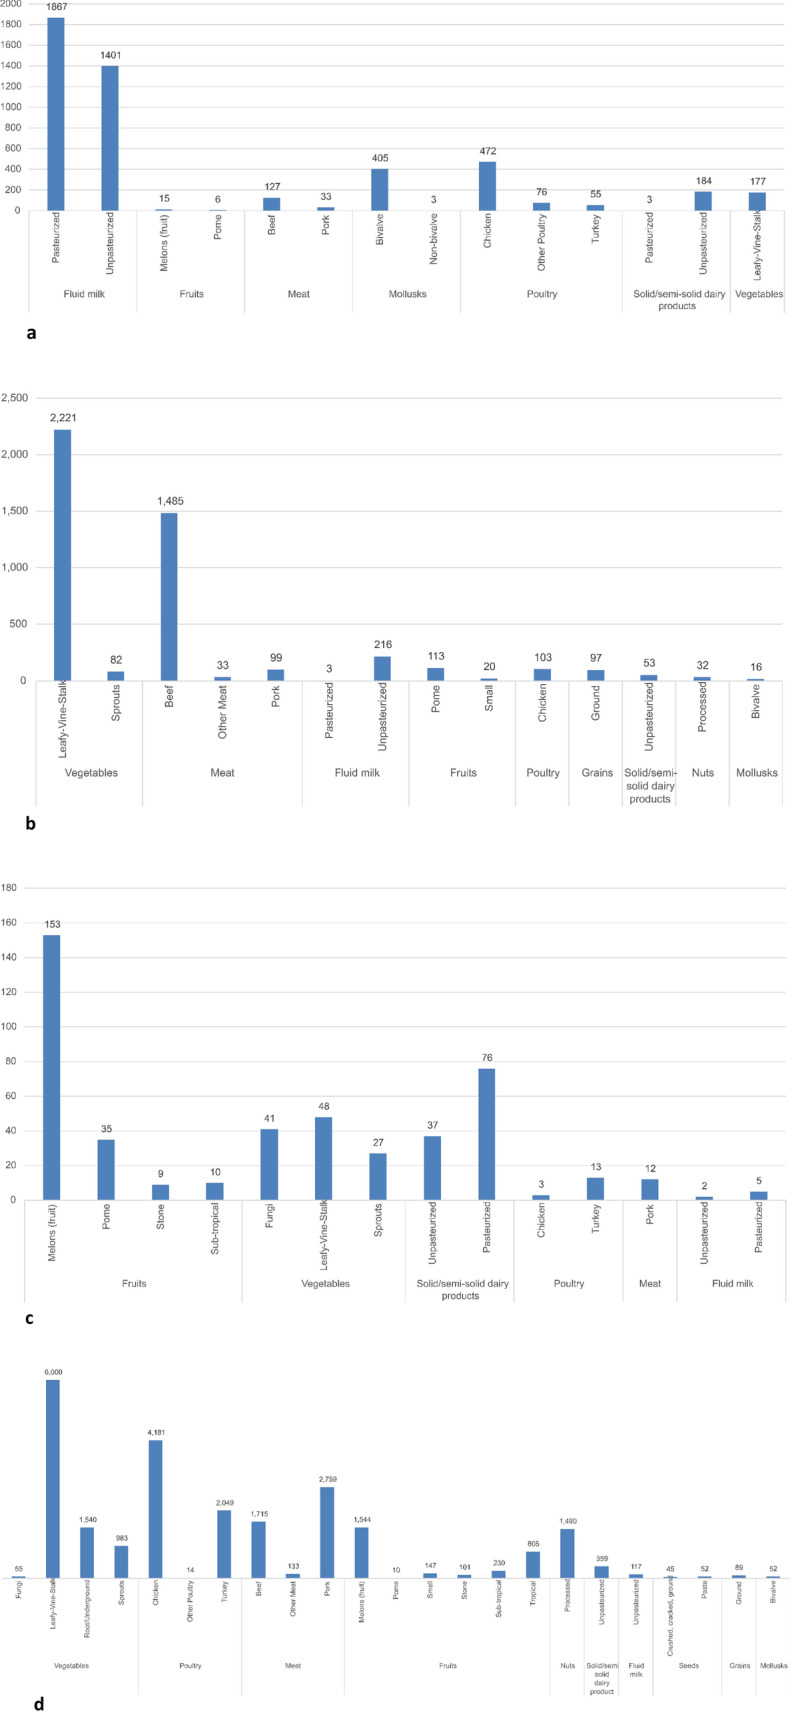
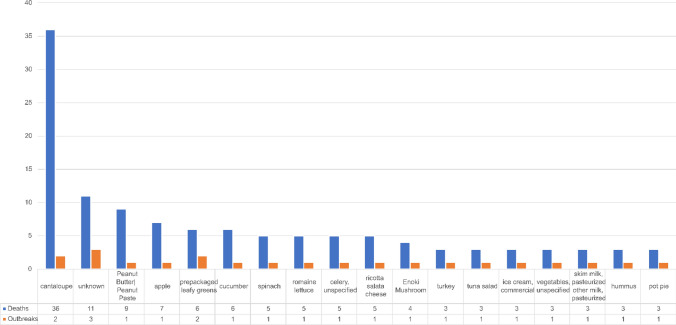
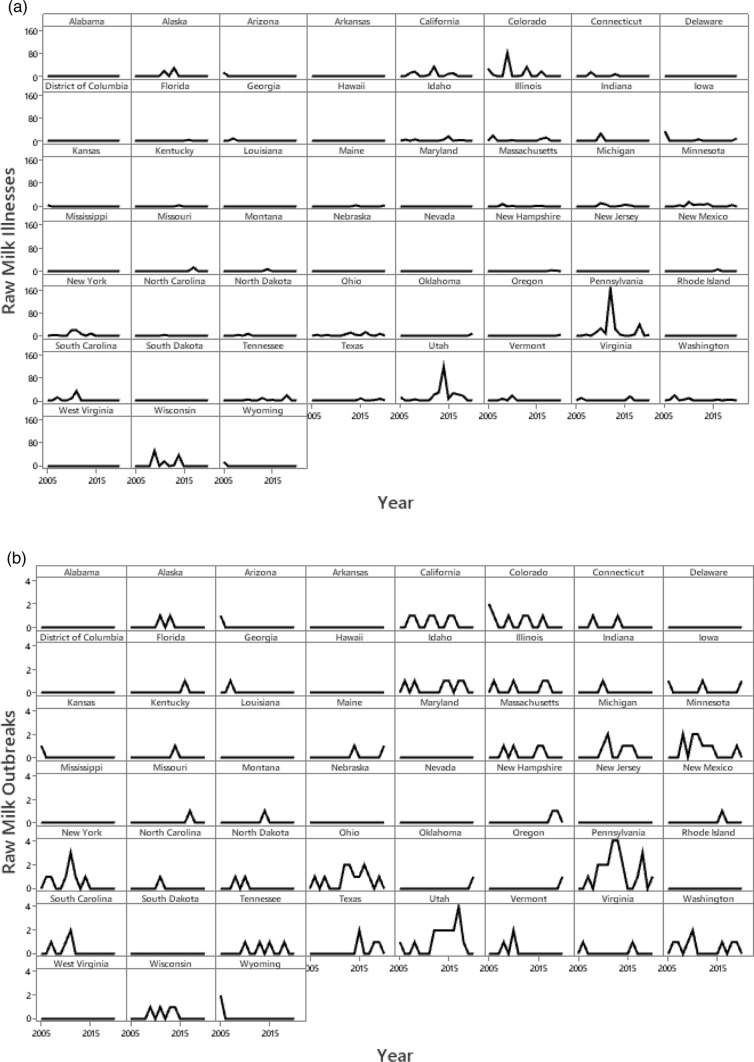
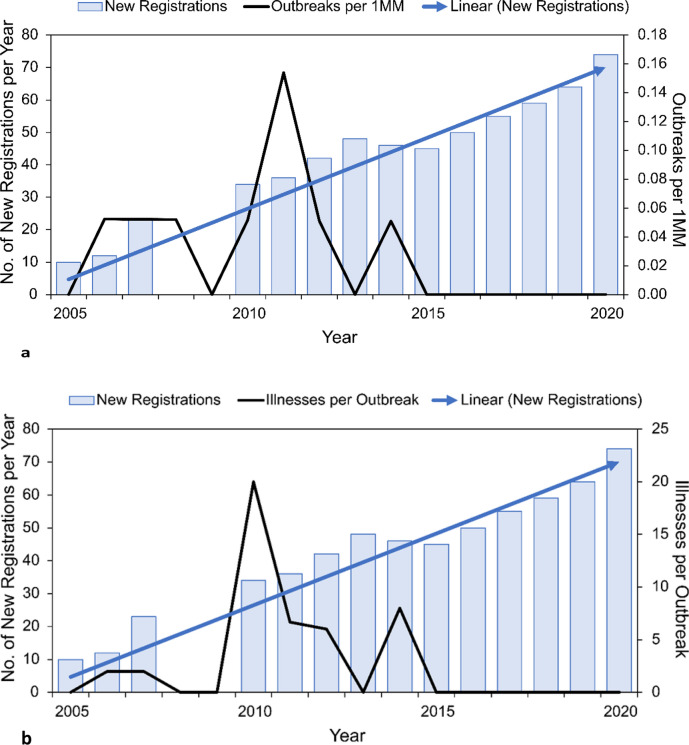
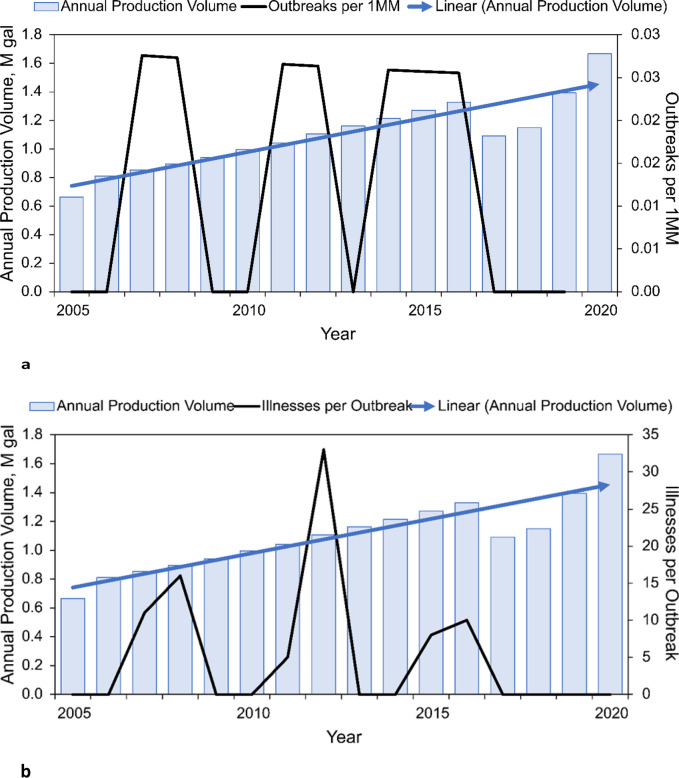
Results: The evidence does not support increasing trends in the burden of infectious foodborne disease, though strongly increasing trends were observed for other transmission sources. Morbidity and mortality were dominated by person-to-person transmission; foodborne and other transmission sources accounted for small portions of the disease burden. Foods representing the greatest hazards associated with the four major foodborne bacterial diseases were identified. Fatal foodborne disease was dominated by fruits, vegetables, peanut butter, and pasteurized dairy.
Conclusion: The available evidence conflicts with assumptions of zero risk for pasteurized milk and increasing trends in the burden of illness for raw milk. For future evidence-based risk management, transdisciplinary risk analysis methodologies are essential to balance both communicable and non-communicable diseases and both food safety and food security, considering scientific, sustainable, economic, cultural, social, and political factors to support health and wellness for humans and ecosystems.
Keywords: Etiology; Food safety; Food security; Interagency Food Safety Analytics Collaboration (IFSAC) food category; National Outbreak Reporting System (NORS).
© 2024. The Author(s).
Conflict of interest statement
The authors declare the following competing interests. Financial interests: MEC and NAA have served and continue to serve as independent consultants, including industry-funded projects. MEC has received a speaking fee, travel reimbursement, and compensation from WAPF for preparing analyses. MEC and MMS received support for preparing analyses from Raw Milk Institute, including travel reimbursement for MEC. NAA received compensation for analyzing a prior epidemiologic dataset from the Raw Milk Institute. MEC and NAA provided paid expert testimony in a court case related to access to raw milk in Ontario, Canada, MEC regarding microbial ecology and benefit-risk analysis, NAA regarding statistical analysis. MEC, NAA, and MMS received partial support for their work preparing this manuscript from the Foundation for Agricultural Integrity and Churchtown Dairy, the Raw Milk Institute, and the Weston A. Price Foundation. Non-financial interests: MEC serves on the Advisory Board of the Raw Milk Institute and as an elected Councilor of the Society for Risk Analysis and receives no compensation for this service. MEC and NAA have provided paid expert testimony in their fields for various court cases, as noted in the financial interests declaration.
Figures
References
-
- World Health Organization (WHO) Global Health estimates 2020: disease burden by cause, age, sex, by country and by region, 2000–2019. https://www.who.int/data/gho/data/themes/mortality-and-global-health-est.... Accessed 17 Mar 2023.
-
- Cox LA. Shapes and definitions of exposure-response curves: a comment on “A matrix for bridging the epidemiology and risk assessment gap.” Glob Epidemiol. 2019;1: 100006. 10.1016/j.gloepi.2019.100006. - DOI
-
- Mokhtari A, Pang H, Santillana Farakos S, McKenna C, Crowley C, Cranford V, Bowen A, Phillips S, Madad A, Obenhuber D, et al. Leveraging risk assessment for foodborne outbreak investigations: the quantitative risk assessment-epidemic curve prediction model. Risk Anal. 2023;43:324–38. 10.1111/risa.13896. - DOI - PubMed
MeSH terms
LinkOut - more resources
Full Text Sources
Medical
