

Robust thalamic nuclei segmentation from T1-weighted MRI using polynomial intensity transformation
- PMID: 38546872
- PMCID: PMC11147736
- DOI: 10.1007/s00429-024-02777-5
Robust thalamic nuclei segmentation from T1-weighted MRI using polynomial intensity transformation
Abstract
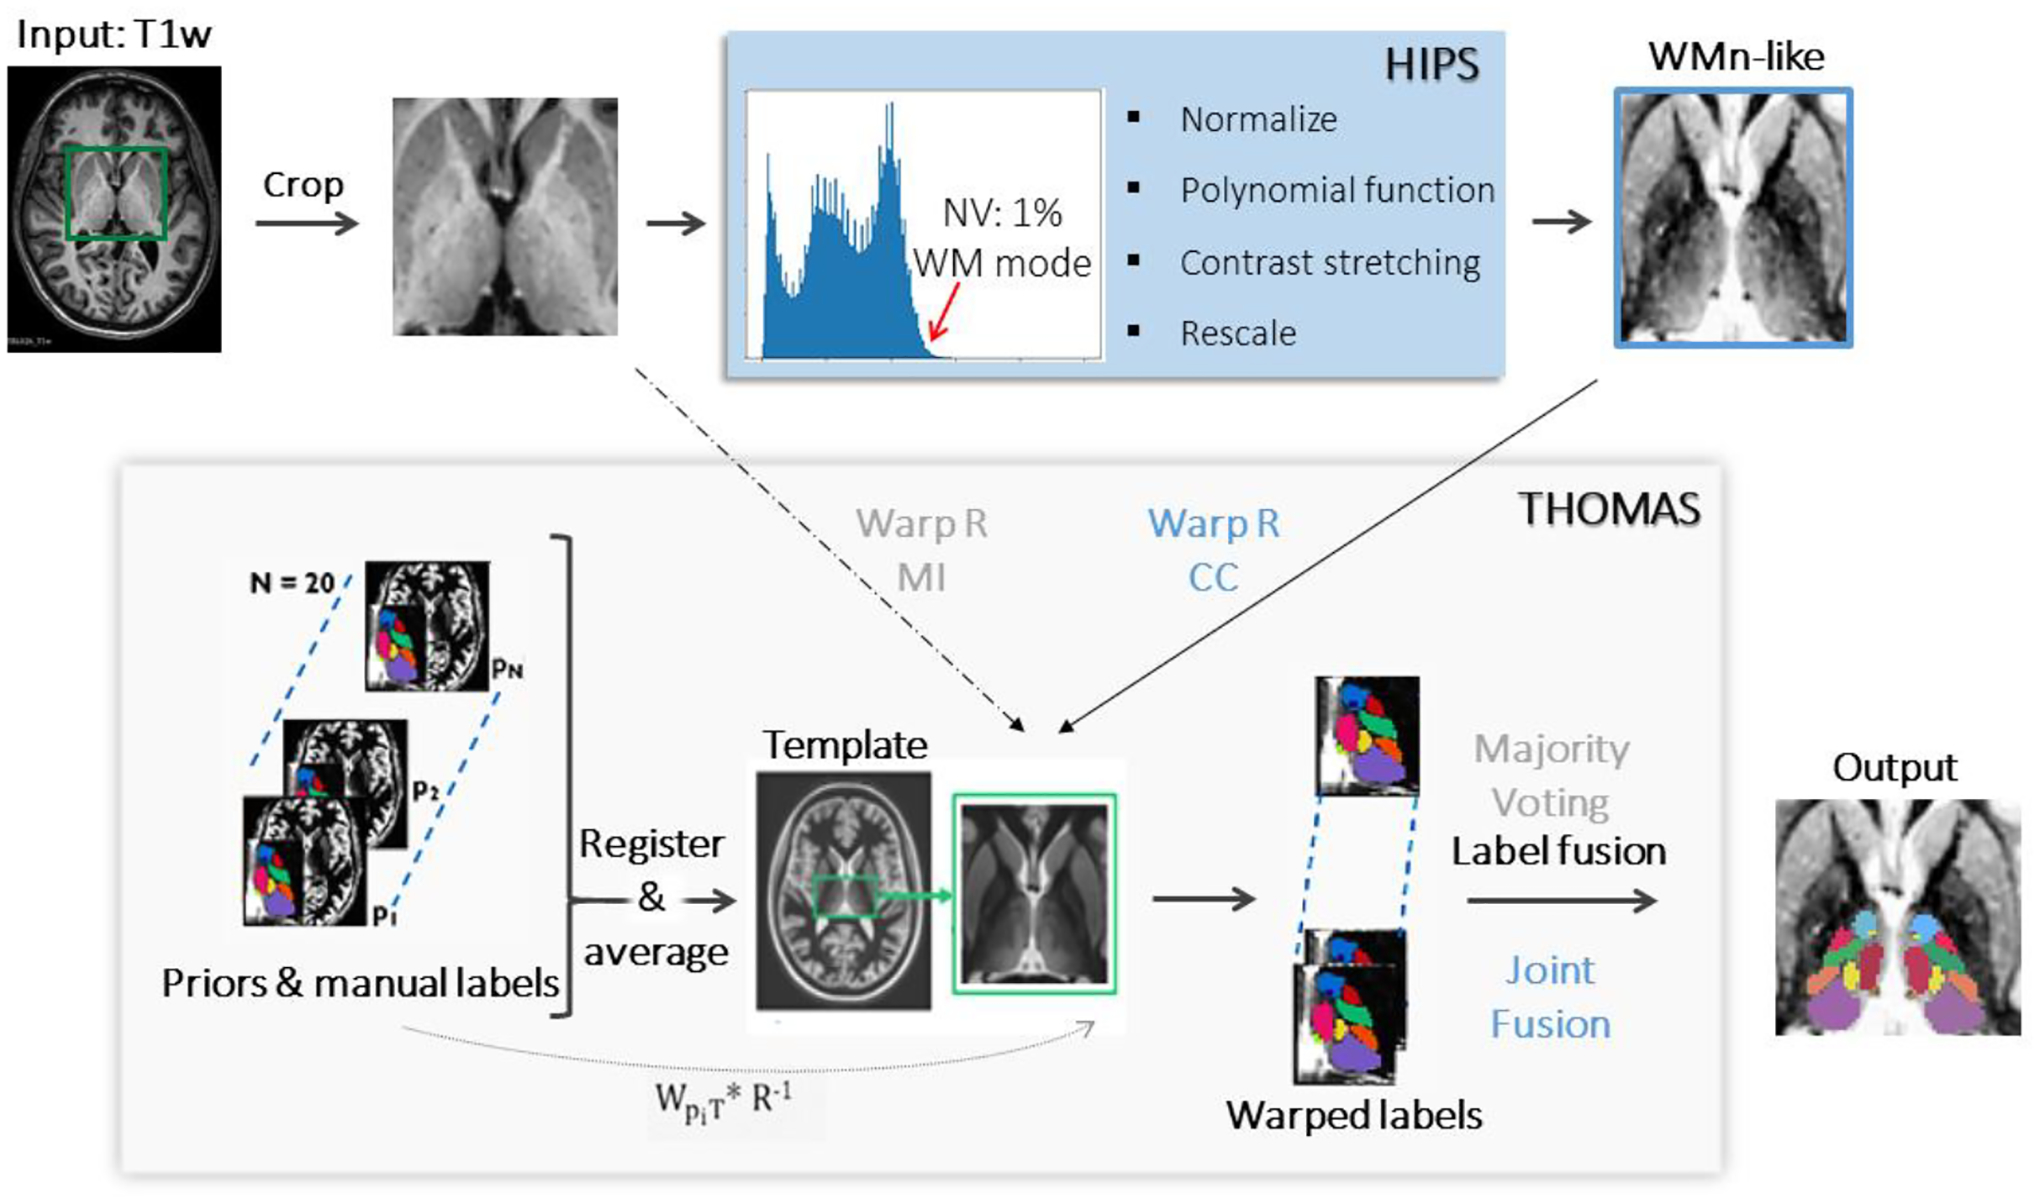
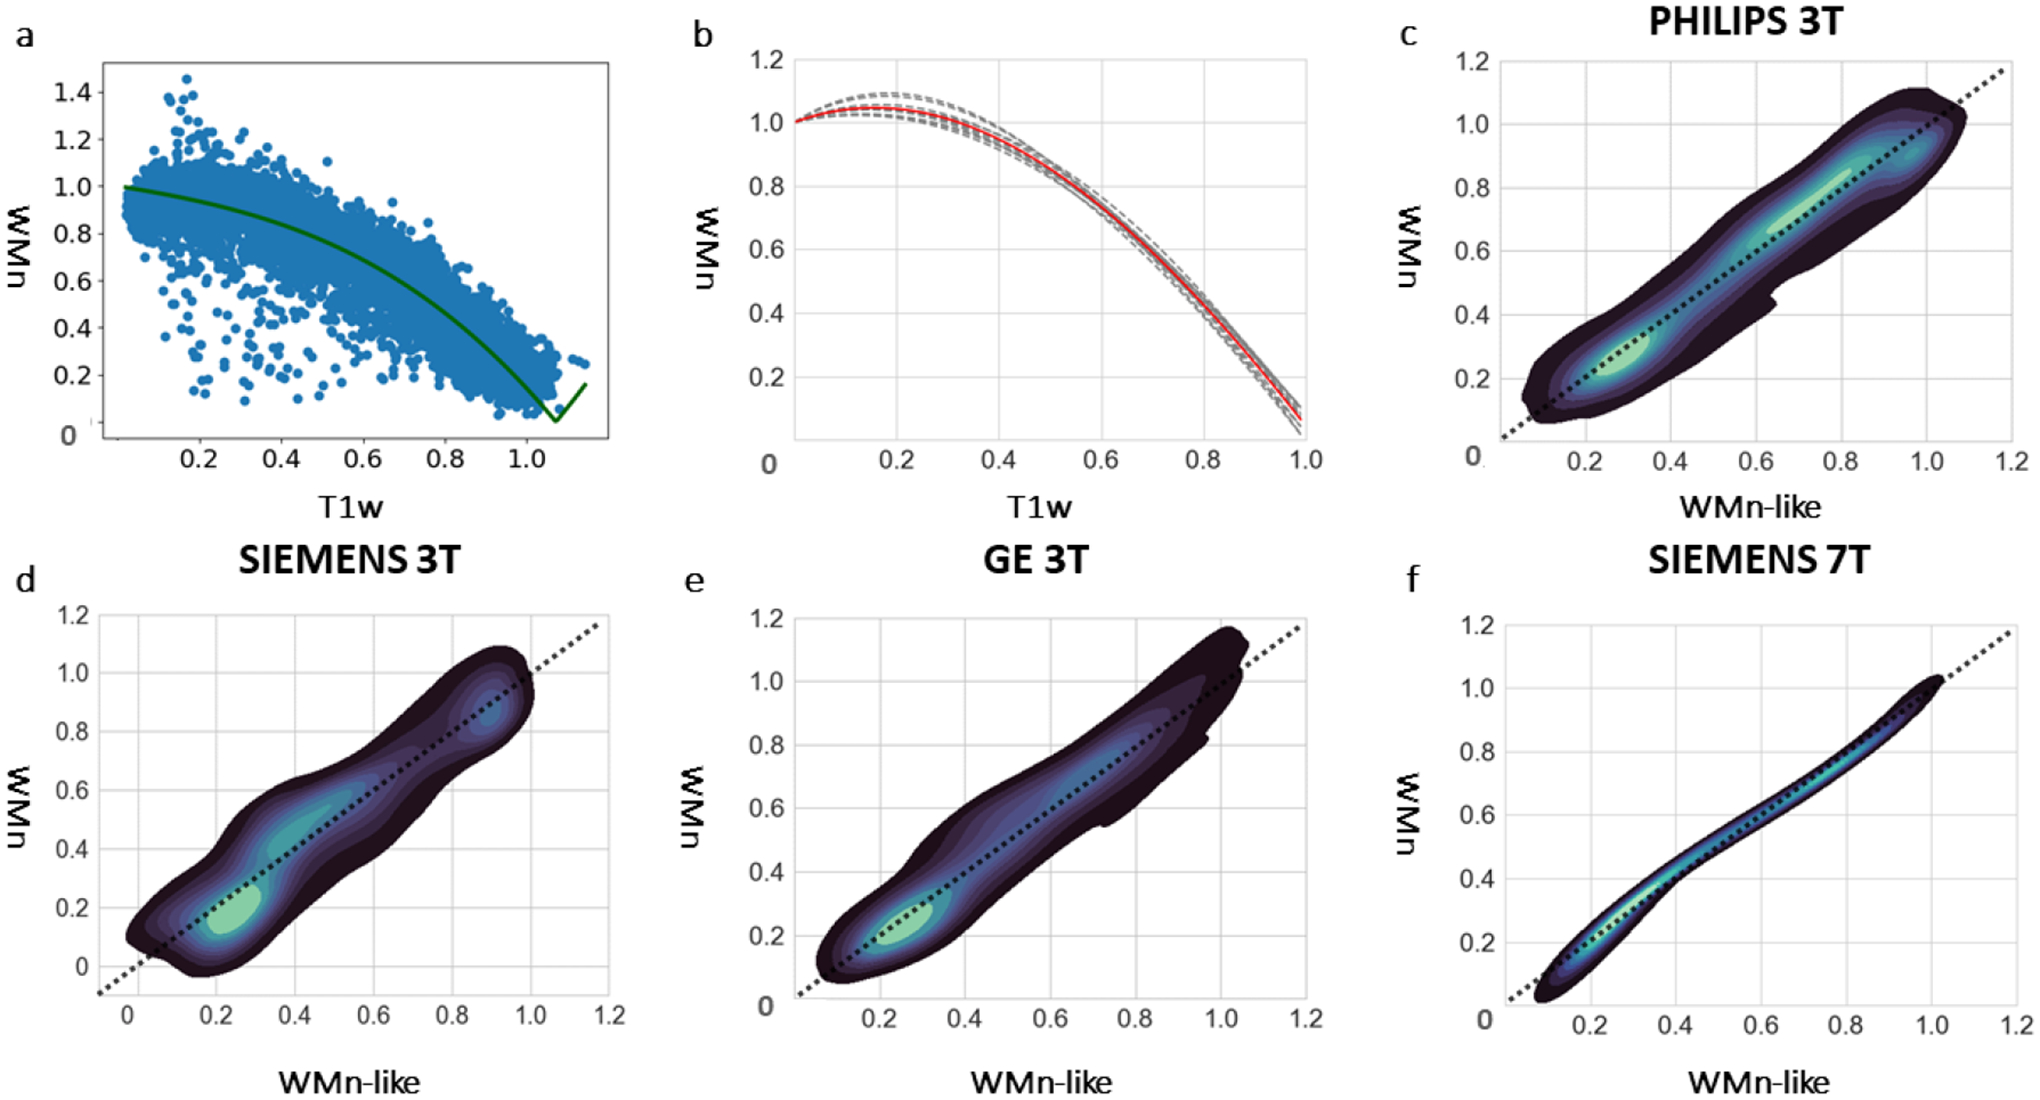
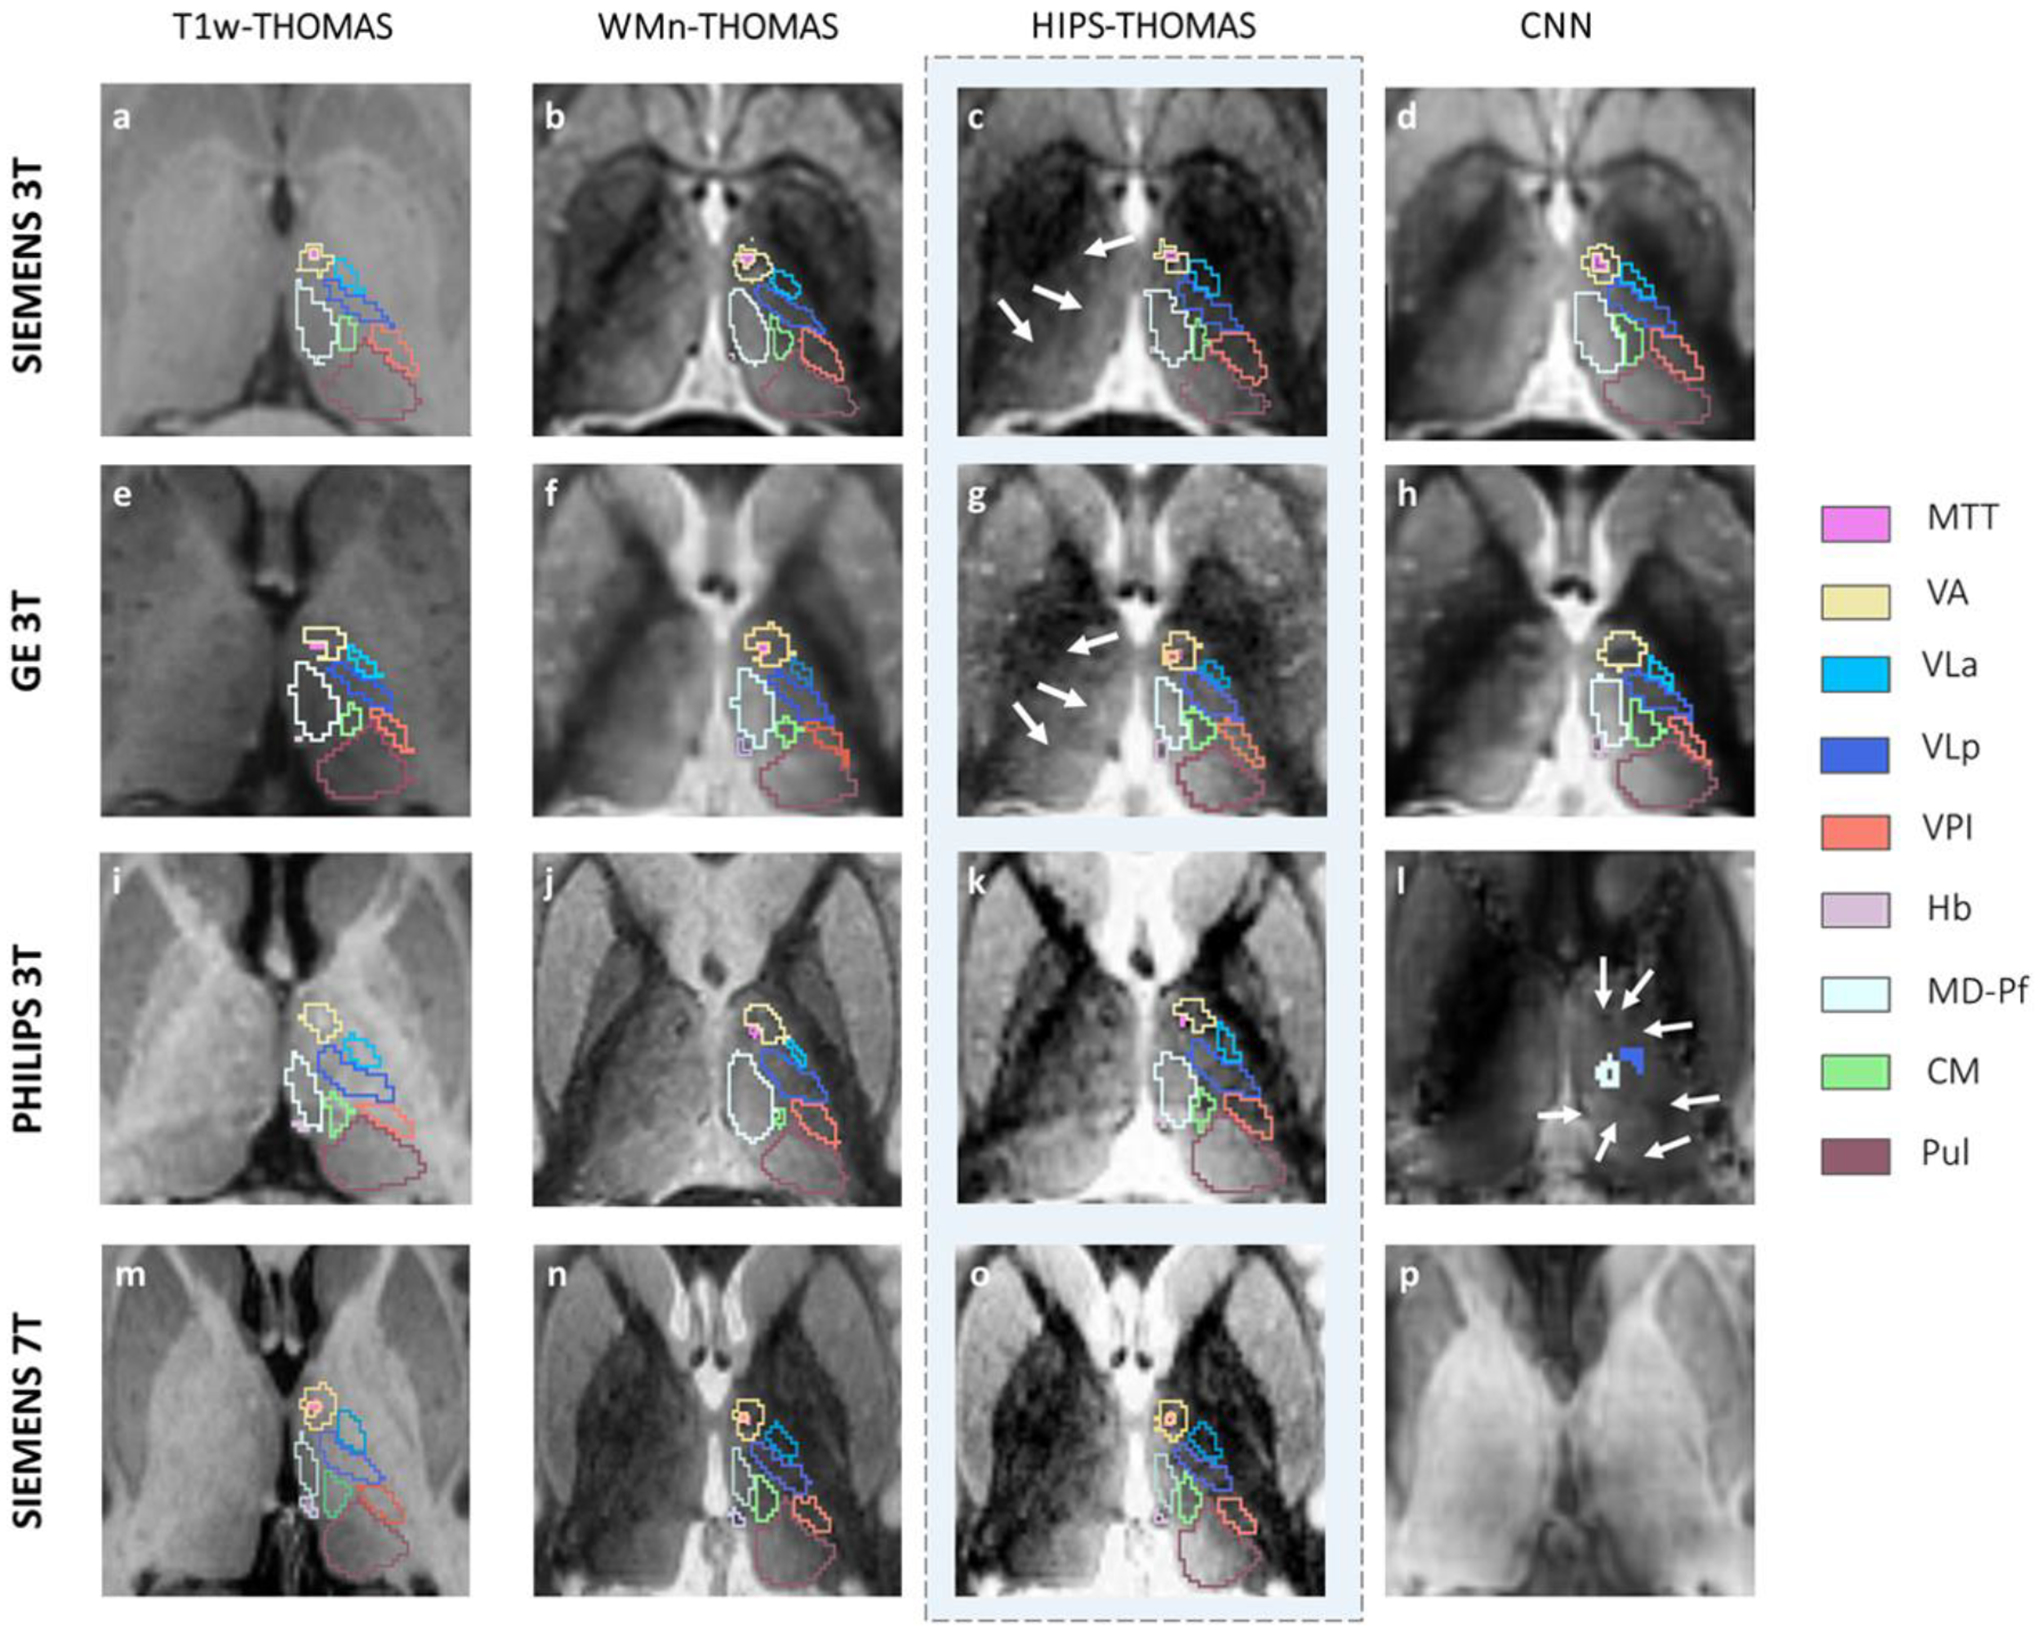
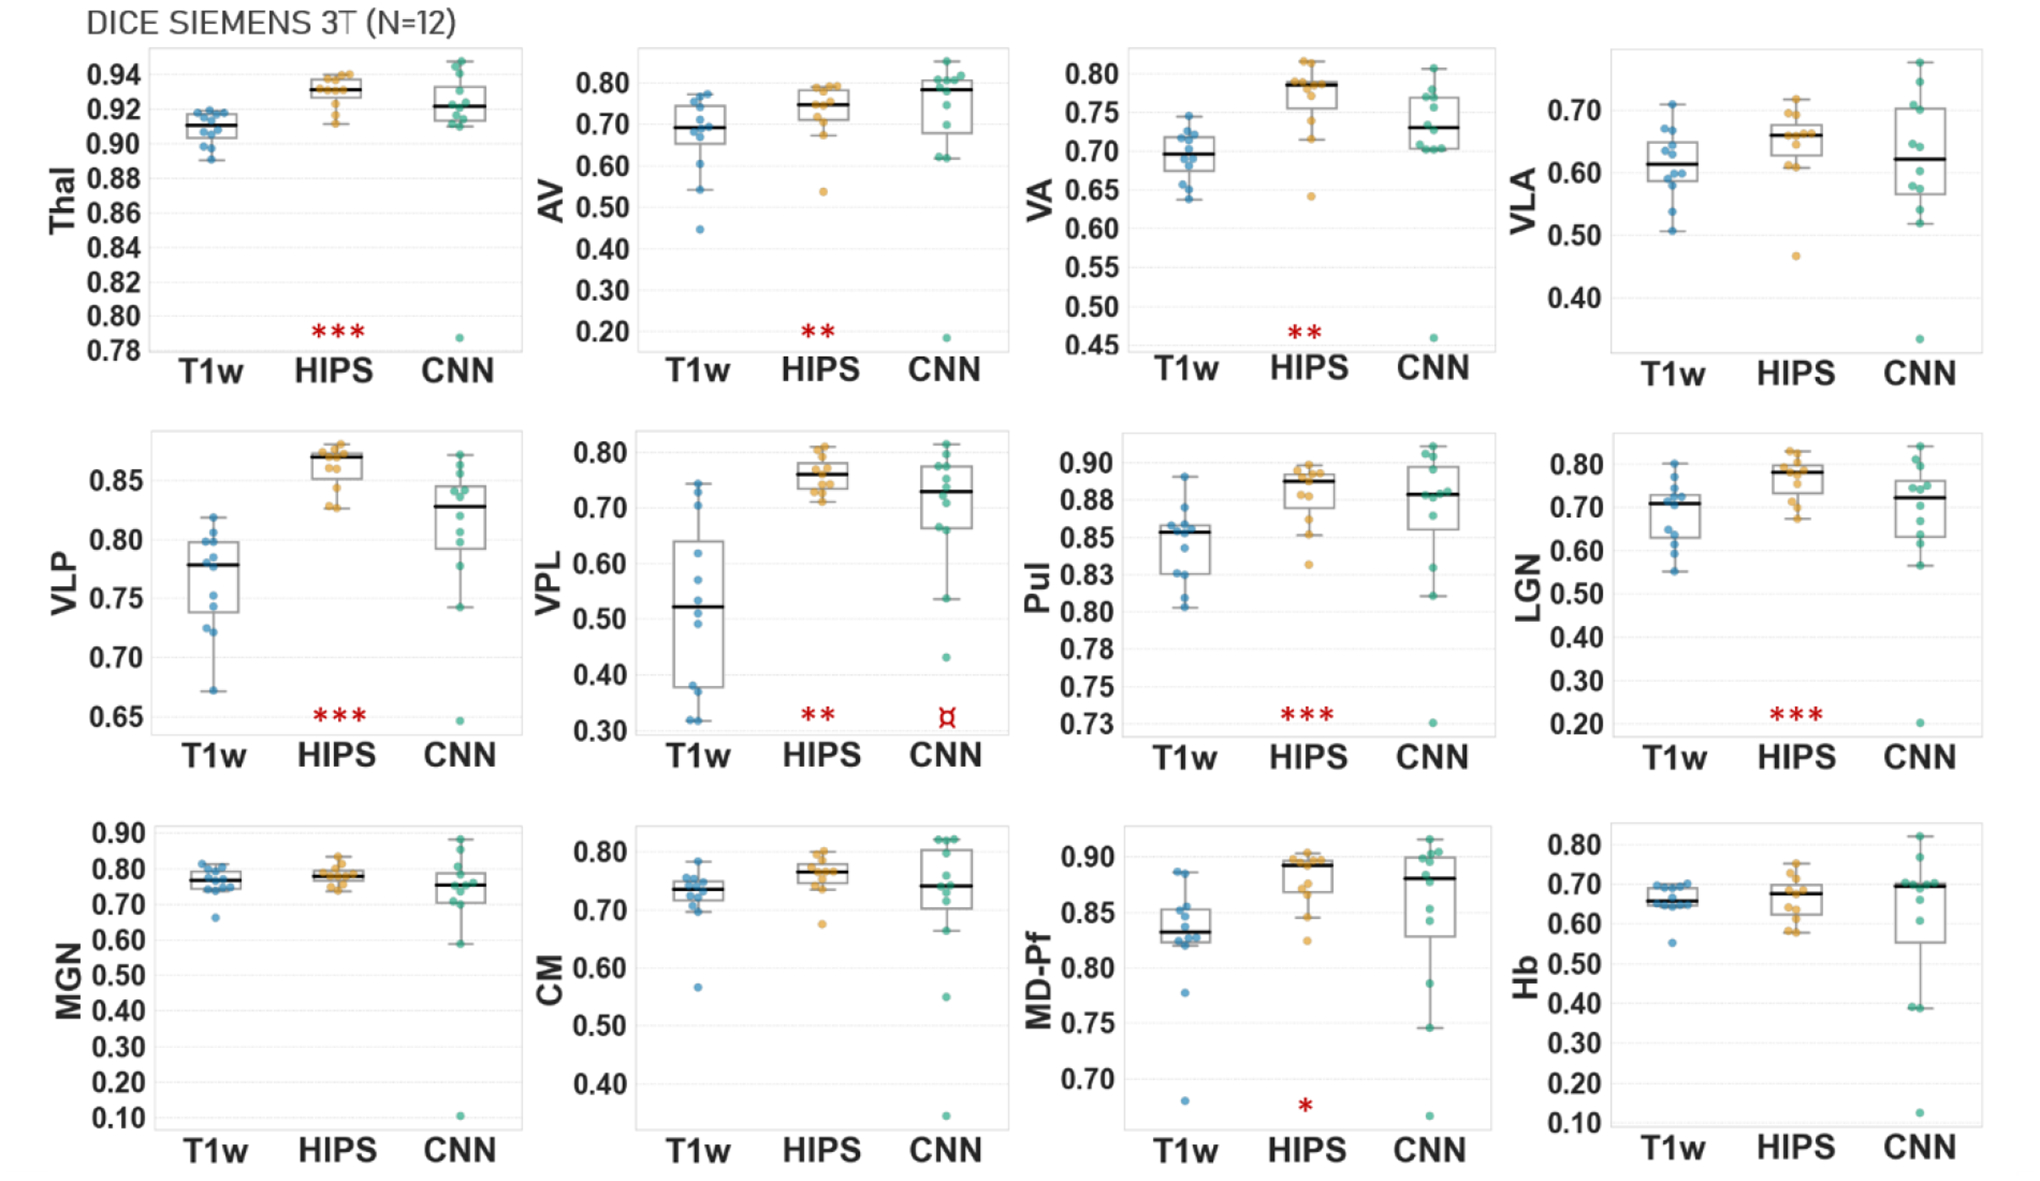
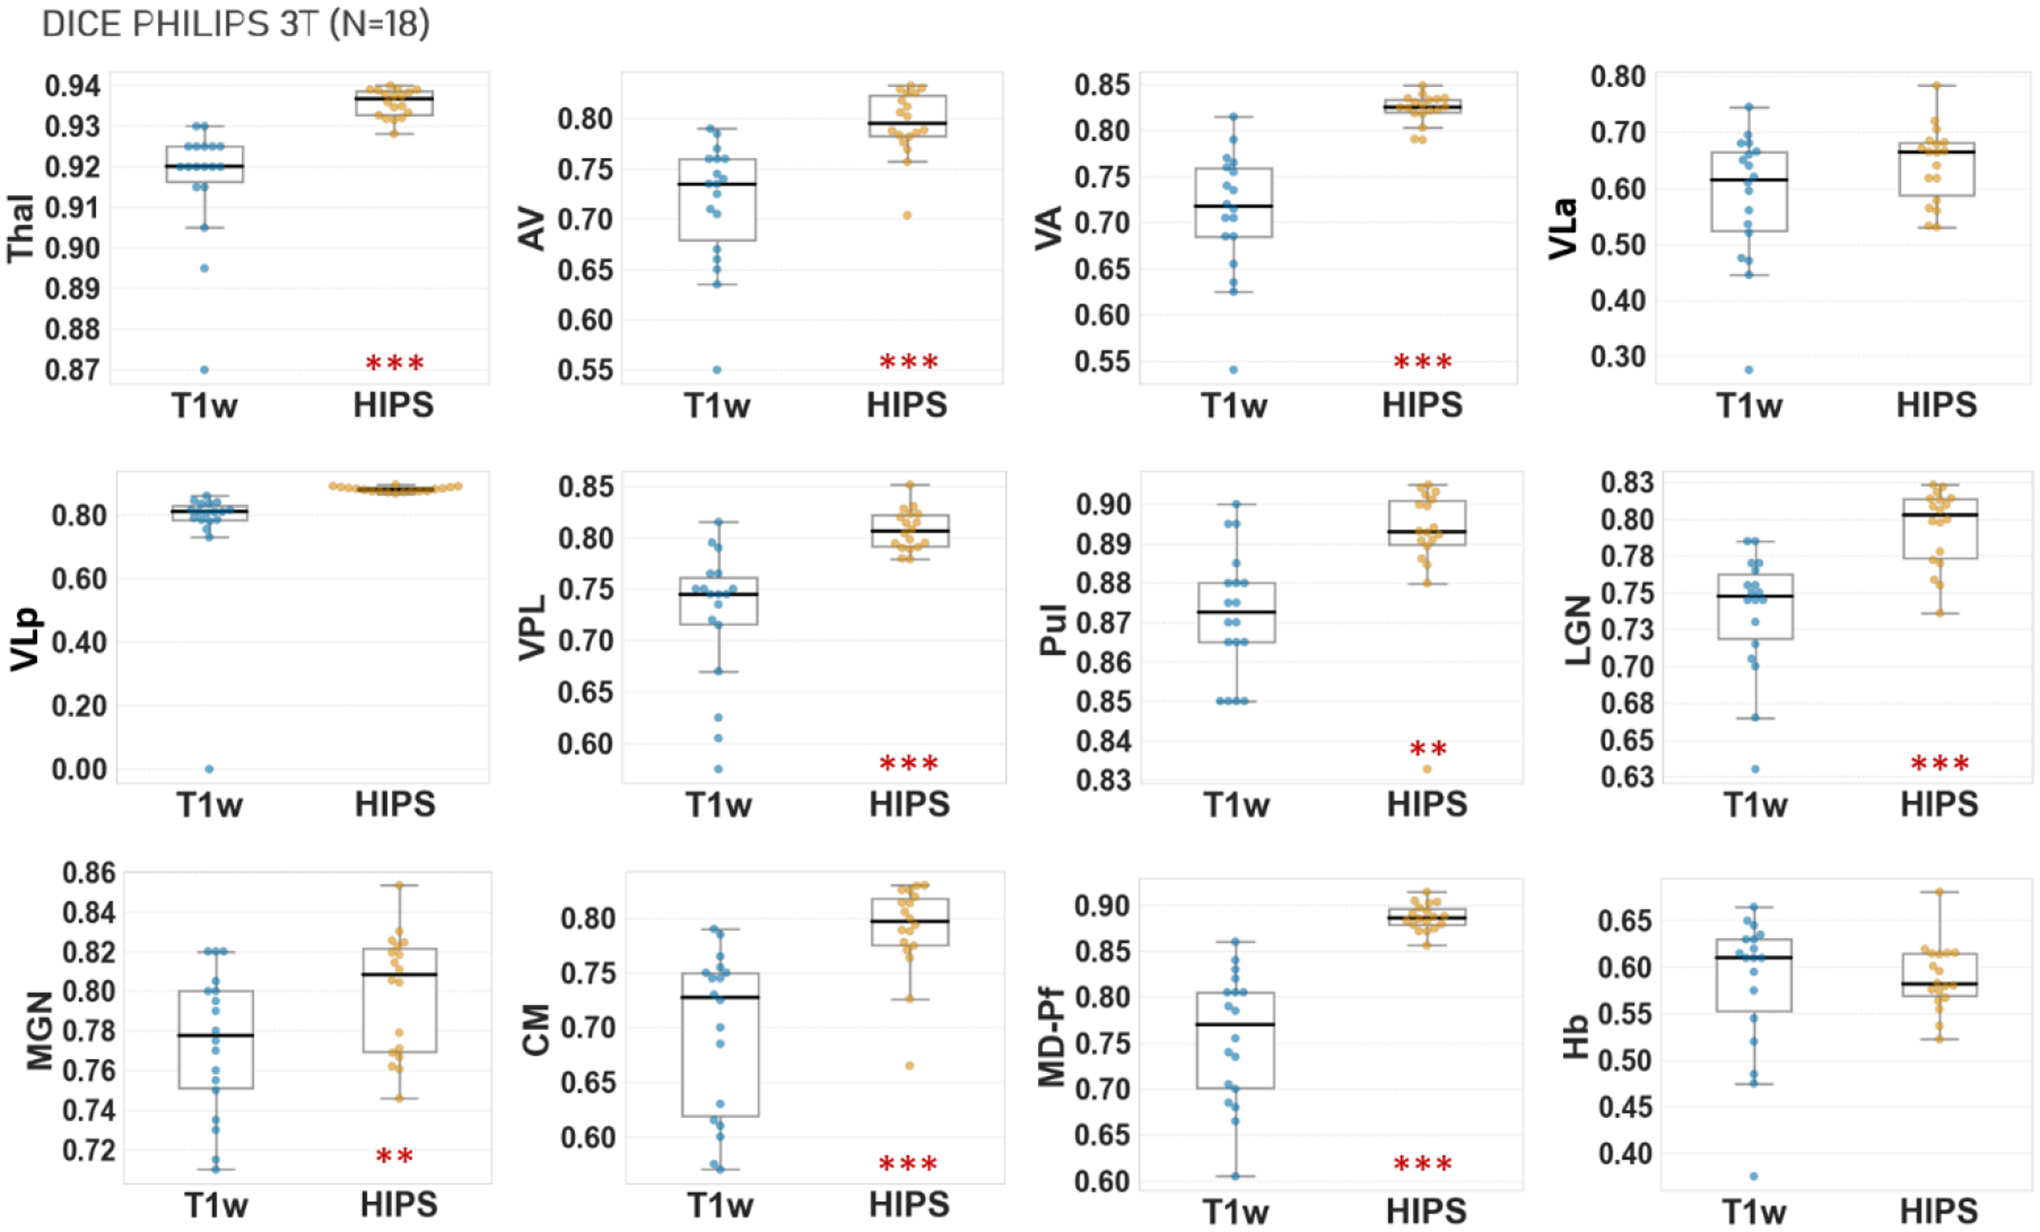
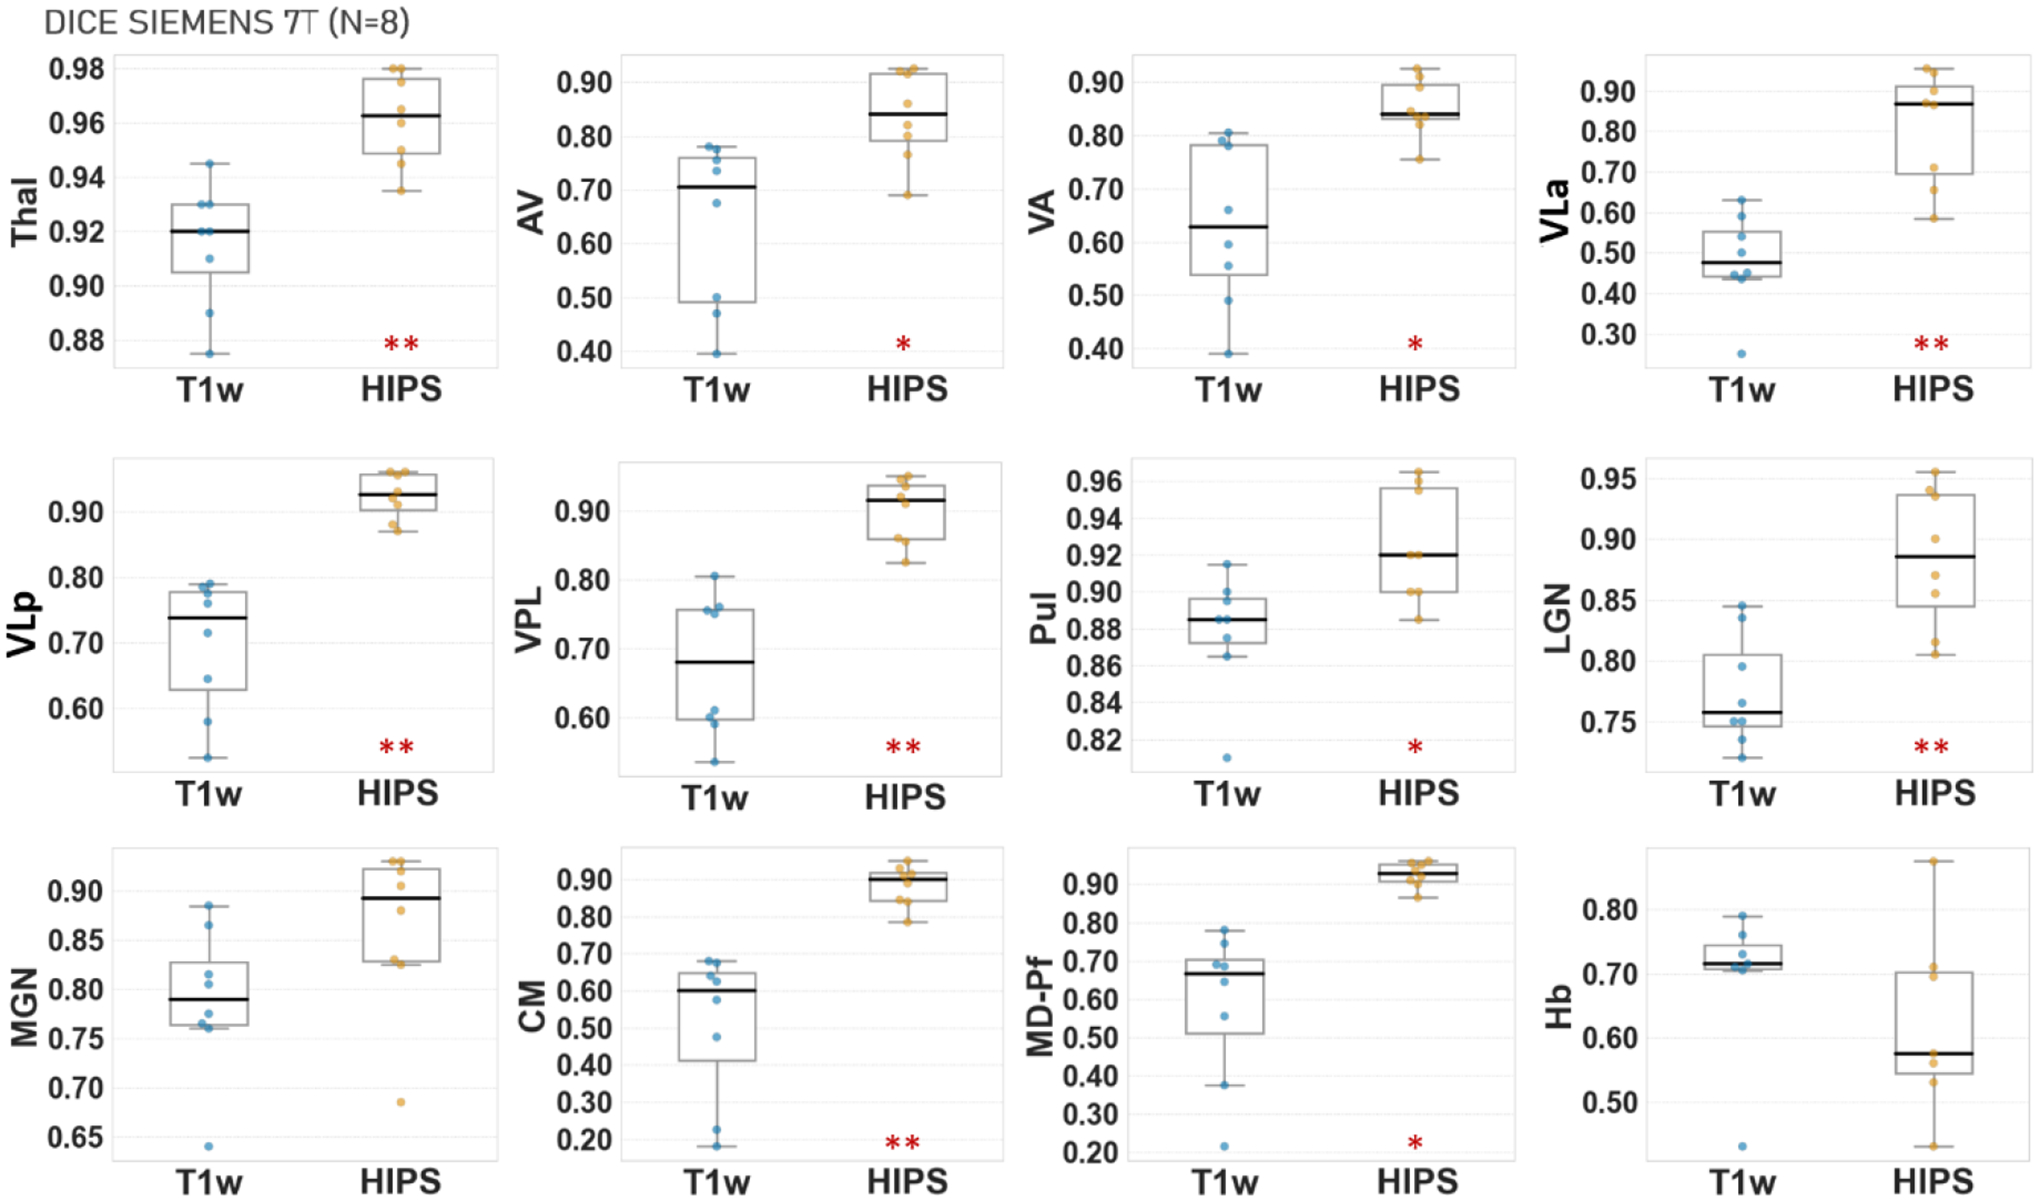
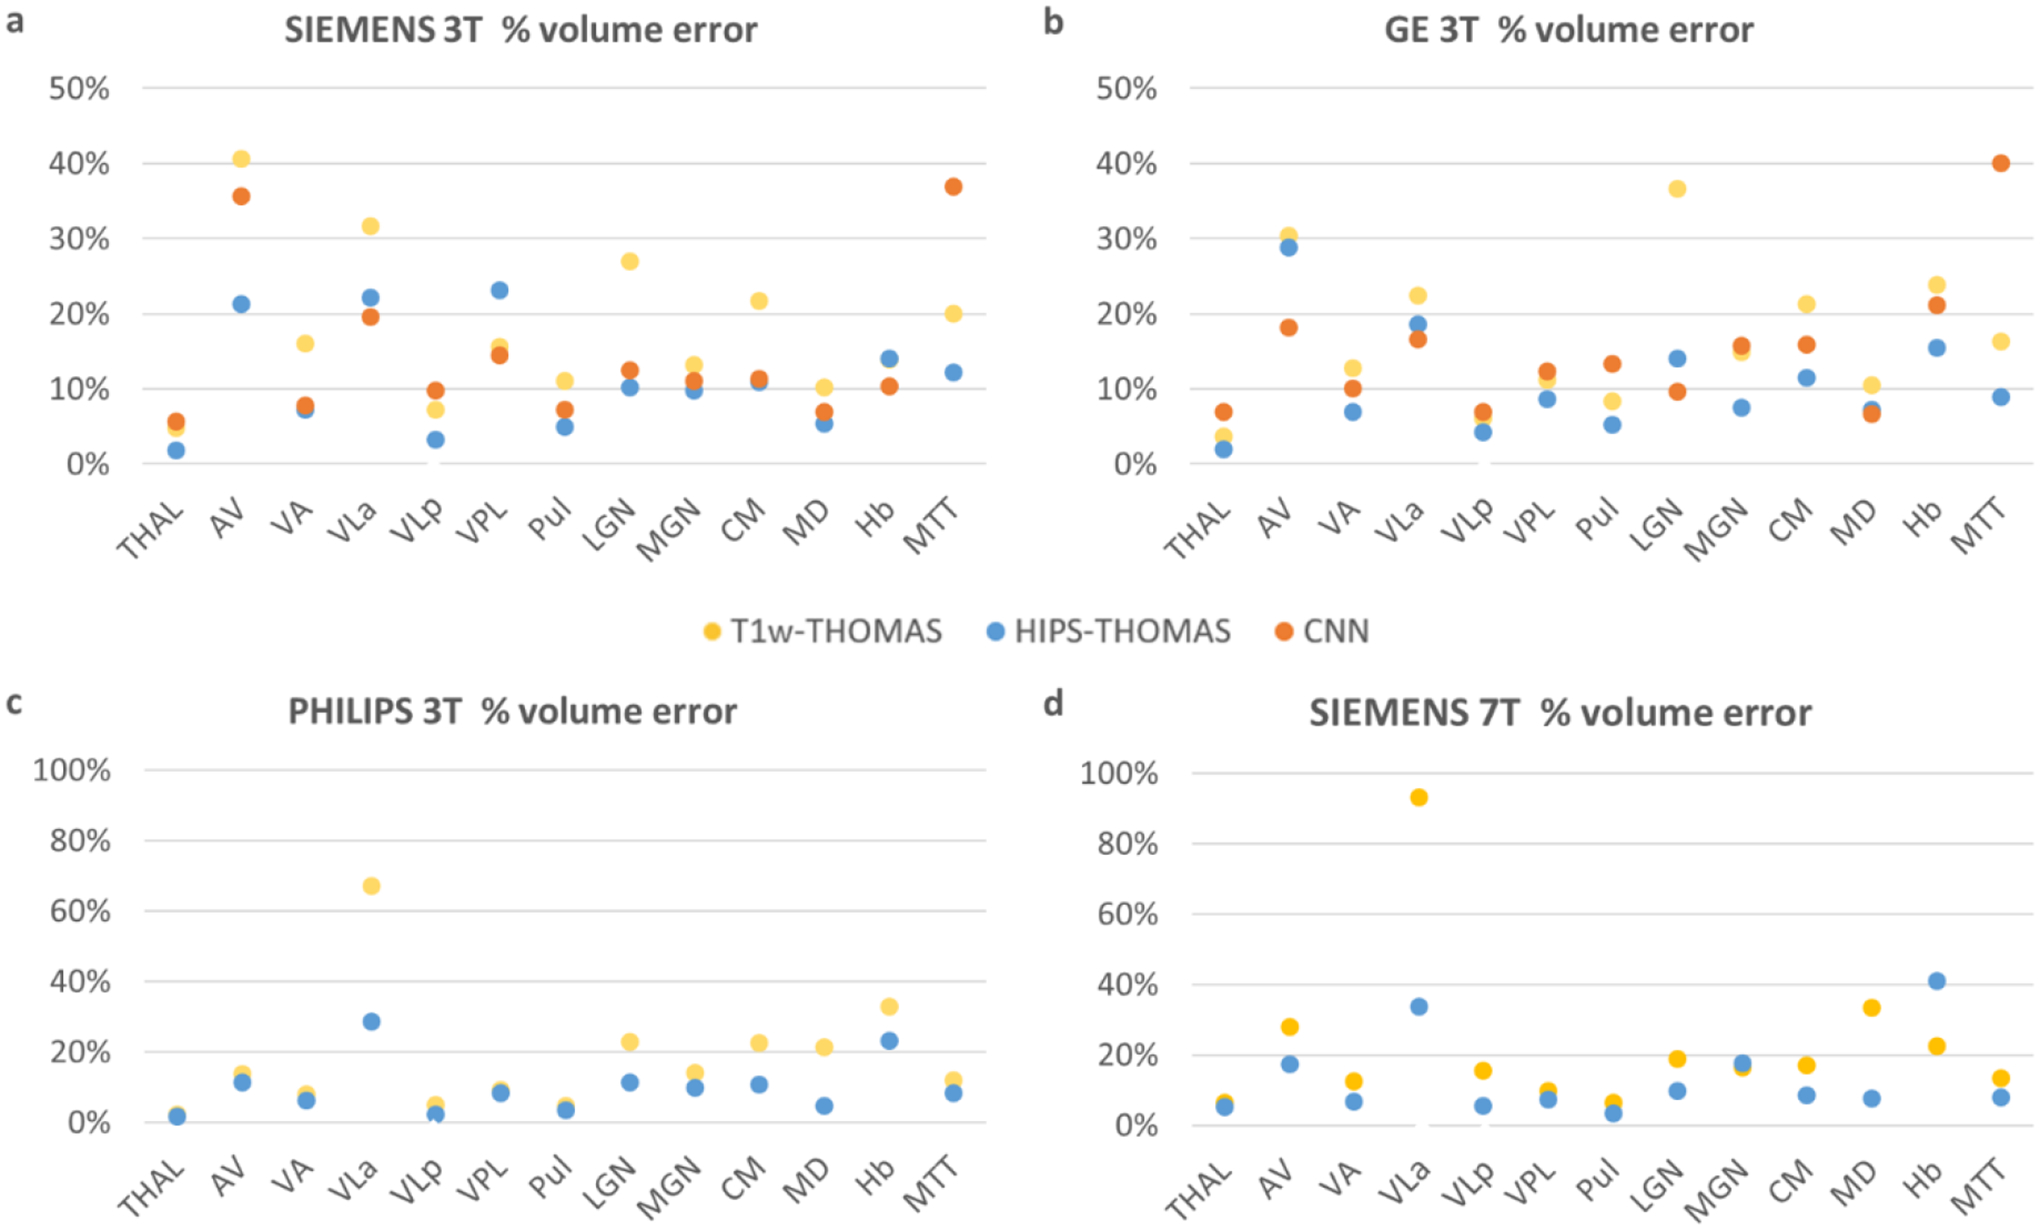
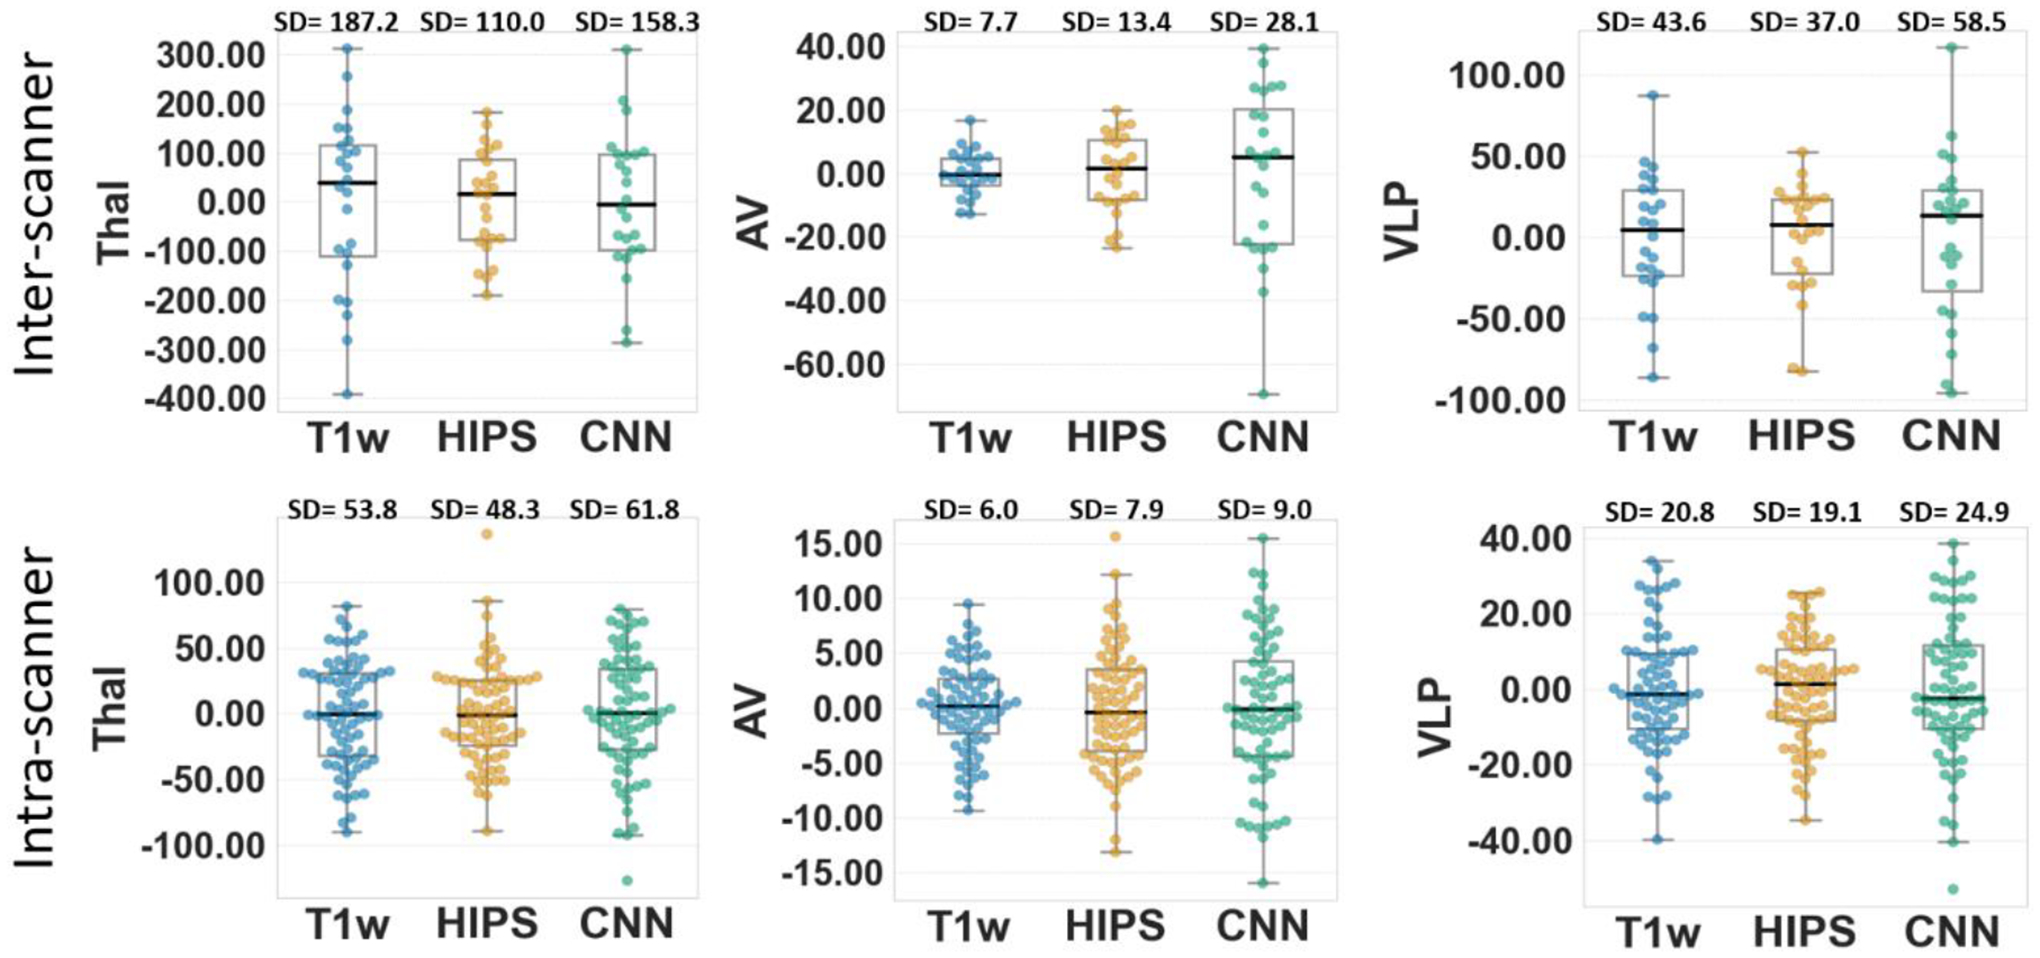
Accurate segmentation of thalamic nuclei, crucial for understanding their role in healthy cognition and in pathologies, is challenging to achieve on standard T1-weighted (T1w) magnetic resonance imaging (MRI) due to poor image contrast. White-matter-nulled (WMn) MRI sequences improve intrathalamic contrast but are not part of clinical protocols or extant databases. In this study, we introduce histogram-based polynomial synthesis (HIPS), a fast preprocessing transform step that synthesizes WMn-like image contrast from standard T1w MRI using a polynomial approximation for intensity transformation. HIPS was incorporated into THalamus Optimized Multi-Atlas Segmentation (THOMAS) pipeline, a method developed and optimized for WMn MRI. HIPS-THOMAS was compared to a convolutional neural network (CNN)-based segmentation method and THOMAS modified for the use of T1w images (T1w-THOMAS). The robustness and accuracy of the three methods were tested across different image contrasts (MPRAGE, SPGR, and MP2RAGE), scanner manufacturers (PHILIPS, GE, and Siemens), and field strengths (3 T and 7 T). HIPS-transformed images improved intra-thalamic contrast and thalamic boundaries, and HIPS-THOMAS yielded significantly higher mean Dice coefficients and reduced volume errors compared to both the CNN method and T1w-THOMAS. Finally, all three methods were compared using the frequently travelling human phantom MRI dataset for inter- and intra-scanner variability, with HIPS displaying the least inter-scanner variability and performing comparably with T1w-THOMAS for intra-scanner variability. In conclusion, our findings highlight the efficacy and robustness of HIPS in enhancing thalamic nuclei segmentation from standard T1w MRI.
Keywords: Structural imaging; THOMAS; Thalamic nuclei segmentation; Thalamus.
© 2024. The Author(s), under exclusive licence to Springer-Verlag GmbH Germany, part of Springer Nature.
Conflict of interest statement
Competing interests’ statement: The authors have no conflicts of interest relevant to this manuscript to disclose.
Figures


Update of
-
Robust thalamic nuclei segmentation from T1-weighted MRI using polynomial intensity transformation.medRxiv [Preprint]. 2024 Feb 1:2024.01.30.24301606. doi: 10.1101/2024.01.30.24301606. medRxiv. 2024. Update in: Brain Struct Funct. 2024 Jun;229(5):1087-1101. doi: 10.1007/s00429-024-02777-5. PMID: 38352493 Free PMC article. Updated. Preprint.
Similar articles
-
Robust thalamic nuclei segmentation from T1-weighted MRI using polynomial intensity transformation.medRxiv [Preprint]. 2024 Feb 1:2024.01.30.24301606. doi: 10.1101/2024.01.30.24301606. medRxiv. 2024. Update in: Brain Struct Funct. 2024 Jun;229(5):1087-1101. doi: 10.1007/s00429-024-02777-5. PMID: 38352493 Free PMC article. Updated. Preprint.
-
Convolutional Neural Network Based Frameworks for Fast Automatic Segmentation of Thalamic Nuclei from Native and Synthesized Contrast Structural MRI.Neuroinformatics. 2022 Jul;20(3):651-664. doi: 10.1007/s12021-021-09544-5. Epub 2021 Oct 9. Neuroinformatics. 2022. PMID: 34626333 Free PMC article.
-
Fast automatic segmentation of thalamic nuclei from MP2RAGE acquisition at 7 Tesla.Magn Reson Med. 2021 May;85(5):2781-2790. doi: 10.1002/mrm.28608. Epub 2020 Dec 3. Magn Reson Med. 2021. PMID: 33270943
-
Automated thalamic nuclei segmentation using multi-planar cascaded convolutional neural networks.Magn Reson Imaging. 2020 Nov;73:45-54. doi: 10.1016/j.mri.2020.08.005. Epub 2020 Aug 21. Magn Reson Imaging. 2020. PMID: 32828985 Free PMC article.
-
Performance of Convolutional Neural Network Models in Meningioma Segmentation in Magnetic Resonance Imaging: A Systematic Review and Meta-Analysis.Neuroinformatics. 2025 Jan;23(1):14. doi: 10.1007/s12021-024-09704-3. Epub 2024 Dec 28. Neuroinformatics. 2025. PMID: 39777602 Free PMC article.
Cited by
-
Prior-guided individualized thalamic parcellation based on local diffusion characteristics.Hum Brain Mapp. 2024 Mar;45(4):e26646. doi: 10.1002/hbm.26646. Hum Brain Mapp. 2024. PMID: 38433705 Free PMC article.
-
Aging, HIV infection, and alcohol exert synergist effects on regional thalamic volumes resulting in functional impairment.Neuroimage Clin. 2024;44:103684. doi: 10.1016/j.nicl.2024.103684. Epub 2024 Oct 12. Neuroimage Clin. 2024. PMID: 39423567 Free PMC article.
-
Interindividual Variability In Memory Performance Is Related To Cortico-Thalamic Networks During Memory Encoding And Retrieval.J Neurosci. 2025 Mar 27;45(19):e0975242025. doi: 10.1523/JNEUROSCI.0975-24.2025. Online ahead of print. J Neurosci. 2025. PMID: 40147936
-
Evaluating the effective segmentation of human lateral geniculate nucleus.Brain Struct Funct. 2025 Aug 25;230(7):140. doi: 10.1007/s00429-025-03000-9. Brain Struct Funct. 2025. PMID: 40853493
-
Factors behind poor cognitive outcome following a thalamic stroke.J Neurol. 2025 Jan 7;272(1):98. doi: 10.1007/s00415-024-12777-4. J Neurol. 2025. PMID: 39775143 Free PMC article.
References
-
- Morel A, Magnin M & Jeanmonod D Multiarchitectonic and stereotactic atlas of the human thalamus. J. Comp. Neurol 387:588–630 (1997). - PubMed
-
- Andreasen NC The evolving concept of schizophrenia: from Kraepelin to the present and future. Schizophrenia research, 28(2–3), 105–109 (1997). - PubMed
-
- Braak H, & Braak E Demonstration of amyloid deposits and neurofibrillary changes in whole brain sections. Brain pathology, 1(3), 213–216 (1991). - PubMed
MeSH terms
Grants and funding
LinkOut - more resources
Full Text Sources
Medical
