. 2024 Apr 2;121(14):e2315509121.
doi: 10.1073/pnas.2315509121. Epub 2024 Mar 28.

The MUC1-HIF-1α signaling axis regulates pancreatic cancer pathogenesis through polyamine metabolism remodeling

Affiliations

The MUC1-HIF-1α signaling axis regulates pancreatic cancer pathogenesis through polyamine metabolism remodeling

Divya Murthy et al. Proc Natl Acad Sci U S A. .

Abstract

Dysregulation of polyamine metabolism has been implicated in cancer initiation and progression; however, the mechanism of polyamine dysregulation in cancer is not fully understood. In this study, we investigated the role of MUC1, a mucin protein overexpressed in pancreatic cancer, in regulating polyamine metabolism. Utilizing pancreatic cancer patient data, we noted a positive correlation between MUC1 expression and the expression of key polyamine metabolism pathway genes. Functional studies revealed that knockdown of spermidine/spermine N1-acetyltransferase 1 (SAT1), a key enzyme involved in polyamine catabolism, attenuated the oncogenic functions of MUC1, including cell survival and proliferation. We further identified a regulatory axis whereby MUC1 stabilized hypoxia-inducible factor (HIF-1α), leading to increased SAT1 expression, which in turn induced carbon flux into the tricarboxylic acid cycle. MUC1-mediated stabilization of HIF-1α enhanced the promoter occupancy of the latter on SAT1 promoter and corresponding transcriptional activation of SAT1, which could be abrogated by pharmacological inhibition of HIF-1α or CRISPR/Cas9-mediated knockout of HIF1A. MUC1 knockdown caused a significant reduction in the levels of SAT1-generated metabolites, N1-acetylspermidine and N8-acetylspermidine. Given the known role of MUC1 in therapy resistance, we also investigated whether inhibiting SAT1 would enhance the efficacy of FOLFIRINOX chemotherapy. By utilizing organoid and orthotopic pancreatic cancer mouse models, we observed that targeting SAT1 with pentamidine improved the efficacy of FOLFIRINOX, suggesting that the combination may represent a promising therapeutic strategy against pancreatic cancer. This study provides insights into the interplay between MUC1 and polyamine metabolism, offering potential avenues for the development of treatments against pancreatic cancer.

Keywords: MUC1; SAT1; hypoxia-inducible factors; pancreatic cancer; polyamine biosynthesis.


Conflict of interest statement

Competing interests statement:The authors declare no competing interest.

Figures
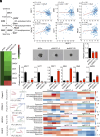
Fig. 1.
Fig. 1.
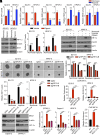
MUC1 positively correlates with polyamine metabolic pathway gene SAT1. (A) A schematic illustration of enzyme-coding genes and metabolites of the polyamine biosynthetic pathway. ODC, ornithine decarboxylase 1; PAOX, polyamine oxidase; SAT1, spermidine/spermine N1-acetyltransferase 1; SRM, spermidine synthase; SPS, spermine synthase; SMOX, spermine oxidase. (B) Spearman correlation plots showing the correlation of MUC1 with polyamine metabolic pathway genes (ODC1, SRM, SMS, SMOX, SAT1, and PAOX). (C) The heatmap shows mRNA expression levels of polyamine metabolic pathway genes upon MUC1 knockdown in Capan-2 cells from RNA-Seq data. (D) 3D spheroid assay to assess the growth of Capan-2 cells upon MUC1 knockdown along with quantitation of relative proliferation. (Scale bar: 1,000 μm.) (E) Relative mRNA expression levels of MUC1 and polyamine metabolic pathway genes in Capan-2 cells upon MUC1 knock-down. (F) The PCA of MUC1 knockdown Capan-2 and MUC1 knockout (CFPAC-1, HPAF-II, and S2-013) cells relative to scrambled control cells as determined by LC-MS/MS-based metabolomics. (G) Heatmap of polyamine metabolite levels in MUC1 knockdown Capan-2 and MUC1 knockout (CFPAC-1, HPAF-II, and S2-013) cells relative to scramble control cells as determined by LC-MS/MS-based metabolomics. The data are represented as mean ± SEM and compared by one-way ANOVA with Tukey’s post hoc test (D and E). ∗∗∗P < 0.001.
Fig. 2.
Fig. 2.
Overexpression of MUC1 increases SAT1 levels and activity in pancreatic cancer cells. (A) Relative mRNA expression of MUC1 and polyamine metabolic pathway genes in S2-013 cells upon MUC1 overexpression. (B) The immunoblots showing the relative levels of MUC1 and SAT1 proteins in control and MUC1 overexpressing S2-013 cells. (C) The PCA of metabolomic profiles of MUC1 overexpressing S2-013 cells relative to control cells. (D) Heatmap of polyamine metabolite levels in MUC1 overexpressing S2-013 cells relative to control cells. The data are represented as mean ± SEM, and the statistical significance is calculated by Student’s t test (A). P < 0.05 and ∗∗∗P < 0.001.
Fig. 3.
Fig. 3.
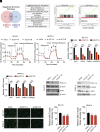
SAT1 knockdown regulates growth and proliferation of pancreatic cancer cells. (A) Relative mRNA expression of SAT1 in control and SAT1 knockdown S2-013 and HPAF-II cells. (B) SAT1 protein levels in control and SAT1 knockdown S2-013 and HPAF-II cells by immunoblotting. (C and D) Relative cell growth as measured by cell confluence of control and SAT1 knockdown S2-013 (C) and HPAF-II (D) cells. (E) The representative images of 3D spheroid growth assay for control and SAT1 knockdown S2-013 and HPAF-II cells. (Scale bar: 1,000 μm.) (F and G) The quantitation of relative proliferation of control and SAT1 knockdown S2-013 (F), and HPAF-II (G) cells in 3D spheroid growth assays. (H) The representative images of clonogenic assays for control and SAT1 knockdown S2-013 and HPAF-II cells. (I) Quantitative plot indicating the number of colonies from control and SAT1 knockdown S2-013, and HPAF-II cells. (J) Relative SAT1 mRNA levels in SAT1 knockdown S2-013 Neo and MUC1 overexpressing cells compared to the respective scrambled control cells. (K and L) The representative images (K) and quantitation (L) of 3D spheroid growth assays for control and SAT1 knockdown S2-013 Neo and MUC1 overexpressing cells. (M) Heatmap of polyamine metabolite levels in SAT1 knockdown S2-013 and HPAF-II cells relative to scrambled control cells as determined by LC-MS/MS-based metabolomics. (N) Relative proliferation of scrambled control and MUC1 knockout S2-013 cells upon supplementation with 100 µM N1-acetylspermidine.The data are represented as mean ± SEM and compared by one-way ANOVA with Tukey’s post hoc test (A, C, D, F, G, I, J, L, and N). ∗∗P < 0.01 and ∗∗∗P < 0.001.
Fig. 4.
Fig. 4.
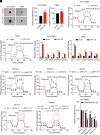
MUC1 upregulates HIF-1α-mediated expression of SAT1 under hypoxia. (A) Relative mRNA expression of polyamine pathway genes (SAT1, ODC1, SRM, SMS, and SMOX) in S2-013 and HPAF-II cells under normoxia and hypoxia. (B) HIF-1α and SAT1 protein levels in S2-013 and HPAF-II cells under normoxia and hypoxia by immunoblotting. (C) Relative SAT1 mRNA expression in S2-013 and HPAF-II cells cultured under normoxia and hypoxia upon control or digoxin treatment (100 nM) for 24 h. (D) HIF-1α and SAT1 protein levels in S2-013 and HPAF-II cells cultured under normoxia and hypoxia upon control or digoxin treatment for 24 h. (E and F) The representative images (E) and quantitation (F) of 3D spheroid growth assays for S2-013 and HPAF-II cells cultured under normoxia and hypoxia upon digoxin treatment for 72 h. (G) Relative SAT1 mRNA expression in S2-013 and HPAF-II cells cultured under normoxia and hypoxia without or with HIF1A knockout. (H) HIF-1α occupancy, relative to IgG control, on SAT1 promoter in control and HIF1A knockout S2-013 and HPAF-II cells by ChIP PCR. (I) MUC1 and HIF-1α protein levels in control and MUC1 knockdown Capan-2 and CFPAC-1 cells under hypoxia. (J) HIF-1α occupancy, relative to IgG control, on SAT1 promoter in control and MUC1 depleted CFPAC-1, Capan-2, and HPAF-II cells by ChIP PCR. (K) HIF-1α occupancy, relative to IgG control, on SAT1 promoter in S2-013 cells overexpressing empty vector (EV), full-length MUC1 (FL) or cytoplasmic tail-deleted MUC1 (CT3) protein. The data are represented as mean ± SEM, and the statistical significance is calculated by one-way ANOVA with Tukey’s post hoc test (C, F, G, H, J, and K) or Student’s t test (A). P < 0.05, ∗∗P < 0.01, and ∗∗∗P < 0.001.
Fig. 5.
Fig. 5.
SAT1 reprograms mitochondrial metabolism in pancreatic cancer cells. (A) Venn diagram of negatively enriched pathways from GSEA of shSAT1-A and shSAT1-B cells compared to shScr S2-013 cells. The pathways with an NES greater than 2 and q-value less than 0.05 were considered for analysis. (B) List of common negative enriched pathways in SAT1 knockdown cells compared to scramble control cells. (C and D) GSEA plot of OXPHOS in shSAT1-A (C) and shSAT1-B (D) S2-013 cells compared to shScr controls. (E and F) Seahorse-based metabolic flux analysis of OCR in control and SAT1 knockdown S2-013 (E) and HPAF-II (F) cells. (G and H) Relative mRNA expression of SAT1, GPX4, TIMM13, and MRPS22 genes in scrambled control and SAT1 knockdown S2-013 (G) and HPAF-II (H) cells. (I and J) Relative levels of PGC-1α and SAT1 proteins in scrambled control and SAT1 knockdown in S2-013 (I) and HPAF-II (J) cells. (K and L) Representative images (K) of MitoTracker green-stained scrambled control and SAT1 knockdown S2-013 and HPAF-II cells along with quantification of dye staining (L). (Scale bar: 100 μm.) The data are represented as mean ± SEM, and the statistical significance is calculated by one-way ANOVA with Tukey’s post hoc test (G, H, and L). P < 0.05, ∗∗P < 0.01, and ∗∗∗P < 0.001.
Fig. 6.
Fig. 6.
MUC1–SAT1 axis–mediated regulation of OXPHOS is critical for pancreatic cancer cell growth. (A and B) Representative images (A) of 3D spheroid growth assay of PaTu-8902 and T3M4 cells upon overexpression of the SAT1 gene along with quantification of relative proliferation (B). (Scale bar: 1,000 μm.) (C and D) Seahorse-based metabolic flux analysis of OCR in vector control and SAT1 overexpressing PaTu-8902 (C) and T3M4 (D) cells. (E and F) Relative mRNA expression of SAT1, GPX4, TIMM13, MRPS22, and ECHS1 genes in vector control and SAT1 overexpressing PaTu-8902 (E) and T3M4 (F) cells. (GI) Seahorse-based metabolic flux analysis of OCR in scramble control and MUC1 knockout CFPAC-1 (G), MUC1 knockdown Capan-2 (H), and MUC1 knockout S2-013 (I) cells. (J) Seahorse-based metabolic flux analysis of OCR in S2-013 cells overexpressing empty vector (EV), FLAG epitope-tagged full-length MUC1 (FL) or cytoplasmic tail-deleted MUC1 (CT3) protein. (K) Seahorse-based metabolic flux analysis of OCR in scramble or MUC1 knockdown Capan-2 cells upon overexpression of the SAT1 gene. (L) Relative proliferation of vector control and SAT1 overexpressing PaTu-8902 cells upon treatment with OXPHOS inhibitors (5 mM metformin, 3 nM oligomycin, and 10 μM rotenone). Each treatment group was normalized to the respective vehicle-treated group. Bar charts are represented as mean ± SEM compared by and unpaired Student’s t test (B, E, and F) and one-way ANOVA with Tukey’s post hoc test (L). P < 0.05, ∗∗P < 0.01, and ∗∗∗P < 0.001.
Fig. 7.
Fig. 7.
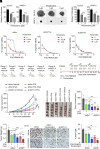
Targeting SAT1 enhances FOLFIRINOX efficacy against PDAC in vivo. (A) Relative proliferation of S2-013 and HPAF-II cells upon treatment with pentamidine for 72 h. (B and C) The representative images (B) and quantitation (C) of 3D spheroid growth assay in S2-013, and HPAF-II cells upon treatment with pentamidine for 72 h. (D) Dose–response curves of scrambled control or SAT1 knockdown PA901 organoids-treated with 0.5 or 1 μM pentamidine in combination with multiple doses of FOLFIRINOX. (E) The schematic of pentamidine (P) and/or FOLFIRINOX (F) dosing in athymic nude mice orthotopically implanted with shScr or shSAT1 S2-013 cells. (FI) Tumor growth kinetics in athymic nude mice implanted with shScr or shSAT1-A S2-013 cells upon treatment with FOLFIRINOX (FOL) without or with pentamidine (Pent), and corresponding postnecropsy representative tumor images (G), tumor volumes (H), and tumor weights (I). (J and K) Representative IHC staining (J) and quantitation in three different fields from three tumor sections of each group (K) for Ki-67 in the formalin-fixed tumor sections from athymic nude mice implanted with shScr or shSAT1-A S2-013 cells treated with FOLFIRINOX without or with pentamidine. (Scale bar, 100 μm.) The data are represented as mean ± SEM, and the statistical significance is calculated by one-way ANOVA with Tukey’s post hoc test (A, C, H, I, and K) or two-way ANOVA with Tukey’s test (F). P < 0.05, ∗∗P < 0.01, and ∗∗∗P < 0.001.

References

    1. Gemenetzis G., et al. , Survival in locally advanced pancreatic cancer after neoadjuvant therapy and surgical resection. Ann. Surg. 270, 340–347 (2019). - PMC - PubMed
    1. Halbrook C. J., Lyssiotis C. A., Pasca di Magliano M., Maitra A., Pancreatic cancer: Advances and challenges. Cell 186, 1729–1754 (2023). - PMC - PubMed
    1. Singh P. K., Hollingsworth M. A., Cell surface-associated mucins in signal transduction. Trends Cell Biol. 16, 467–476 (2006). - PubMed
    1. King R. J., Yu F., Singh P. K., Genomic alterations in mucins across cancers. Oncotarget 8, 67152–67168 (2017). - PMC - PubMed
    1. Tsutsumida H., et al. , RNA interference suppression of MUC1 reduces the growth rate and metastatic phenotype of human pancreatic cancer cells. Clin. Cancer Res. 12, 2976–2987 (2006). - PubMed