. 2024 Mar 28;19(3):e0301372.
doi: 10.1371/journal.pone.0301372. eCollection 2024.

Quantitative imaging and semiotic phenotyping of mitochondrial network morphology in live human cells

Affiliations

Quantitative imaging and semiotic phenotyping of mitochondrial network morphology in live human cells

Sophie Charrasse et al. PLoS One. .

Abstract

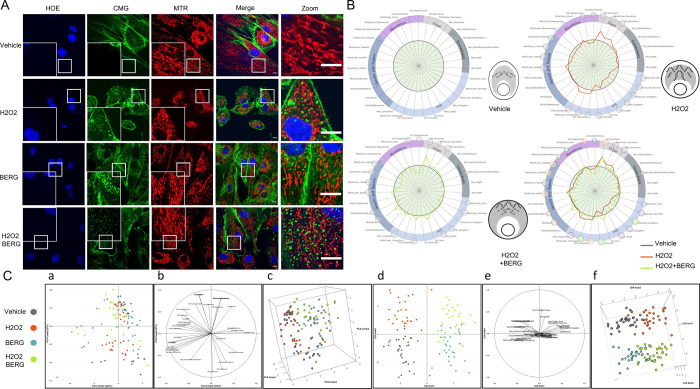
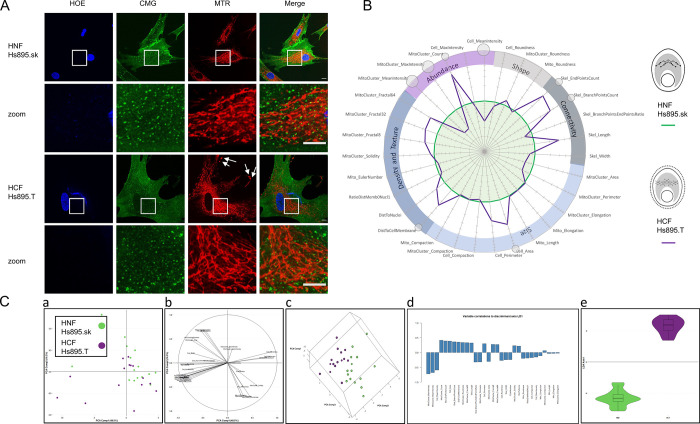
The importance of mitochondria in tissue homeostasis, stress responses and human diseases, combined to their ability to transition between various structural and functional states, makes them excellent organelles for monitoring cell health. There is therefore a need for technologies to accurately analyze and quantify changes in mitochondrial organization in a variety of cells and cellular contexts. Here we present an innovative computerized method that enables accurate, multiscale, fast and cost-effective analysis of mitochondrial shape and network architecture from confocal fluorescence images by providing more than thirty features. In order to facilitate interpretation of the quantitative results, we introduced two innovations: the use of Kiviat-graphs (herein named MitoSpider plots) to present highly multidimensional data and visualization of the various mito-cellular configurations in the form of morphospace diagrams (called MitoSigils). We tested our fully automated image analysis tool on rich datasets gathered from live normal human skin cells cultured under basal conditions or exposed to specific stress including UVB irradiation and pesticide exposure. We demonstrated the ability of our proprietary software (named MitoTouch) to sensitively discriminate between control and stressed dermal fibroblasts, and between normal fibroblasts and other cell types (including cancer tissue-derived fibroblasts and primary keratinocytes), showing that our automated analysis captures subtle differences in morphology. Based on this novel algorithm, we report the identification of a protective natural ingredient that mitigates the deleterious impact of hydrogen peroxide (H2O2) on mitochondrial organization. Hence we conceived a novel wet-plus-dry pipeline combining cell cultures, quantitative imaging and semiotic analysis for exhaustive analysis of mitochondrial morphology in living adherent cells. Our tool has potential for broader applications in other research areas such as cell biology and medicine, high-throughput drug screening as well as predictive and environmental toxicology.


Conflict of interest statement

The authors have declared that no competing interests exist.

Figures

Fig 1
Fig 1. Overview of the MITOMATICS pipeline.
(A) Main steps of the automated analysis of mitochondrial morphology using the MITOMATICS workflow are presented. Indicative durations needed for the pre-acquisition, acquisition and post-acquisition steps are outlined. See main text for details. (B) Fluorescent images of live cultured cells with labeled mitochondria, nucleus and cell contour are captured and loaded into MitoTouch as separate TIFF files. The images are segmented and a total of 31 morphological and texture features (see list on the right) are extracted for each frame. The values can be plotted for a particular cell or for all cells present in a given microscopic field (a), at the level of the whole mitochondrial population (b) or for mitochondrial subnetworks (c). (C) MitoTouch offers the option of manually adjusting threshold values until achieving visually appealing segmentation results for nuclei, mitochondria and cell limits. A filter option is also present that can be used to remove cells touching image borders. A skeleton with branch and end points is constructed to represent the spatial structure of mitochondria and their subnetworks (d). Note that MitoTouch processing of a single confocal image lasted on average 10s on a computer with a modern CPU (intel Core i7) and 16 GB RAM. MitoTouch was implemented in MATLAB using custom written scripts. (D) The Assayscope software enables to crunch data from MitoTouch output files (i.e., extract data, rename items, generate tables and prepare export files). Statistics and visual exploration of the crunched data. After image processing and data analysis, the multidimensional (multi-D) data are statistically analyzed (E) and visually represented (F) in the form of spider diagrams (MitoSpider plot) where the reference condition is standardized by a green circle for comparison with a different cellular state (blue line). (G) A schematic ‘MitoSigil’ is then associated to the plot to facilitate interpretation (see explanations in S2 and S3 Files).
Fig 2
Fig 2. Graphical and schematic interpretations of mitochondrial morphology.
(A) The 31 parameters measured by the MitoTouch software are reported after normalization on a MitoSpider graph. Parameters values Vp (expressed as arbitrary units) are normalized (to give Vn) by applying the following formula Vn=(VpVmin)/(VmaxVmin). Features are grouped into 5 categories including Abundance, Shape, Connectivity, Size, Density and Texture and compared to a reference (green circle). Significant differences from basal for each condition, n = 3 independent experiments, are notified by small (*: p<0.05), medium (**: p<0.01) or large (***: p<0.001) circles (t-test). (B) Schematic representation reflecting the organization of the mitochondria, their positioning in the cell as well as the cellular shape. (C) A resulting MitoSigil is then created from this morphological classification (see S2 and S3 Files).
Fig 3
Fig 3. Increasing doses of UVB irradiation disturb mitochondrial morphology in NHDF cells.
(A) Fluorescent representative imaging of nuclei using Hoechst staining (blue; HOE), membranes with CellMask dye (green; CMG) and cellular distribution of the mitochondria-specific dye MitoTracker Red FM (red; MTR) after irradiation with increasing doses of UVB (50 to 400 mJ/cm2). Pictures were taken using live-cell confocal microscopy 6h after irradiation. Single, overlapping images and zoom inserts are presented. Scale bar = 10μm. (B) After analysis of a minimum of 300 cells with MitoTouch software, the distribution of normalized morphological features (Vn) is represented by a MitoSpider plot. Significant differences with respect to the control condition, n = 3 independent experiments, are notified by small (*: p<0.05), medium (**: p<0.01) or large (***: p<0.001) circles (t-test). Fibroblasts are sensitive to increasing UVB irradiation as shown by the purple broken lines in relation to the reference red circle (no UVB irradiation). Profiles are similar until 200 mJ/cm2, and slightly modified with 300 and 400 mJ/cm2 as reported by the MitoSpider plots and the associated MitoSigils. (C) Projection of the samples onto the 2D space generated by the first two Principal Components (a). PCA2 segregates irradiated samples from untreated ones, independently of the irradiation dose. Correlation of each feature to the first two Principal Components (b). Projection of the samples onto the 3D space generated by the first three Principal Components (c). Projection of the samples onto the 2D space generated by the first two LDA discriminant axis (d). LDA1 splits irradiated samples from untreated ones, while LDA2 highlights the irradiation dose gradient. Correlation of each feature to the first two LDA discriminant axis (e). Note that features parallel to LDA1 have an explanatory role in the observed segregation between treated and untreated samples, whereas those parallel to LDA2 in the categorization of irradiated samples depending on their UVB dose. Projection of the samples onto the 3D space generated by the first three LDA discriminant axis (f). UVB doses are shown in the inset.
Fig 4
Fig 4. Distinct changes in mitochondrial morphology of NHDF cells after exposure to three different pesticides.
(A) NHDF cells were treated with vehicle (DMSO), Fipronil, Imidaclopril, or Glyphosate for 6h and stained with HOE (blue), CMG dye (green) and MTR (red) before imaging. Scale bar = 10μm. (B) Mean mitochondrial and cellular features measured in cells exposed to FPN (pink broken line), Imidaclopril (orange broken line) or Glyphosate (purple broken line) and compared to the reference condition (DMSO, green line) are reported onto MitoSpider plots. Significant differences from basal for each condition, n = 3 independent experiments, are notified by small (*: p<0.05), medium (**: p<0.01) or large (***: p<0.001) circles (t-test). The resulting ‘mito-signatures’ (MitoSpider plots) and their associated phenotypic representation (MitoSigils) are depicted. (C) Bidimensional representation of the samples into the new subspace generated by the first two principal components (a). PCA Comp1 globally separates treated samples from vehicle alone. Different compounds affect differently samples coordinates shifting them away from vehicle more or less markedly and in diverse directions. Correlation of each feature to the first two principal components (b). Projection of the samples onto the 3D space generated by the first three Principal Components (c).). Projection of the samples onto the 2D space generated by the first two LDA discriminant axis differentiates treated samples from untreated controls (d). LDA1 completely splits treated samples from untreated controls. In addition, LDA2 reveals that toxicants acting with different biological mechanisms were differentially clustered. IMID and GLYPHO partially overlap, whereas FPN appears to lie far apart from the other groups. Correlation of each feature to the first two LDA discriminant axis (e). Projection of the samples onto the 3D space generated by the three LDA discriminant axis (f). LDA3 allows to completely separate IMID from GLYPHO, two groups of samples that partially overlapped with each other in the 2D representation. The various conditions are shown in the inset.
Fig 5
Fig 5. Identification of a natural compound with mitochondrio-protective activity against hydrogen peroxide-induced mitochondrial damage.
(A) Mitochondrial network of control NHDFs (vehicle), treated with H2O2 (50μM), Bergaphen (1500ppm), with or without (medium) pre-incubation with the asset of interest. (B) Morpho-phenotypic signatures obtained after analysis by MitoTouch, statistical tests, graphs and inferred MitoSigils. Significant differences from basal (grey circle) computed for stressed samples (H2O2, broken red line) or for samples pretreated with Bergaphen before H2O2 addition (BERG, broken green line) are notified by small (*: p<0.05), medium (**: p<0.01) or large (***: p<0.001) circles (t-test). Green: restored parameters; violet: partially restored parameters; blue: parameters getting worse in the pretreated group; orange: no protective effect and brown: damaged. The mitochondrial network appears to split in stressed cells (H2O2; red line) while preconditioning with the natural ingredient (BERG; green line) has protective effects on a number of morphological parameters of the cellular mitochondriomes (bringing the orange line closer to the grey line). The results are representative of three independent experiments, each involving around 500 cells. (C) Projection of the samples onto the 2D space generated by the first two principal components. PCA does not allow to separate the four groups (a). Correlation of each feature to the first two principal components (b). Projection of the samples onto the 3D space generated by the first three principal components (c). This view allows to globally differentiate samples treated or not by BERG. Projection of the samples onto the 2D space generated by the first two LDA axis (d). The four groups are successfully discriminated by LDA: LDA1 separates samples that were treated or not by BERG whereas LDA2 distinguishes H2O2-treated samples versus control samples. Correlation of each feature to the first two LDA discriminant axis (e). Projection of the samples onto the 3D space generated by the three LDA discriminant axis (f). This view confirms the separation of the four groups viewed in the 2D graph.
Fig 6
Fig 6. Cultured human fibroblasts (NHDF) and keratinocytes (NHEK) show distinct morpho-phenotypic mitochondrial profiles.
(A) Representative immunofluorescence images are shown for nuclear (blue), cellular (green) and mitochondrial (red) staining in fibroblasts (NHDF) and keratinocytes (NHEK). Merge corresponds to the superposition of the 3 colored images. The bottom inserts (zoom) correspond to enlargements of the areas surrounded at the top. Scale bar = 10μm. (B) MitoSpider plots showing variations in the cellular and mitochondrial morphology in fibroblasts taken as reference (green line) versus keratinocytes (brown line). Significant differences between both cell types are indicated by small (*: p<0.05), medium (**: p<0.01) or large (***: p<0.001) circles (t-test). The inferred MitoSigil reflects the fact that keratinocytes are rounder cells with a less compact and intertwined mitochondrial network compared to fibroblasts. The results are representative of at least 3 independent experiments, each involving around 500 cells. (C) Projection of the samples onto the 2D space generated by the first two principal components (a). The two types of cells can be separated by a diagonal line. Correlation of each feature to the first two principal components (b). Projection of the samples onto the 3D space generated by the first three principal components (c). This view confirms the separation of the two groups visible in the 2D graph. Correlation of each feature to the LDA discriminant axis (d). Violin plots showing that both types of cell morphology are well-discriminated (e).
Fig 7
Fig 7. Variations in the mitochondrial network of melanoma-associated and normal skin fibroblasts.
(A) Human normal fibroblasts (HNF) (Hs895.sk #CRL-7636) and human cancer fibroblasts (HCF) (Hs895.T #CRL-7637) derived from the same patient were stained for nuclei (HOE blue), cellular membranes (CMG) and mitochondria (MTR). White squares indicate zoomed areas shown in insets. Scale bar = 10μm. (B) MitoSpider plot and cognate MitoSigil inferred after analysis by MitoTouch show cellular retraction (significant decrease in Cell_Area, small circle *: p<0.05) with concomitant ramification of the mitochondrial network (significant increase in the Skel_EndPointsCount parameter, small circle *: p<0.05) in cancer cells (purple line) compared to their normal counterparts (green circle). The results are representative of at least 3 independent experiments, each involving around 500 cells. (C) Projection of the samples onto the 2D space generated by the first two principal components (a). Using PCA, the two types of cells cannot be separated. Correlation of each feature to the first two principal components (b). Projection of the samples onto the 3D space generated by the first three principal components (c). This view allows bona fide separation of both groups. Correlation of each feature to the LDA discriminant axis (d). Violin plots showing that both types of cell morphology are well discriminated (e).

References

    1. Sagan L. On the origin of mitosing cells. J Theor Biol. 1967;14: 255–274. doi: 10.1016/0022-5193(67)90079-3 - DOI - PubMed
    1. Eisner V, Picard M, Hajnóczky G. Mitochondrial dynamics in adaptive and maladaptive cellular stress responses. Nat Cell Biol. 2018;20: 755–765. doi: 10.1038/s41556-018-0133-0 - DOI - PMC - PubMed
    1. Nunnari J, Suomalainen A. Mitochondria: in sickness and in health. Cell. 2012;148: 1145–1159. doi: 10.1016/j.cell.2012.02.035 - DOI - PMC - PubMed
    1. Aouacheria A, Baghdiguian S, Lamb HM, Huska JD, Pineda FJ, Hardwick JM. Connecting mitochondrial dynamics and life-or-death events via Bcl-2 family proteins. Neurochem Int. 2017;109: 141–161. doi: 10.1016/j.neuint.2017.04.009 - DOI - PMC - PubMed
    1. Quirós PM, Mottis A, Auwerx J. Mitonuclear communication in homeostasis and stress. Nat Rev Mol Cell Biol. 2016;17: 213–226. doi: 10.1038/nrm.2016.23 - DOI - PubMed

Substances