Changing COVID-19 cases and deaths detection in Florida
- PMID: 38547145
- PMCID: PMC10977794
- DOI: 10.1371/journal.pone.0299143
Changing COVID-19 cases and deaths detection in Florida
Abstract
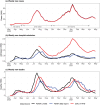
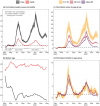
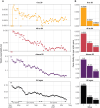
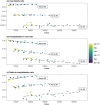
Epidemic data are often difficult to interpret due to inconsistent detection and reporting. As these data are critically relied upon to inform policy and epidemic projections, understanding reporting trends is similarly important. Early reporting of the COVID-19 pandemic in particular is complicated, due to changing diagnostic and testing protocols. An internal audit by the State of Florida, USA found numerous specific examples of irregularities in COVID-19 case and death reports. Using case, hospitalization, and death data from the the first year of the COVID-19 pandemic in Florida, we present approaches that can be used to identify the timing, direction, and magnitude of some reporting changes. Specifically, by establishing a baseline of detection probabilities from the first (spring) wave, we show that transmission trends among all age groups were similar, with the exception of the second summer wave, when younger people became infected earlier than seniors, by approximately 2 weeks. We also found a substantial drop in case-fatality risk (CFR) among all age groups over the three waves during the first year of the pandemic, with the most drastic changes seen in the 0 to 39 age group. The CFR trends provide useful insights into infection detection that would not be possible by relying on the number of tests alone. During the third wave, for which we have reliable hospitalization data, the CFR was remarkably stable across all age groups. In contrast, the hospitalization-to-case ratio varied inversely with cases while the death-to-hospitalization ratio varied proportionally. Although specific trends are likely to vary between locales, the approaches we present here offer a generic way to understand the substantial changes that occurred in the relationships among the key epidemic indicators.
Copyright: © 2024 Toh et al. This is an open access article distributed under the terms of the Creative Commons Attribution License, which permits unrestricted use, distribution, and reproduction in any medium, provided the original author and source are credited.
Conflict of interest statement
The authors have declared that no competing interests exist.
Figures


Similar articles
-
Unpacking the Drop in COVID-19 Case Fatality Rates: A Study of National and Florida Line-Level Data.AMIA Annu Symp Proc. 2022 Feb 21;2021:285-294. eCollection 2021. AMIA Annu Symp Proc. 2022. PMID: 35308980 Free PMC article.
-
An ecological study of COVID-19 outcomes among Florida counties.BMC Public Health. 2025 Feb 12;25(1):579. doi: 10.1186/s12889-025-21764-x. BMC Public Health. 2025. PMID: 39939852 Free PMC article.
-
SARS-CoV-2 pandemic and Construction Industry: insights from Italian data.Acta Biomed. 2022 Jul 1;93(3):e2022233. doi: 10.23750/abm.v93i3.12265. Acta Biomed. 2022. PMID: 35775779 Free PMC article.
-
Travel-related control measures to contain the COVID-19 pandemic: a rapid review.Cochrane Database Syst Rev. 2020 Oct 5;10:CD013717. doi: 10.1002/14651858.CD013717. Cochrane Database Syst Rev. 2020. Update in: Cochrane Database Syst Rev. 2021 Mar 25;3:CD013717. doi: 10.1002/14651858.CD013717.pub2. PMID: 33502002 Updated.
-
[Effect of the Omicron variant on cumulative incidence of infection and lethality during the sixth wave of the COVID-19 epidemic in Spain].Semergen. 2024 Mar;50(2):102073. doi: 10.1016/j.semerg.2023.102073. Epub 2023 Oct 13. Semergen. 2024. PMID: 37839336 Review. Spanish.
References
-
- CDC. COVID Data Tracker; 2020. Available from: https://covid.cdc.gov/covid-data-tracker.
-
- CDC. HHS Delivers Funding to Expand Testing Capacity for States, Territories, Tribes; 2020. Available from: https://www.cdc.gov/media/releases/2020/p0518-hhs-funding-expand-testing....
-
- State of Florida. Office of The Governor Executive Order Number 20-91; 2020. Available from: https://www.flgov.com/wp-content/uploads/orders/2020/EO_20-91.pdf.
-
- State of Florida Auditor General. COVID-19 Data Collection and Reporting at Selected State Entities; 2022. 2022-200. Available from: https://flauditor.gov/pages/pdf_files/2022-200.pdf.
MeSH terms
Grants and funding
LinkOut - more resources
Full Text Sources
Medical
Research Materials

