. 2024 Mar 29;134(7):842-854.
doi: 10.1161/CIRCRESAHA.123.323634. Epub 2024 Mar 28.

Gut Microbiota and Blood Metabolites Related to Fiber Intake and Type 2 Diabetes

Affiliations

Gut Microbiota and Blood Metabolites Related to Fiber Intake and Type 2 Diabetes

Zheng Wang et al. Circ Res. .

Abstract

Background: Consistent evidence suggests diabetes-protective effects of dietary fiber intake. However, the underlying mechanisms, particularly the role of gut microbiota and host circulating metabolites, are not fully understood. We aimed to investigate gut microbiota and circulating metabolites associated with dietary fiber intake and their relationships with type 2 diabetes (T2D).

Methods: This study included up to 11 394 participants from the HCHS/SOL (Hispanic Community Health Study/Study of Latinos). Diet was assessed with two 24-hour dietary recalls at baseline. We examined associations of dietary fiber intake with gut microbiome measured by shotgun metagenomics (350 species/85 genera and 1958 enzymes; n=2992 at visit 2), serum metabolome measured by untargeted metabolomics (624 metabolites; n=6198 at baseline), and associations between fiber-related gut bacteria and metabolites (n=804 at visit 2). We examined prospective associations of serum microbial-associated metabolites (n=3579 at baseline) with incident T2D over 6 years.

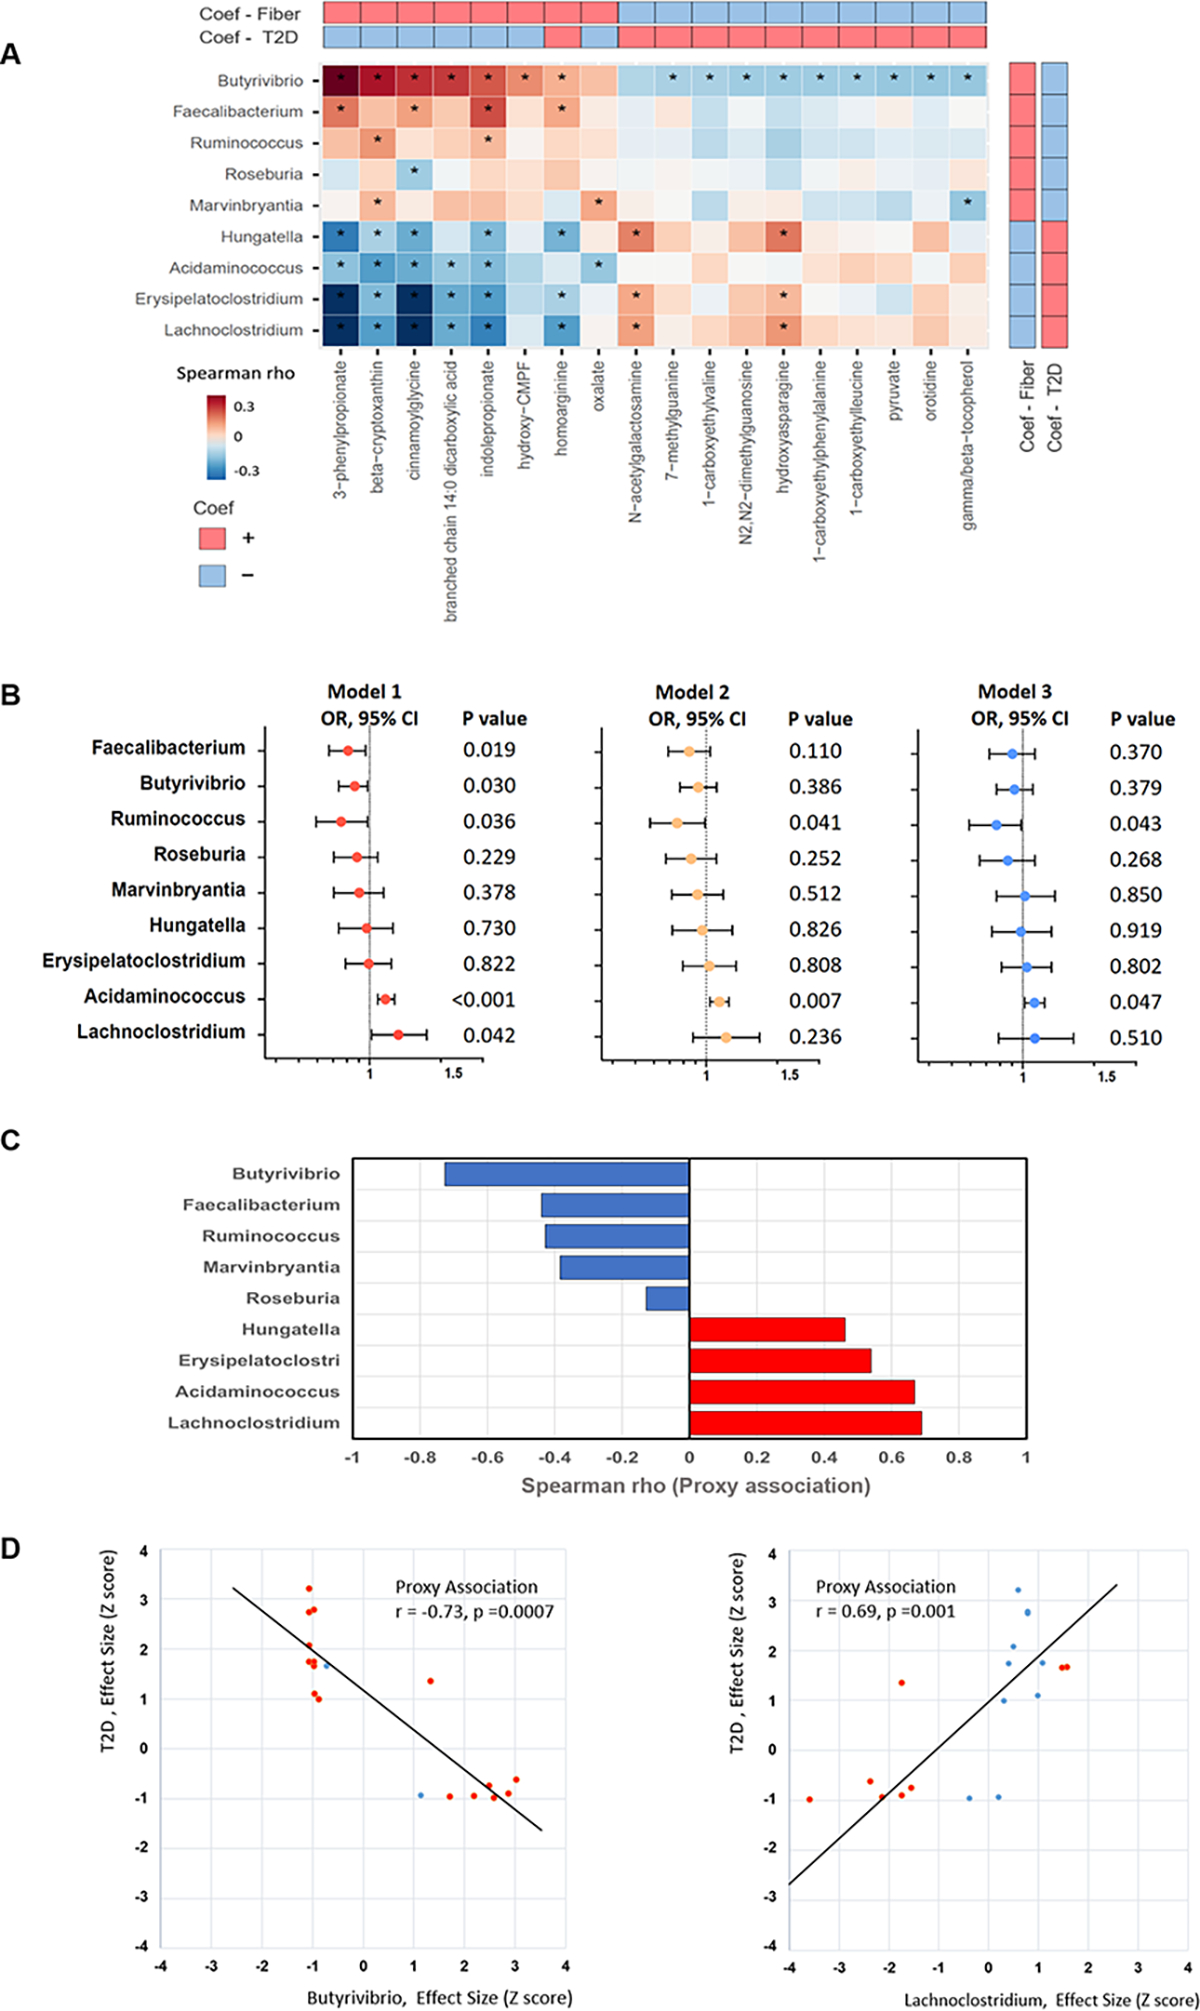
Results: We identified multiple bacterial genera, species, and related enzymes associated with fiber intake. Several bacteria (eg, Butyrivibrio, Faecalibacterium) and enzymes involved in fiber degradation (eg, xylanase EC3.2.1.156) were positively associated with fiber intake, inversely associated with prevalent T2D, and favorably associated with T2D-related metabolic traits. We identified 159 metabolites associated with fiber intake, 47 of which were associated with incident T2D. We identified 18 of these 47 metabolites associated with the identified fiber-related bacteria, including several microbial metabolites (eg, indolepropionate and 3-phenylpropionate) inversely associated with the risk of T2D. Both Butyrivibrio and Faecalibacterium were associated with these favorable metabolites. The associations of fiber-related bacteria, especially Faecalibacterium and Butyrivibrio, with T2D were attenuated after further adjustment for these microbial metabolites.

Conclusions: Among United States Hispanics/Latinos, dietary fiber intake was associated with favorable profiles of gut microbiota and circulating metabolites for T2D. These findings advance our understanding of the role of gut microbiota and microbial metabolites in the relationship between diet and T2D.

Keywords: diabetes mellitus, type 2; dietary fiber; gastrointestinal microbiome; genes, bacterial; metabolome.


Conflict of interest statement

Disclosures None.

Figures

Figure 1.
Figure 1.. Dietary fiber intake, gut microbial taxa, and prevalent T2D.
A. Integrated phylogenetic tree of gut microbial taxa associated with fiber intake (n= 2992). Taxa from inner to outer circle represent bacteria kingdom to genus level. The branch widths reflect the relative abundance of each taxon. Red/blue colors of the ring depict the significant positive/inverse associations with fiber intake (FDR <0.05) and the gradient colors reflect the beta coefficients estimated in linear regression models, after adjustment for age, sex, study center, education, family income, physical activity, smoking, drinking, use of antibiotics, probiotics, antihypertensive medication, anti-diabetic medication, and lipid-lowering medication. Among the 24 fiber-associated genera, 9 were significantly associated with prevalent T2D in multivariable logistic models, after adjustment for the aforementioned covariates except for anti-diabetic medication use. Red/blue stars depict the positive/inverse associations of genera with T2D (P <0.05). B. Partial Spearman correlation heatmap for the 24 identified fiber-associated microbial genera. Red font highlights those genera positively associated with fiber intake. The pie pieces reflect the strength of the correlation. Results were adjusted for the aforementioned covariates. C. Polar plot for associations of species-level microbial taxa with dietary fiber intake. The results for 99 predominant species (average relative abundance >0.001% and present in >20% samples) under the identified 24 fiber-associated genera are shown. The bar height represents −Log10(P) value. Bacterial species significantly associated with fiber intake are highlighted in red / blue (positive / inverse associations; P <0.05). D. Associations of fiber-related genera with prevalent T2D. Data are odds ratios (ORs) and 95% confidence intervals (CIs) for T2D per increment of CLR-transformed abundance of gut bacterial genera, adjusting for the aforementioned covariates. E. Associations of microbial genera with fiber intake and prevalent T2D. Data are beta coefficients estimated in regressions (for fiber intake) and natural logarithms of ORs estimated in logistic regressions (for T2D), after adjustment for the aforementioned covariates in panel A. Each dot represents a bacterial genus. Red dots highlight the 9 genera significantly associated with both fiber intake and T2D. F. Associations of T2D-associated genera with metabolic traits. Data are beta coefficients estimated in linear regression models after adjustment for the aforementioned covariates in panel A (*P <0.05).
Figure 2.
Figure 2.. Fiber-associated gut microbial functional enzymes and prevalent T2D.
The partial Spearman correlation heatmap (the left panel) includes 17 microbial functional enzymes under the Glycosylases category that were significantly associated with fiber intake (all FDR <0.05) (n= 2992). For the associations of microbial functional enzymes with fiber intake (the middle-left panel), the gradient colors reflect the ranks of beta coefficients estimated in multivariate linear regressions, after adjustment for age, sex, study center, education, family income, physical activity, smoking, drinking, use of antibiotics, probiotics, antihypertensive medication, anti-diabetic medication, and lipid-lowering medication. For the associations of microbial functional enzymes with prevalent T2D (the middle-right panel), data are ORs and 95% CIs, estimated in multivariable logistic regressions, after adjustment for the aforementioned covariates except for anti-diabetic medication use. The partial Spearman correlation heatmap (the right panel) indicates correlations between these 17 microbial functional glycosylases and the 9 identified fiber-associated genera.
Figure 3.
Figure 3.. Dietary fiber intake, circulating metabolites, and incident T2D.
A. Polar plot for associations of serum metabolites with fiber intake. Data are −Log10(P) values for 159 metabolites, which were significantly associated with fiber intake (FDR <0.05)(n=3916), and validated in an additional dataset (n=2282), from multivariate linear regressions, with adjustment for age, sex, study center, education, family income, physical activity, smoking, drinking, use of antibiotics, probiotics, antihypertensive medication, anti-diabetic medication, and lipid-lowering medication. Red/blue: positive/ inverse associations (FDR <0.05). B. Prospective associations between fiber-related metabolites and incident T2D. Data are rate ratios (RRs) and 95% CIs, estimated by multivariable Poisson regressions, with adjustment for the aforementioned covariates except for anti-diabetic medication use. Results were from the discovery data (the upper panel) including 2010 participants free of diabetes at baseline, with 224 incident T2D cases over 6 years; from the replication analyses (middle panel) including 1569 participants free of diabetes at baseline with 204 incident T2D cases over 6 years; and combined (the lower panel) from both datasets using fixed-effects meta-analysis.
Figure 4.
Figure 4.. Integrated analyses of gut microbiota and circulating metabolites associated with fiber intake and T2D
A. Correlation heatmap for the identified microbial taxa and serum metabolites associated with both fiber intake and T2D. Data are partial Spearman correlation coefficients among 804 participants after adjustment for age, sex, study center, education, family income, physical activity, smoking, drinking, use of antibiotics, probiotics, antihypertensive medication, anti-diabetic medication, and lipid-lowering medication. (*P <0.05) B. Associations of fiber-related microbial genera with prevalent T2D with and without adjustment for microbial-related metabolites. Data are ORs and 95% CIs for T2D per increment of CLR-transformed abundance of gut bacterial genera, estimated in logistic regression models after adjustment for the aforementioned covariates (Model1); further adjustment for metabolites relevant to specific individual taxa (Model 2); and further adjustment for all 18 microbial-related metabolites (Model 3). C. The proxy associations between fiber-related microbial genera and risk of T2D. The identified 18 microbial-related metabolites were used as proxies for these 9 bacterial genera. For each bacterial genus, we calculated a Spearman correlation coefficient between effect sizes (beta coefficients) from the associations of this genus with the microbial-related metabolites and effects sizes (nature-log-transformed RRs) from the associations of the microbial-related metabolites with risk of T2D. A significant correlation between these two sets of effect sizes was considered as a significant proxy association. D. The representative proxy associations of Butyrivibrio (the left panel) and Lachnoclostridium (the right panel) with risk of T2D. Each dot represents a microbial-related metabolite. The x-axis shows effect sizes (beta coefficients) from the cross-sectional associations of Butyrivibrio or Lachnoclostridium with18 metabolites, and the y-axis shows effects sizes (nature-log-transformed RRs) from prospective associations of 18 metabolites at baseline with risk of T2D. These effect sizes were standardized using z-score transformation, to ensure comparability. Metabolites significantly associated with Butyrivibrio and Lachnoclostridium, respectively are highlighted with red.

References

    1. McRae MP. Dietary Fiber Intake and Type 2 Diabetes Mellitus: An Umbrella Review of Meta-analyses. Journal of Chiropractic Medicine.2018;17:44–53. doi:10.1016/j.jcm.2017.11.002. - DOI - PMC - PubMed
    1. Jenkins DJA, Kendall CWC, McKeown-Eyssen G, Josse RG, Silverberg J, Booth GL, Vidgen E, Josse AR, Nguyen TH, Corrigan S,et al. Effect of a low-glycemic index or a high-cereal fiber diet on type 2 diabetes: A randomized trial. JAMA - Journal of the American Medical Association.2008;300:2742–2753. doi:10.1001/jama.2008.808. - DOI - PubMed
    1. Myhrstad MCW, Tunsjø H, Charnock C, Telle-Hansen VH. Dietary fiber, gut microbiota, and metabolic regulation—current status in human randomized trials. Nutrients.2020;12(3): 859. doi:10.3390/nu12030859. - DOI - PMC - PubMed
    1. Zhao L, Zhang F, Ding X, Wu G, Lam YY, Wang X, Fu H, Xue X, Lu C, Ma J,et al. Gut bacteria selectively promoted by dietary fibers alleviate type 2 diabetes. Science.2018;359:1151–1156. doi:10.1126/science.aao5774. - DOI - PubMed
    1. Kaplan RC, Wang Z, Usyk M, Sotres-Alvarez D, Daviglus ML, Schneiderman N, Talavera GA, Gellman MD, Thyagarajan B,et al. Gut microbiome composition in the Hispanic Community Health Study/Study of Latinos is shaped by geographic relocation, environmental factors, and obesity. Genome Biol.2019;20: 219–z. doi:10.1186/s13059-019-1831-z. - DOI - PMC - PubMed