. 2024 Mar 29;383(6690):1484-1492.
doi: 10.1126/science.adh2771. Epub 2024 Mar 28.

Pyrimidines maintain mitochondrial pyruvate oxidation to support de novo lipogenesis

Affiliations

Pyrimidines maintain mitochondrial pyruvate oxidation to support de novo lipogenesis

Umakant Sahu et al. Science. .

Abstract

Cellular purines, particularly adenosine 5'-triphosphate (ATP), fuel many metabolic reactions, but less is known about the direct effects of pyrimidines on cellular metabolism. We found that pyrimidines, but not purines, maintain pyruvate oxidation and the tricarboxylic citric acid (TCA) cycle by regulating pyruvate dehydrogenase (PDH) activity. PDH activity requires sufficient substrates and cofactors, including thiamine pyrophosphate (TPP). Depletion of cellular pyrimidines decreased TPP synthesis, a reaction carried out by TPP kinase 1 (TPK1), which reportedly uses ATP to phosphorylate thiamine (vitamin B1). We found that uridine 5'-triphosphate (UTP) acts as the preferred substrate for TPK1, enabling cellular TPP synthesis, PDH activity, TCA-cycle activity, lipogenesis, and adipocyte differentiation. Thus, UTP is required for vitamin B1 utilization to maintain pyruvate oxidation and lipogenesis.


Conflict of interest statement

Competing interests: Authors declare they have no competing interests.

Figures

Fig. 1.
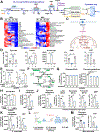
Fig. 1.. Depletion of cellular pyrimidines inhibits pyruvate catabolism.
(A) Illustration and metabolic role of the de novo pyrimidine synthesis pathway. The DHODH inhibitor brequinar (BRQ) and UMPS inhibitor pyrazofurin (PRZ) are indicated. (B) Steady-state metabolite profiles measured by LC-MS/MS of HeLa cells treated with BRQ (1 μM). (C) Glucose fate through glycolysis and TCA cycle. (D) Steady-state levels of pyruvate, citrate, N-carbamoyl-L-aspartate, UMP and ATP measured byLC-MS/MS in HeLa cells treated with vehicle (DMSO), BRQ (1 μM) or Methotrexate (MTX, 4 μM) for 16 h. (E) Same as in (D), but in ΔUMPS HEK293E cells reconstituted or not with UMPS cDNA. (F) Carbon flow schematic from [13C6]-glucose into the TCA cycle. (G) Fractional enrichment (%) of 13C-labeled glucose (M+6) from [13C6]-glucose labeling in ΔUMPS HEK293E cells exposed to uridine withdrawal time course. (H) Fractional enrichment (%) of citrate (M+2) from [13C6]-glucose labeling in ΔUMPS HEK293E cells reconstituted or not with UMPS cDNA (I) Pyruvate catabolism from HEK293E cells labeled with [13C3]-pyruvate and treated with vehicle (DMSO) or PRZ (1 μM) for 16 h. (J) Pyruvate catabolism and fractional enrichment (%) of 13C-labeled metabolites derived from [13C3]-pyruvate in mouse embryonic stem cells treated as (I). (K) Pyruvate catabolism measured in Saccharomyces cerevisiae ura3Δ cells labeled with 13C3-pyruvate for 30 min. (L) Experimental design of the [13C6]-glucose isotope tracing in mice. (M) Measurement of pyruvate catabolism in livers of mice treated with vehicle (PBS 70%, PEG-400 30%) or BRQ (20 mg/kg). Data in (M) are mean ± s.d. n = 5 mice. For all the other panels, data are mean ± s.d. n = 3 independent replicates. * indicates P<0.05 for multiple comparisons calculated using one-way ANOVA with Tukey’s honest significant difference (HSD) test (D, E, G, H) or using a two-tailed Student’s t-test for pairwise comparisons (I, J, K, M).
Fig. 2.
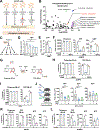
Fig. 2.. Pyrimidines are required to support PDH and mitochondrial complex I activities.
(A) Schematic illustrating the decarboxylation of pyruvate step mediated by PDH. (B, C) 14CO2 production from [1-14C]-pyruvate reflecting PDH activity in ΔUMPS HEK293E cells cultured in the presence or absence of uridine (200 μM) (B), reconstituted or not with a UMPS cDNA construct (C). (D) Immunoblots of wild-type (WT) and ΔCAD HEK293E cells cultured in the presence or absence of uridine (200 μM) for the indicated times. (E) Normalized peak areas of 13C-labeled acetyl-CoA derived from [13C3]-pyruvate labeling in ΔCAD HEK293E cells reconstituted or not with CAD cDNA, cultured in the presence or absence of uridine (200 μM, 16h). (F) Measurement of NADH/NAD+ ratio from whole cell extracts of HeLa cells treated with vehicle (DMSO) or BRQ (1 μM, 16h). (G) NAD+, NADH levels, and ratio measured from isolated mitochondria of HeLa cells treated with vehicle (DMSO) or BRQ (1 μM, 16h). (H, I) Same as (F, G) but in ΔUMPS HEK293E cells reconstituted or not with UMPS cDNA, in the presence or absence of uridine (200 μM, 16h). (J) NADH/NAD+ ratios of isolated mitochondria from A375, A549 and CAL51 cells deleted for CAD (ΔCAD), in the presence or absence of uridine (200 μM, 16h). (K) Measurement of respiratory complex I activity and quantification of state III respiration in HeLa WT cells treated with vehicle (DMSO) or BRQ (1 μM, 16h). (L) Same as in (K) but in ΔUMPS HEK293E cells reconstituted or not with UMPS cDNA, in the presence or absence of uridine (200 μM, 16h). Graphs representative of 3 replicates shown in (K) and (L). For all other panels, data are mean ± s.d. n = 3 independent replicates. * indicates P<0.05 for multiple comparisons calculated using one-way ANOVA with Tukey’s honest significant difference (HSD) test (C, E, H, I, L) or using a two-tailed Student’s t-test for pairwise comparisons (B, F, G, J, K).
Fig. 3.
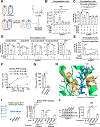
Fig. 3.. Cellular pyrimidine levels are required for thiamine pyrophosphate synthesis.
(A) Experimental design of the untargeted metabolomics experiment in ΔCAD HEK293E cells. (B) Pathway impact analysis of untargeted metabolomics. (C) Metabolic role of thiamine in cells. (D, E) Steady-state levels of thiamine pyrophosphate (TPP) measured by LC-MS in HeLa (D) and HEK293E (E) cells treated with vehicle (DMSO), BRQ (1 μM) or PRZ (1 μM). (F) Steady-state levels of thiamine, TPP and UDP in ΔUMPS HeLa cells reconstituted or not with UMPS cDNA, in the presence or absence of uridine (200 μM, 16 h). (G) Cellular thiamine pyrophosphate kinase 1 (TPK1) activity measured by stable isotope tracing through measurement of carbon flow from 13C4-thiamine into TPP. (H) Fractional enrichment (%) of 13C-labeled metabolites derived from [13C4]-thiamine in ΔUMPS HeLa cells reconstituted or not with UMPS cDNA in the presence or absence of uridine (200 μM, 16 h). (I) Fractional enrichment (%) of 13C-labeled metabolites derived from [13C4]-thiamine in HeLa cells treated with vehicle (DMSO), BRQ (1 μM), or methotrexate (MTX, 4 μM) for 16 h. (J) Experimental design and steady-state levels of TPP, UTP and ATP from the liver of mice treated with either vehicle (PEG-400 30%, PBS 70%), BRQ (20 mg/kg) or PRZ (10 mg/kg) over 30 days. (K, L) Fractional enrichment (%) of 13C-labeled metabolites derived from [13C4]-thiamine in ΔGART or ΔUMPS HeLa cells, cultured in the presence or absence of uridine or inosine (200 μM, 6 h). Normalized peak areas of ATP and UTP are shown. Data in (J) are mean ± s.d. n = 6 mice. For all the other panels, data are mean ± s.d. n = 3 independent replicates. * indicates P<0.05 for multiple comparisons calculated using one-way ANOVA with Tukey’s honest significant difference (HSD) test (D, F, H, I, J) or by a two-tailed Student’s t-test for pairwise comparisons (E, K, L).
Fig. 4.
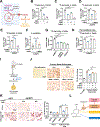
Fig. 4.. UTP is a substrate of TPK1 and supports pyruvate oxidation.
(A) Workflow of cellular permeabilization coupled with LC-MS/MS. (B) Steady-state levels of TPP from ΔUMPS HEK293E cells cultured in the presence or absence of uridine (200 μM), digitonin (10 μM), and supplemented with either vehicle (water), the indicated nucleotides (200 μM) for 8 hours prior to metabolite extraction. (C) Citrate (M+2)/pyruvate (M+3) enrichment ratio from ΔUMPS HEK293E cells treated as in (B) but labeled with [13C3]-pyruvate for 3 hours. (D) Fractional enrichment (%) of 13C-labeled metabolites derived from [13C3]-pyruvate labeling in ΔUMPS HEK293E cells measured and treated as in (C). Normalized peak areas of UTP are shown. (E) Citrate (M+2)/pyruvate (M+3) ratio from ΔUMPS HEK293E cells treated as in (B, C) but supplemented with indicated concentration of TPP and labeled with [13C6]-glucose for the final 4 hours. (F) Kinetic assays with human TPK1 purified from E. coli incubated with increasing concentrations of UTP or ATP over time. The product TPP was detected by LC-MS/MS. (G) Binding of radiolabeled UTP to TPK1. Cold UTP was added where indicated. (H) Virtual ligand screening and docking simulation for UTP on human TPK1 identified putative UTP binding pocket. (I) SDS-polyacrylamide gel electrophoresis (PAGE), followed by Coomassie blue staining, was used to analyze human TPK1 protein preparation from E. coli. TPP levels measured by LC-MS from purified human wild-type or mutants TPK1 incubated with thiamine (1 mM), UTP (1 mM) or ATP (1 mM). (J) Immunoblots and TPP levels from sgTPK1 HEK293E cells reconstituted with empty vector (EV), wild-type (WT), D100A/F101A (DA/FA), D100A, or F101A human TPK1. * indicates P<0.05 calculated using a one-way ANOVA with Tukey’s honest significant difference (HSD) test for multiple comparisons (B-E, I, J) or a two-tailed Student’s t-test for pairwise comparisons (G).
Fig. 5.
Fig. 5.. Maintenance of de novo lipogenesis and adipocyte differentiation by UTP.
(A) Schematic illustrating the central role of citrate downstream of PDH for the maintenance of de novo lipogenesis. (B) Relative incorporation of 14C from [U-14C]-glucose into lipids in HEK293E cells treated with vehicle (DMSO), brequinar (BRQ, 1 μM, 16 h) or GSK 2194069 (FASNi, 20 μM, 16 h). (C) 14C incorporation from [2-14C]-pyruvate into lipids in 3T3-L1 fibroblasts treated with vehicle (DMSO), brequinar (BRQ, 1 μM, 16 h), CPI-613 (PDHi, 100 μM, 16 h), or GSK 2194069 (FASNi, 20 μM, 16h). (D)14C incorporation from [2-14C]-pyruvate into lipids in ΔUMPS HEK293E cells cultured in the presence or absence of uridine (200 μM, 16 h), stably reconstituted or not with UMPS cDNA. (E) 14C incorporation from [1-14C]-acetate into lipids in ΔUMPS HEK293E cells cultured and treated as in (D). For a positive control, cells were treated with GSK 2194069 (FASNi, 20 μM, 3 h). (F) ΔUMPS HEK293E cells reconstituted or not with UMPS cDNA, in the presence or absence of uridine (200 μM, 16 h) and labeled with radioactive [1-14C]-palmitate. Measurement of 14C-carbon dioxide reflects fatty acid oxidation. (G) 14C incorporation from [2-14C]-pyruvate into lipids in ΔUMPS, ΔPDHA1, or ΔUMPS/ΔPDHA1 HEK293E cells treated as in (D). (H) 14C incorporation from [2-14C]-pyruvate into lipids in ΔUMPS HEK293E cells cultured in the presence or absence of uridine (200 μM), permeabilized with digitonin (10 μM), and treated with vehicle (water) or UTP (1 mM) for 8 hours and labeled with [2-14C]-pyruvate for the last two hours. (I) Schematic illustrating the adipocyte differentiation of primary preadipocytes extracted from mouse fat pads. (J) Adipocyte differentiation of mouse primary white preadipocytes treated with vehicle (DMSO) or BRQ (200 nM) for 4 days in the presence or absence of uridine (200 μM) or acetate (1 mM). Oil red O staining and quantification are shown. (K) Adipocyte differentiation of sgUMPS 3T3-L1 fibroblasts cultured in the presence of high (200 μM) or low (50 nM) concentration of uridine. Oil red O staining and quantification are shown. (L) Regulation of vitamin B1 metabolism and pyruvate oxidation by UTP levels. Data are mean ± s.d. n = 3 independent replicates. * indicates P<0.05 for multiple comparisons calculated using a one-way ANOVA with Tukey’s honest significant difference (HSD) test (B-H, K).

References

    1. Lane AN, Fan TW, Regulation of mammalian nucleotide metabolism and biosynthesis. Nucleic acids research 43, 2466–2485 (2015). - PMC - PubMed
    1. Zhu J, Thompson CB, Metabolic regulation of cell growth and proliferation. Nature reviews. Molecular cell biology 20, 436–450 (2019). - PMC - PubMed
    1. Martínez-Reyes I, Chandel NS, Mitochondrial TCA cycle metabolites control physiology and disease. Nature communications 11, 102 (2020). - PMC - PubMed
    1. Vander Heiden MG et al., Metabolic pathway alterations that support cell proliferation. Cold Spring Harbor symposia on quantitative biology 76, 325–334 (2011). - PubMed
    1. Villa E, Ali ES, Sahu U, Ben-Sahra I, Cancer Cells Tune the Signaling Pathways to Empower de Novo Synthesis of Nucleotides. Cancers 11, (2019). - PMC - PubMed

Publication types