. 2024 Jan 8;18(1):wrae054.
doi: 10.1093/ismejo/wrae054.

Hypervirulent Klebsiella pneumoniae employs genomic island encoded toxins against bacterial competitors in the gut

Affiliations

Hypervirulent Klebsiella pneumoniae employs genomic island encoded toxins against bacterial competitors in the gut

Yi Han Tan et al. ISME J. .

Erratum in

Abstract

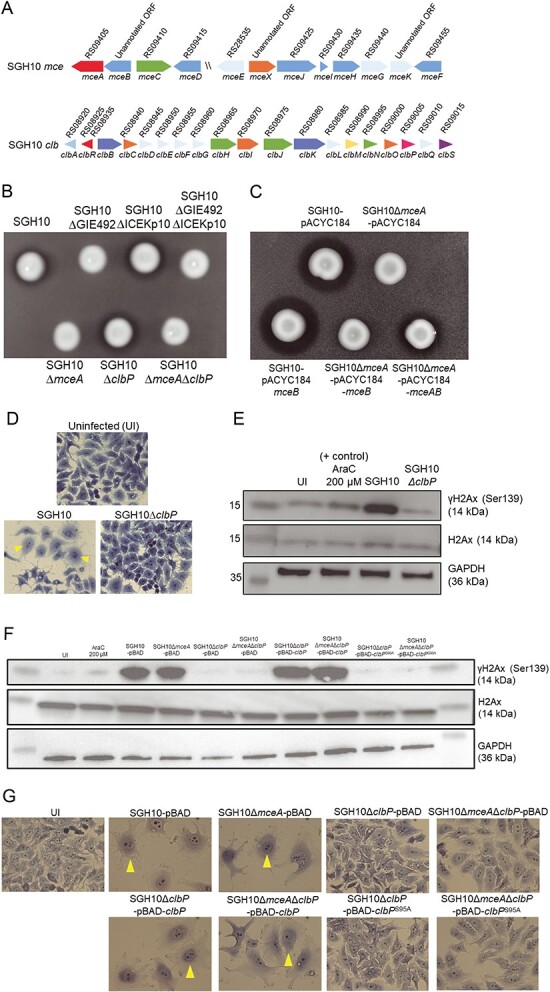
The hypervirulent lineages of Klebsiella pneumoniae (HvKp) cause invasive infections such as Klebsiella-liver abscess. Invasive infection often occurs after initial colonization of the host gastrointestinal tract by HvKp. Over 80% of HvKp isolates belong to the clonal group 23 sublineage I that has acquired genomic islands (GIs) GIE492 and ICEKp10. Our analysis of 12 361 K. pneumoniae genomes revealed that GIs GIE492 and ICEKp10 are co-associated with the CG23-I and CG10118 HvKp lineages. GIE492 and ICEKp10 enable HvKp to make a functional bacteriocin microcin E492 (mccE492) and the genotoxin colibactin, respectively. We discovered that GIE492 and ICEKp10 play cooperative roles and enhance gastrointestinal colonization by HvKp. Colibactin is the primary driver of this effect, modifying gut microbiome diversity. Our in vitro assays demonstrate that colibactin and mccE492 kill or inhibit a range of Gram-negative Klebsiella species and Escherichia coli strains, including Gram-positive bacteria, sometimes cooperatively. Moreover, mccE492 and colibactin kill human anaerobic gut commensals that are similar to the taxa found altered by colibactin in the mouse intestines. Our findings suggest that GIs GIE492 and ICEKp10 enable HvKp to kill several commensal bacterial taxa during interspecies interactions in the gut. Thus, acquisition of GIE492 and ICEKp10 could enable better carriage in host populations and explain the dominance of the CG23-I HvKp lineage.

Keywords: Klebsiella pneumoniae; colibactin; colonization; commensal; genomic island; gut; hypervirulent; microcin.


Conflict of interest statement

We declare that the authors do not possess any competing financial interests in relation to the work published.

Figures

Graphical Abstract
Graphical Abstract
Figure 1
Figure 1
Genomic structure and phylogenetic distribution of GIE492 in K. pneumoniae; (A) sequence alignment of GIE492 structural variants of K. pneumoniae (GIE492-I to GIE492-VIII), as well as GIE492 variants in K. michiganesis (GIE492-Kmi1 and 2) and E. coli (GIE492-Ec); (B) distribution of GIE492 and ICEKp variants in 588 GIE492+ K. pneumoniae genomes; a maximum-likelihood tree of the GIE492+ genomes was plotted based on core genome multilocus sequence alignment (cgMSA) of the scgMLSTv2 scheme; colors indicating GIE492-I and GIE492-II indicate their respective one-locus variants; ICEKp10 and ICEKp12 colored slots also include versions of these elements predicted as incomplete by Kleborate.
Figure 2
Figure 2
The clonal group-23 HvKp strain SGH10 produces active microcin E492 and colibactin; (A) genetic organization of the mce and clb loci in SGH10; mceB is an unannotated open reading frame (ORF) from base pairs 1 924 637–1 924 924, mceX is an unannotated ORF from base pairs 1 930 032–1 930 139, and mceK is an unannotated ORF from base pairs 1 935 889–1 936 298; (B) an agar diffusion assay was used to confirm if SGH10 produced a functional mccE492; SGH10 and mutant strains were spotted on a lawn of E. coli MG1655 prey; a growth inhibition halo can be observed around microcin producing strains; (C) the agar diffusion assay was used to demonstrate complementation of SGH10ΔmceA; SGH10 and SGH10ΔmceA containing a control plasmid pACYC184, pACYC184-mceB, or pACYC184-mceAB were spotted on a lawn of prey E. coli MG1655; strains producing mccE492 are surrounded by a halo of killed E. coli; (D) light micrographs of methylene blue-stained HepG2 cells infected with SGH10 and SGH10∆clbP at an MOI of 50:1 at 48 hpi; the cells were imaged at 20× magnification, and yellow arrows indicate megalocytotic cells with distended nuclei and cell bodies; (E) measurement of γH2Ax in Kp-infected cells; HepG2 cells were infected with the complemented SGH10 and mutant strains at an MOI of 50:1, and cytarabine (AraC) was used as a positive control; cell lysates were harvested at 8 hpi for western blotting to quantify γH2Ax (Ser139, phosphorylated at serine 139), and H2Ax and GAPDH were included as loading controls; (F) complementation of SGH10∆clbP. HepG2 cells was infected with SGH10, SGH10∆mceA, SGH10∆clbP, and SGH10∆mceAclbP carrying either the pmLBAD (pBAD) control vector or pBAD expressing either wildtype ClbP or ClbPS95A at an MOI of 50:1; 200 μM cytarabine (AraC) was used as a positive control for DNA damage and UI denotes uninfected cells; cell lysates were harvested at 8 hpi for western blotting to quantify γH2Ax, H2Ax, and GAPDH as a control; (G) at 48 hpi, HepG2 cells infected in the same manner as in (F) were fixed and stained with Giemsa and imaged at 20× magnification; megalocytotic cells are indicated with arrows.
Figure 3
Figure 3
The roles of mccE492 and colibactin during HvKp infection; a systemic infection was established via intraperitoneal injection of C57BL/6 mice with 105 CFU of SGH10, SGH10ΔGIE492, SGH10ΔICEKp10, and SGH10 ΔGIE492ΔICEKp10; bacterial loads were quantified in the liver, lungs, and spleen at 30 hpi; (B) mice were colonized with SGH10, SGH10ΔGIE492, SGH10ΔICEKp10, as well as C SGH10ΔmceA, SGH10ΔclbP and SGH10ΔmceAΔclbP; C57BL/6 mice were treated with ampicillin for 5 days before oral gavage with 5 x 10⁶ CFU SGH10 and mutants; stool bacterial loads were quantified at appropriate intervals; mouse infection experiments were performed n = 2–4 times; the geometric mean and SD were plotted, and Dunnett’s multiple comparisons test was performed on log-transformed CFU values to determine differences in means; * denotes P < .05 and ** denotes P < .01.
Figure 4
Figure 4
The role of colibactin in bacterial translocation; (A) a murine model of HvKp translocation was used to determine the lethality of SGH10 or SGH10ΔclbP; 1 × PBS was used as a control; (B) the mice were scored daily for signs of sickness and culled when they reached termination criteria; a survival curve of mortality induced by SGH10 and SGH10ΔclbP was plotted; The Mantel–Cox test was performed to determine if there were significant differences in mortality between the groups; (C) stool bacterial-loads of SGH10 and SGH10ΔclbP infected mice; (D) weight change (%) relative to the initial weight of the mice during the experiment was plotted; mice were culled when they met termination criteria or if weight loss was greater than 20%; (E) stool lipocalin-2 was measured by ELISA; the geometric mean and SD are plotted for (C and E), and mouse experiments were performed n = 2 times; Dunnett’s multiple comparisons test was performed on log-transformed values to determine differences in means; * denotes P < .05, and ** denotes P < .01.
Figure 5
Figure 5
Colibactin-dependent alteration of the murine gut microbiome; (A) differences in α-diversity between mice colonized with SGH10 or mutants; richness, Shannon and Simpson index values were plotted and linear mixed models that adjust for batch were used to determine if there were significant differences between groups; the P value of SGH10 vs. SGH10ΔclbP at D11 and D13 is .012 and .027 respectively; (B) PCoA (principal Co-ordinates analysis) was performed on Bray–Curtis distance data as a measure of β-diversity, and PCoA1–PCoA2 were plotted for all groups; centroids of each group are indicated with black dots and connected with arrows; (C) PCoA1–PCoA2 plots of Bray–Curtis distance data (β-diversity) were individually plotted by group; ellipses which represent 90% confidence interval are drawn around each timepoint and arrows are plotted connecting the centroids of each timepoint within groups; PERMANOVA analysis of the Bray–Curtis data determined that there were significant differences in β-diversity between SGH10 vs. SGH10ΔclbP and SGH10 vs. SGH10ΔmceAΔclbP at D11; R2 and P values are listed in Supplementary Table 3; the R2 value represents the percentage of variance in the data explained by the distinctions between groups when comparing each mutant to the wild type; a higher R2 indicates a more pronounced impact of the group differences on the dissimilarity observed among samples; the alpha value cutoff was set to 0.05; (D) differential abundance analysis was conducted using MaAsLin2, comparing SGH10 vs. SGH10ΔclbP and SGH10 vs SGH10ΔmceAΔclbP at D11 and D13; colored cells marked with “•” correspond to FDR-adjusted P value <.1; taxa which are positively or negatively abundant relative to SGH10 are plotted, and P values are listed in Supplementary Table 4; the Oscillibacter, Lachnospiraceae, Eubacterium, Dorea, Acetatifactor taxa belong to the Clostridiales order, whereas Muribaculae belongs to the Bacteroidales order and Parvibacter belongs to the Eggerthellales order. Klebsiella variicola and Escherichia belong to the Enterobacterales order, E. faecalis to the Lactobacillales order, and Acutalibacter muris to the Eubacteriales.
Figure 6
Figure 6
HvKp can utilize mccE492 and colibactin to kill other bacteria; (A) survival of E. coli MG1655 (Ec) when competed with K. pneumoniae on solid media for 24 h; (B) sensitivity of anaerobic bacteria to killing by mccE492 and colibactin; we competed D. longicatena (Dl), (C) Lachnospiraceae 24 430 (Lachno), (D) O. acetigenes (Oa), (E) C. difficile (Cd), (F) B. adolescentis (BA), (G) B. longum (BL), (H) B. thetaiotaomicron, and (I) B. uniformis with SGH10 and mutants deficient in the synthesis of colibactin, mccE492, or both under anoxic conditions; Dunnett’s multiple comparisons test was performed on CFU values to determine differences in means; * denotes P < .05 and ** denotes P < .01.
Figure 7
Figure 7
Effect of mccE492 and colibactin on other bacteria; (A) susceptibility of bacteria to mccE492 and colibactin; these bacteria did not possess immunity proteins to colibactin or mccE492; first column (yellow) denotes susceptibility to mccE492, second column (blue) denotes susceptibility to colibactin, and third column (green) denotes that a cooperative killing effect of both molecules is observed; unshaded boxes indicate insensitivity to these molecules; bacteria CFU are plotted in Fig. 6, and Supplementary Fig. 7,8; for all datasets described in this figure, mean ± SD are plotted (n = 3–4), and Dunnett’s multiple comparisons test was performed on CFU values to determine differences in means; * denotes P < .05 and ** denotes P < .01; (B) an in vivo predator–prey experiment was conducted in the murine model of gastrointestinal colonization with K. pneumoniae (Kp) NUH56 as prey; C57BL6/J mice were infected with 105 CFU of Kp NUH56 by oral gavage after ampicillin treatment for 5 days; 8 h later, the mice were gavaged with 5 x 10⁵ CFU of SGH10ΔlacZ, SGH10ΔmceAΔlacZ, SGH10ΔclbPΔlacZ, or SGH10ΔmceAΔclbPΔlacZ; (C) the bacterial loads of NUH56 or D the SGH10 ΔlacZ mutants in stool were quantified; the geometric mean and SD are plotted (n = 1), and Dunnett’s multiple comparisons test was performed on log-transformed CFU values to determine differences in means; * denotes P < .05.
Figure 8
Figure 8
Mechanism of mccE492 and colibactin mediated killing of other bacteria; (A) outer membrane perturbation by mccE492 was measured by NPN uptake in E. coli MG1655; (B) colistin was used as a positive control for outer membrane perturbation; NPN assays were performed n = 3 times and values are expressed as mean ± SD; (C) the TUNEL assay was used to quantify DNA damage of E. coli MG1655 co-incubated with SGH10 and mutants on solid media for 4 h under oxic and (D anoxic conditions; 50 μg/ml ciprofloxacin (Cip) was used as a positive control for DNA damage; (E) Propidium iodide (PI) uptake was measured in BA and (F) BL treated with mccE492 for 30 min; a positive control (+ control) for PI uptake was generated by treating BA and BL with lysozyme, mutanolysin, and isopropanol; (G) TUNEL assays were conducted to measure DNA damage in BA and H BL co-incubated with SGH10 and mutants for 4 h under anoxic conditions; 1% H2O2 is used as a positive control for DNA damage, and mean fluorescence intensity (MFI) values were quantified; in this figure, mean ± SD are plotted (n = 3–4), and Dunnett’s multiple comparisons test was performed to determine differences in means; * denotes P < .05.

References

    1. Belk WP. Pulmonary infections by Friedländer’s bacillus. J Infect Dis 1926;38:115–26. 10.1093/infdis/38.2.115 - DOI
    1. Liu YC, Cheng DL, Lin CL. Klebsiella pneumoniae liver abscess associated with septic endophthalmitis. Arch Intern Med 1986;10, 146:1913. 10.1001/archinte.1986.00360220057011 - DOI - PubMed
    1. Shon AS, Bajwa RPS, Russo TA. Hypervirulent (hypermucoviscous) Klebsiella pneumoniae: a new and dangerous breed. Virulence 2013;4:107–18. 10.4161/viru.22718 - DOI - PMC - PubMed
    1. Lam MMC, Wyres KL, Duchêne S et al. Population genomics of hypervirulent Klebsiella pneumoniae clonal-group 23 reveals early emergence and rapid global dissemination. Nat Commun 2018;9:2703. 10.1038/s41467-018-05114-7 - DOI - PMC - PubMed
    1. Struve C, Roe CC, Stegger M et al. Mapping the evolution of hypervirulent Klebsiella pneumoniae. mBio 2015;6:e00630. - PMC - PubMed