. 2024 Apr:102:105090.
doi: 10.1016/j.ebiom.2024.105090. Epub 2024 Mar 27.

A personalized medicine approach identifies enasidenib as an efficient treatment for IDH2 mutant chondrosarcoma

Affiliations

A personalized medicine approach identifies enasidenib as an efficient treatment for IDH2 mutant chondrosarcoma

Verónica Rey et al. EBioMedicine. 2024 Apr.

Abstract

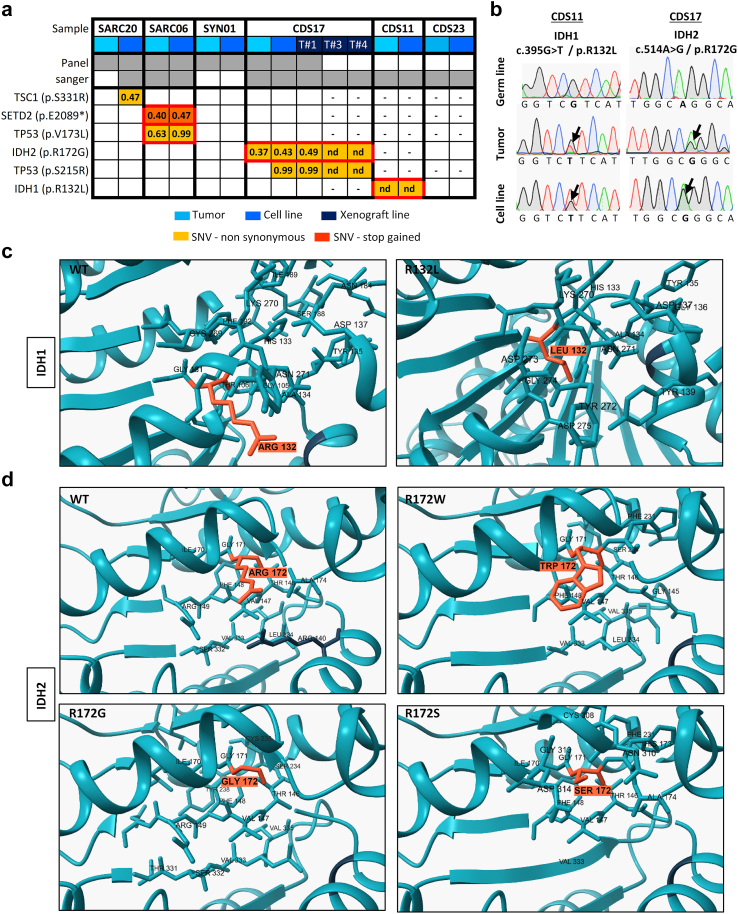
Background: Sarcomas represent an extensive group of malignant diseases affecting mesodermal tissues. Among sarcomas, the clinical management of chondrosarcomas remains a complex challenge, as high-grade tumours do not respond to current therapies. Mutations in the isocitrate dehydrogenase (IDH) 1 and 2 genes are among the most common mutations detected in chondrosarcomas and may represent a therapeutic opportunity. The presence of mutated IDH (mIDH) enzymes results in the accumulation of the oncometabolite 2-HG leading to molecular alterations that contribute to drive tumour growth.

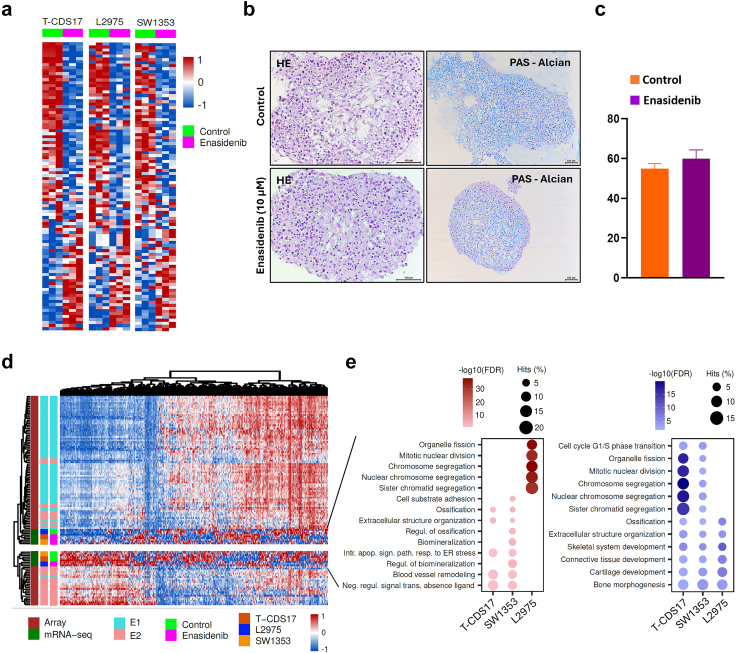
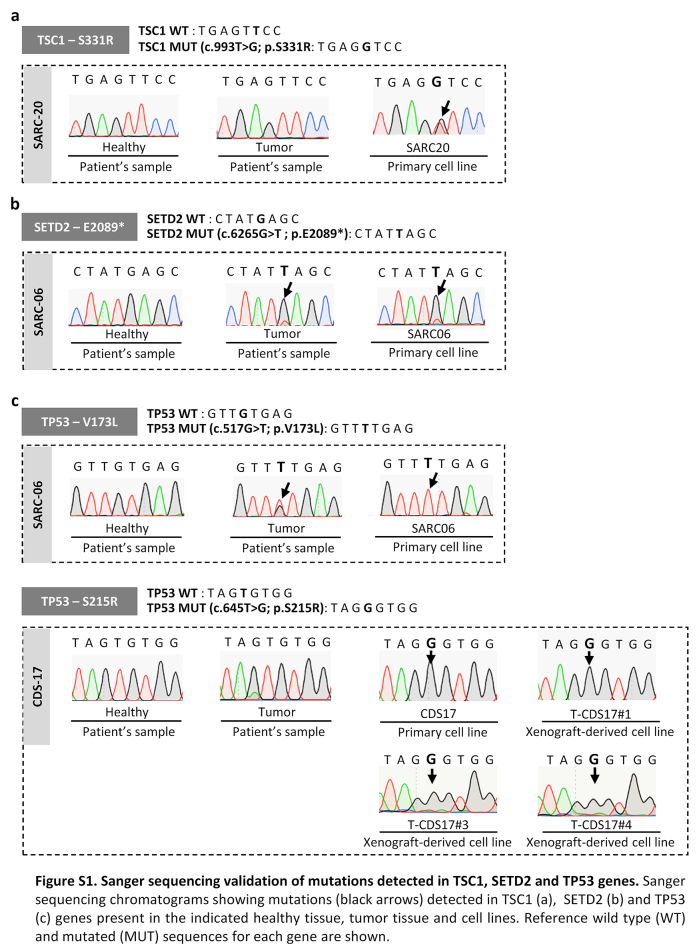
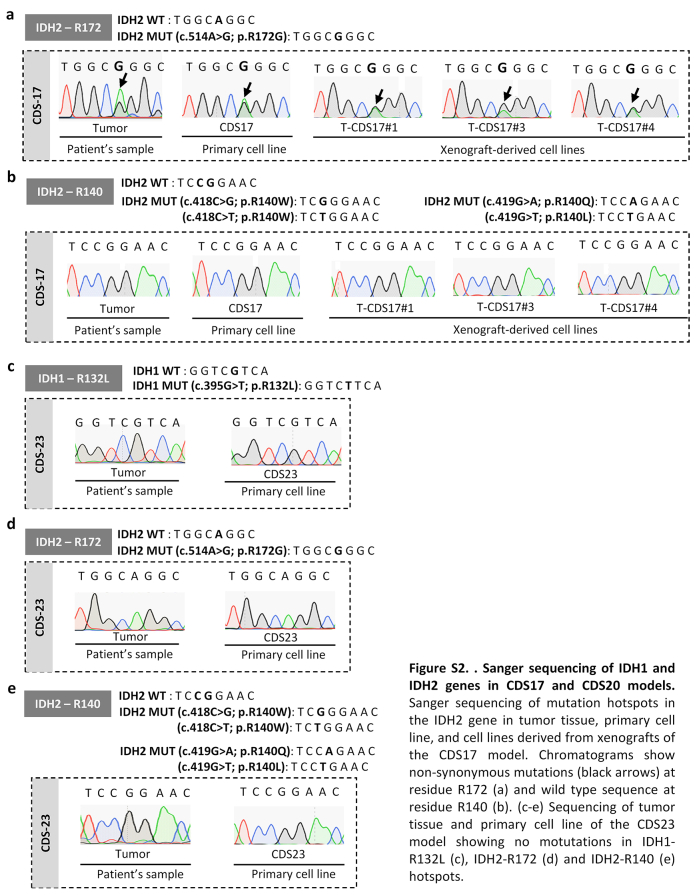
Methods: We developed a personalized medicine strategy based on the targeted NGS/Sanger sequencing of sarcoma samples (n = 6) and the use of matched patient-derived cell lines as a drug-testing platform. The anti-tumour potential of IDH mutations found in two chondrosarcoma cases was analysed in vitro, in vivo and molecularly (transcriptomic and DNA methylation analyses).

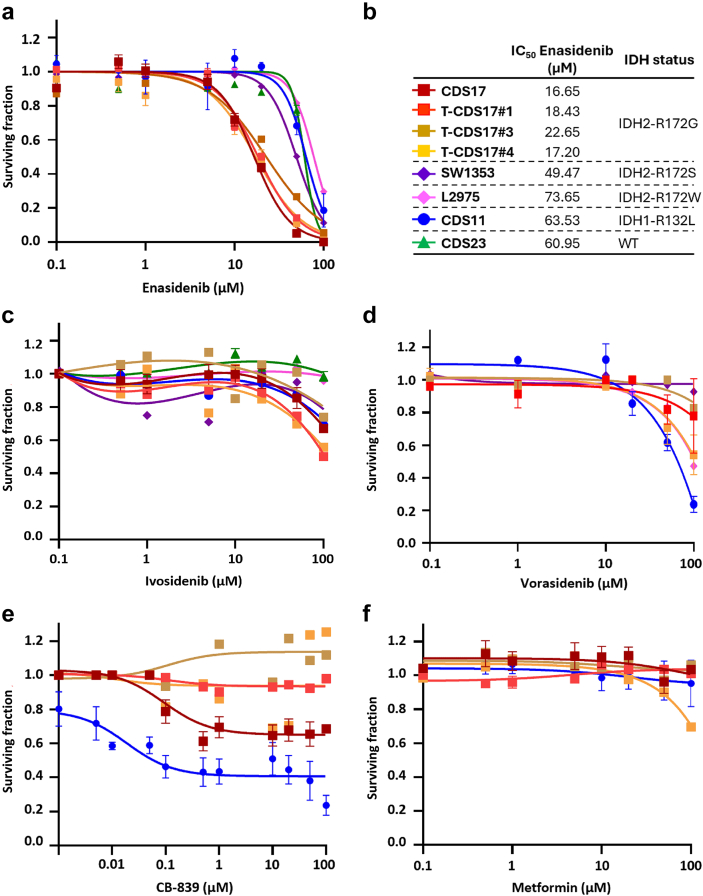
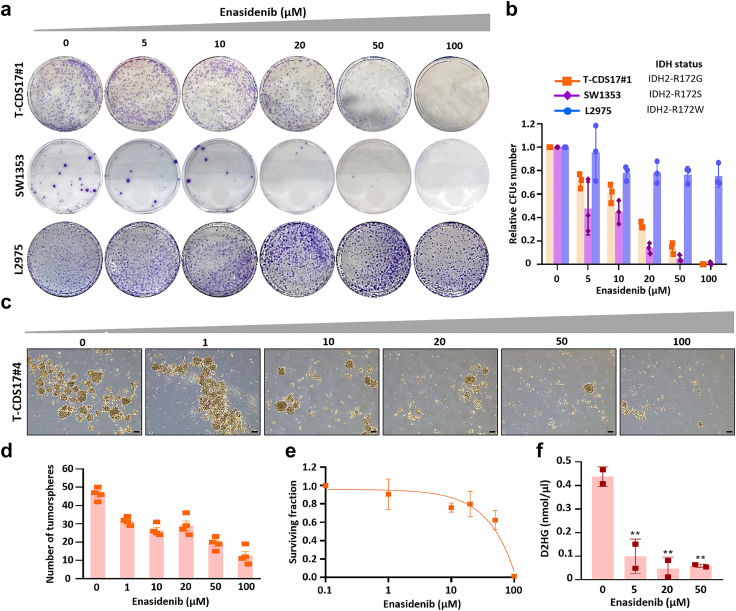
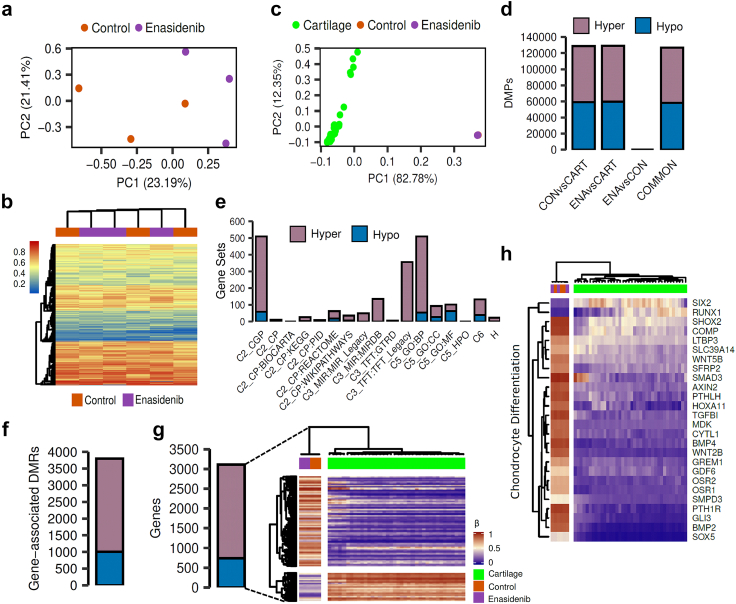
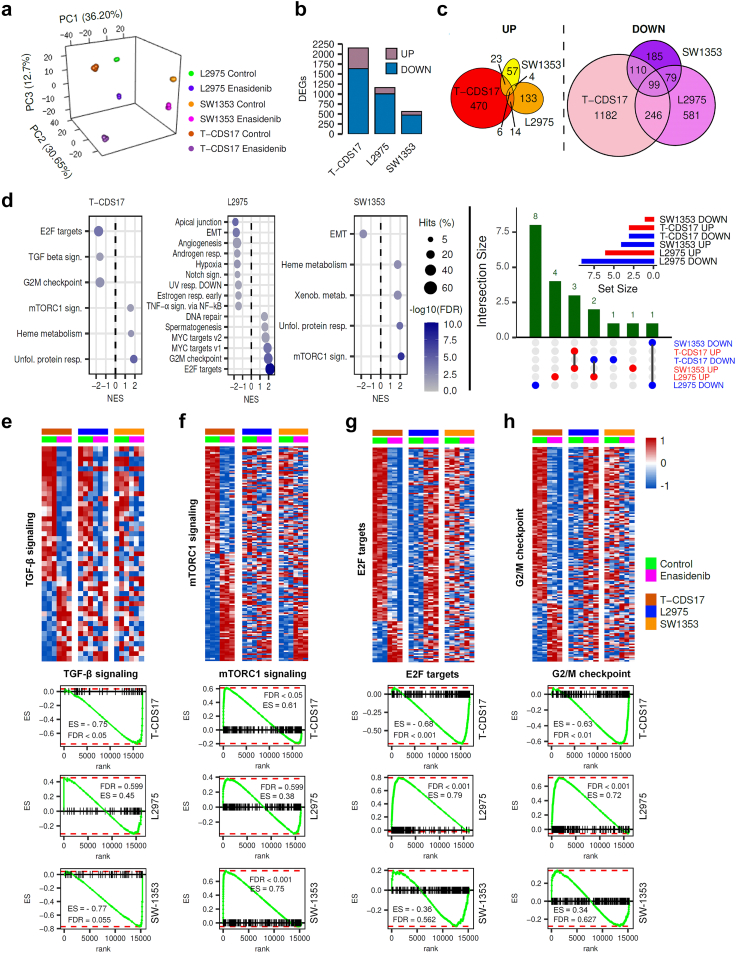
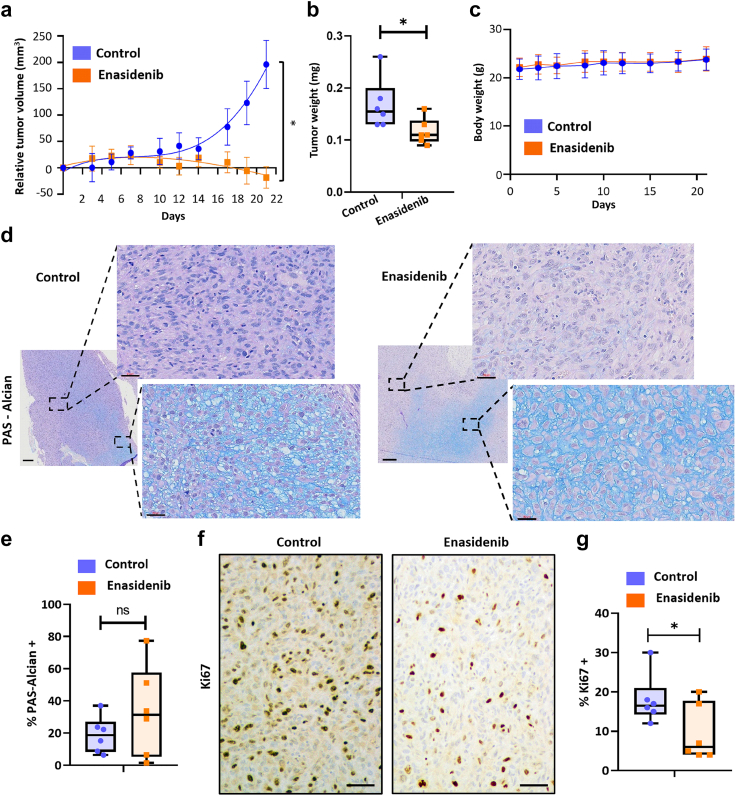
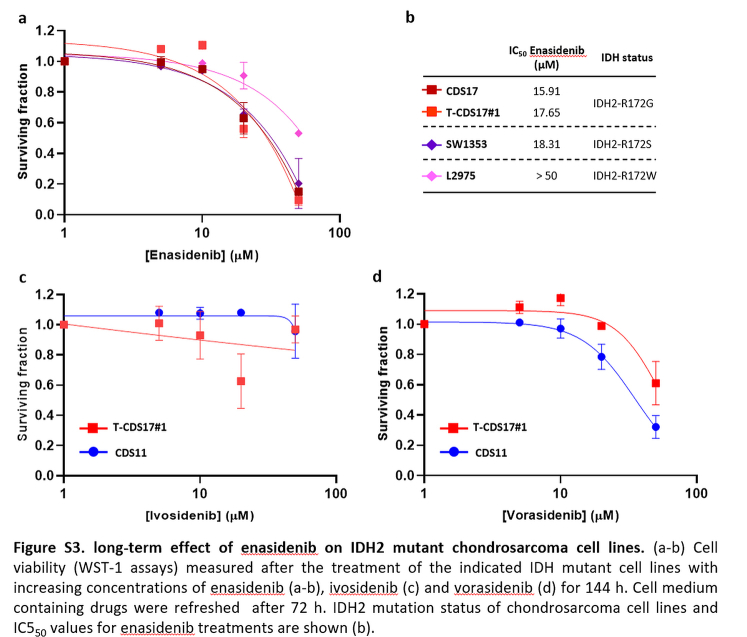
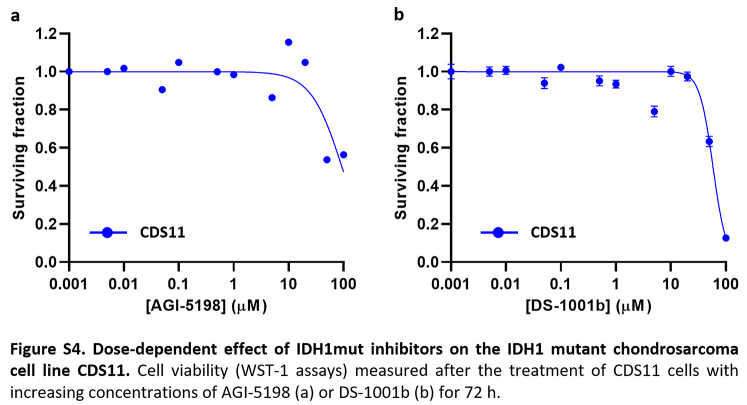
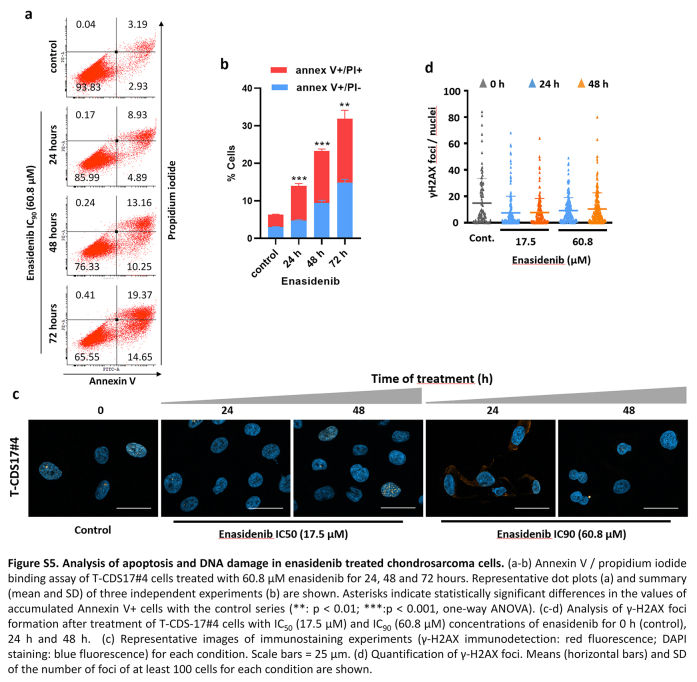
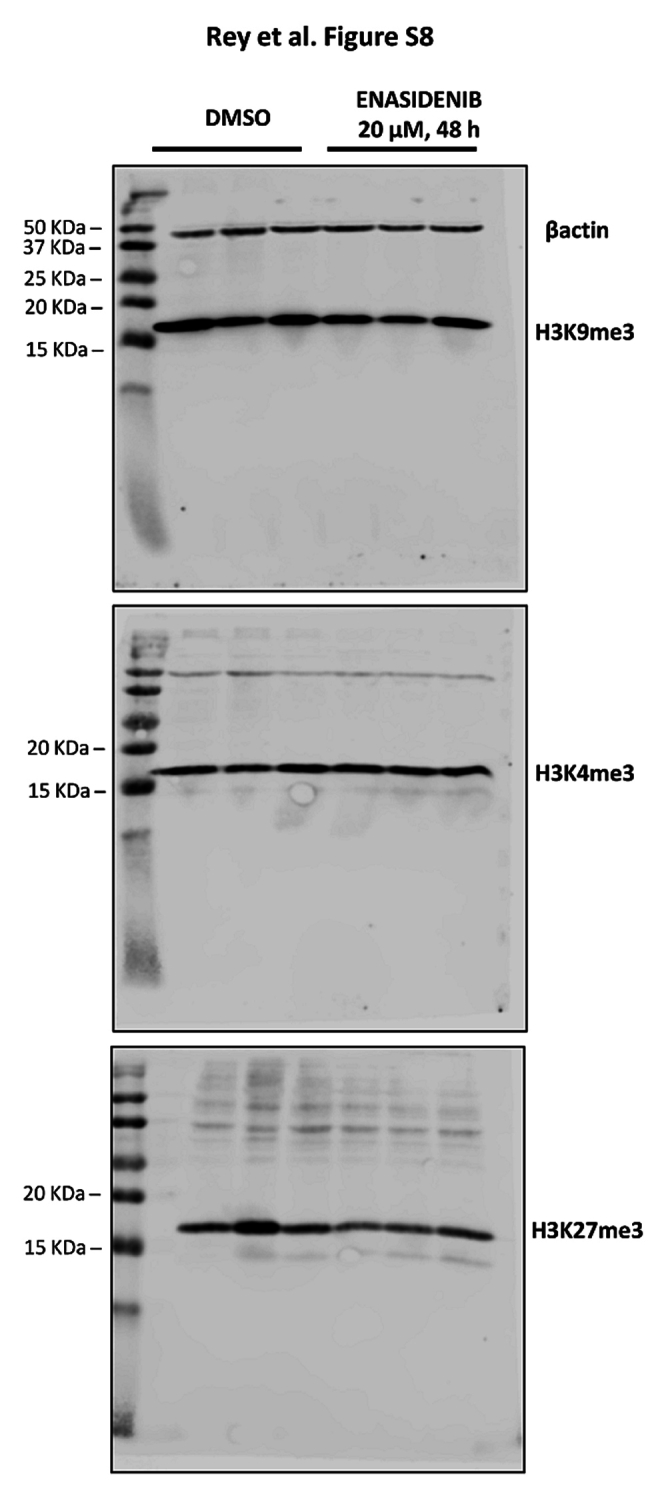
Findings: We treated several chondrosarcoma models with specific mIDH1/2 inhibitors. Among these treatments, only the mIDH2 inhibitor enasidenib was able to decrease 2-HG levels and efficiently reduce the viability of mIDH2 chondrosarcoma cells. Importantly, oral administration of enasidenib in xenografted mice resulted in a complete abrogation of tumour growth. Enasidenib induced a profound remodelling of the transcriptomic landscape not associated to changes in the 5 mC methylation levels and its anti-tumour effects were associated with the repression of proliferative pathways such as those controlled by E2F factors.

Interpretation: Overall, this work provides preclinical evidence for the use of enasidenib to treat mIDH2 chondrosarcomas.

Funding: Supported by the Spanish Research Agency/FEDER (grants PID2022-142020OB-I00; PID2019-106666RB-I00), the ISC III/FEDER (PI20CIII/00020; DTS18CIII/00005; CB16/12/00390; CB06/07/1009; CB19/07/00057); the GEIS group (GEIS-62); and the PCTI (Asturias)/FEDER (IDI/2021/000027).

Keywords: Chondrosarcoma; Enasidenib; IDH2; Patient-derived models; Personalized medicine.


Conflict of interest statement

Declaration of interests The authors declare that they have no conflict of interest.

Figures

Fig. 1
Fig. 1
Mutations found in patient-derived sarcoma models. (a) Summary of somatic mutations found by NSG-panel and/or Sanger sequencing in tumour samples and/or cell lines derived from six patients with sarcoma. Variant allele frequency for each mutation detected by NSG sequencing is indicated. (b) Sanger sequencing validation of IDH mutations found in CDS11 and CDS17 models (Sanger validation of the rest of mutations is presented in Figs. S1 and S2). (c and d) In silico docking modelling of the conformational changes caused by the mutation in IDH1 (c) and IDH2 (d) in the substrate-binding pocket. Residues 132 in IDH1 and 172 in IDH2 are highlighted. [(nd): not determined; (−): not assayed].
Fig. 2
Fig. 2
Dose-dependent effect of several inhibitory compounds on chondrosarcoma cell lines. (a–f) Cell viability (WST-1 assays) measured after the treatment of wild-type and mutant IDH chondrosarcoma cell lines with increasing concentrations of enasidenib (a), ivosidenib (c), vorasidenib (d), CB-839 (e) and metformin (f) for 72 h. IDH mutation status of chondrosarcoma cell lines and IC550 values for enasidenib treatments are shown (b). Error bars represent the standard deviation of three independent biological replicates.
Fig. 3
Fig. 3
Effect of enasidenib in IDH2 mutated chondrosarcoma cell lines. (a and b) Colony formation unit (CFU) assay of T-CDS17#1, SW1353 and L2975 cells treated with increasing concentrations of enasidenib for 24 h and left to form CFUs for 10 days. Representative pictures (a) and quantification (b) of CFU assays for each cell line are shown. (c–e) CSC-enriched tumourspheres of T-CDS17#4 cells were treated with increasing concentrations of enasidenib for 96 h. Representative pictures of the spheres cultures (c), quantification of the number of spheres (d) and cell viability (WST-1 assay) (e) of spheres at the end of the treatment are shown. Scale bar = 200 μm. (f) Intracellular D2HG levels were determined in T-CDS17#1 cells treated or not with the indicated concentrations of enasidenib for 48 h. Error bars represent the standard deviation of two biological replicates with technical triplicates for panel F and three biological replicates for the rest of the panels. Asterisks indicate statistically significant differences (∗∗: p < 0.01 one-way ANOVA).
Fig. 4
Fig. 4
Effect of enasidenib on the methylome of IDH2-mutant chondrosarcoma cells. T-CDS-17#1 cells were treated in biological triplicates with DMSO (control; CON) or 20 μM enasidenib (ENA) for 48 h prior to be processed for DNA methylation analysis. (a) Scatter plot showing the PCA of CON and ENA samples according to the beta methylation values at the top 50,000 most variable CpG sites. (b) Heatmap diagram depicting the beta methylation values of CON and ENA samples at the top 5000 most variable CpG sites. No differentially methylated positions (FDR <0.05, |Δβ|>20%) between ENA and CON samples were found. (c–h) analysis of the methylation data of CON and ENA samples along with a public-available methylation datasets of healthy human cartilage samples (CART) (n = 39). (c) PCA of CON, ENA and cartilage samples according to the beta methylation values at the top 50,000 most variable CpG sites belonging to the HumanMethylation450K array. (d) Barplots depicting the number of hyper- and hypomethylated DMPs (FDR <0.05, |Δβ|>20%) found in CON vs CART, ENA vs CART and ENA vs CON comparisons. COMMON bar includes those hyper- and hypo- DMPs that are in both CON vs CART and ENA vs CART comparisons. (e) Barplots showing the number of significantly enriched pathways found using hyper- and hypomethylated common DMPs for different MSigDB gene sets. (f) Barplot depicting the number of hyper- and hypomethylated DMRs (FDR <0.05, |Δβ|>20%) found in gene regions using common DMPs. (g) On the left, a barplot showing the number of hyper- and hypomethylated genes. On the right, a heatmap plot showing the beta methylation values of the aforementioned differentially methylated genes. (h) Heatmap plot depicting the beta methylation values of those differentially methylated genes that belong to the GO BP chondrocyte differentiation pathway.
Fig. 5
Fig. 5
Effect of enasidenib on the transcriptome of IDH2-mutant chondrosarcoma cells. T-CDS-17#1, SW1353 and L2975 cells were treated in biological triplicates with DMSO (control) or 20 μM enasidenib for 48 h prior to be processed for RNA sequencing. (a) Principal component analysis of all samples according to rlog expression values in the top 1000 most variable genes between control and treatment conditions for each cell type. (b) Bar plot depicting the number of differentially expressed genes (DEGs, FDR <0.05 and |log2 (FC)|>1) that were up- or down-regulated in each cell type by enasidenib treatment. (c) Venn diagrams showing the intersections between DEGS upregulated (left panel) and downregulated (right panel) by enasidenib in T-CDS-17#1, SW1353 and L2975 cells. The list of genes commonly upregulated and downregulated in the different cell lines is presented in Tables S5 and S6 respectively. (d) Bubble plots (left panels) showing significantly enriched pathways (GSEA, FDR <0.05) from the MSigDB Hallmark collection in each enasidenib-treated cell type. Upset plot (right panel) depicting intersections of significantly enriched pathways (FDR <0.05) in T-CDS17, L2975 and SW1353 cell lines. Set size of pathways up downregulated in each cell line is showed as an inset. (e–h) Top panels: heatmap plots showing the expression values of those DEGs (FDR <0.05) of the Hallmarks TGFβ (e), mTORC1 (f), E2F targets (g) and G/M checkpoint (h) signalling pathways. Bottom panels: GSEA analysis of these signalling pathways in the indicated cell lines. Enrichment score (ES) and False discovery rate (FDR) values are indicated.
Fig. 6
Fig. 6
Effect of enasidenib treatment in the chondrogenic differentiation pathway and proliferative status. (a–c) Heatmap plots depicting the expression values of genes belonging to the GO BP chondrocyte differentiation pathway according to enasidenib treatment for each cell line. (b–c) Histological analysis of formalin-fixed paraffin-embedded T-CDS17#1 cell spheroids growth in chondrocyte differentiation medium with or without (control) 10 μM enasidenib for 21 days. Representative images of H&E and PAS-alcian staining (b) and quantification of PAS-alcian stain (c) are displayed. Scale bars = 100 μm. Error bars represent the standard deviation of three independent experiments. (d) Heatmap plot showing the expression values of those genes belonging to the mRNA expression signature developed by Nicolle et al. (2019), including their microarray experiments and the classification of chondrosarcoma samples into E1/E2 subtypes (n = 102). (e) Bubble plots showing the top 5 most significant pathways (ORA, FDR <0.05) from the MSigDB GO BP collection in each cell type for up-regulated (left) and down-regulated (right) E1/E2 genes.
Fig. 7
Fig. 7
In vivo effect of enasidenib. Established T-CDS17 xenografts were randomly assigned to two different groups (n = 6 per group) and treated b.i.d. with vehicle solvent (control) or 35 mg/kg enasidenib for 21 days. (a) Curves representing the mean relative tumour volume of T-CDS17 xenografts during the treatments. (b) Average tumour weight at the end of the experiment. (c) Change in the body weights of mice during the treatments. (d–g) Histological analysis of formalin-fixed paraffin-embedded tumours extracted at the end of the treatment. (d) Representative images of PAS-alcian staining of control and treated tumours. Two different areas of the tissue are magnified. Scale bars = 300 μm for left panels and 30 μm for magnified right panels. (e) Quantification of the percentage of PAS-alcian stained areas. (f) immuno-staining detection of Ki67. Scale bars = 100 μm (g) Quantification of Ki67 positive cells. A summary of the experimental variables associated to each mouse and the correlation between them is showed in Figure S9. Error bars represent the SD and asterisks indicate statistically significant differences between groups in a two-tailed unpaired t-test (∗: p < 0.05; ns: not significant).
Figure S1
Figure S1
Figure S2
Figure S2
Figure S3
Figure S3
Figure S4
Figure S4
Figure S5
Figure S5
Figure S6
Figure S6
Figure S7
Figure S7
Figure S8
Figure S8
Figure S9
Figure S9
Western blots - Fig S8

References

    1. Salgado R., Moore H., Martens J.W.M., et al. Steps forward for cancer precision medicine. Nat Rev Drug Discov. 2018;17(1):1–2. doi: 10.1038/nrd.2017.218. - DOI - PubMed
    1. Lee J.K., Liu Z., Sa J.K., et al. Pharmacogenomic landscape of patient-derived tumor cells informs precision oncology therapy. Nat Genet. 2018;50(10):1399–1411. doi: 10.1038/s41588-018-0209-6. - DOI - PMC - PubMed
    1. Sayles L.C., Breese M.R., Koehne A.L., et al. Genome-informed targeted therapy for osteosarcoma. Cancer Discov. 2019;9(1):46–63. doi: 10.1158/2159-8290.CD-17-1152. - DOI - PMC - PubMed
    1. Cancer Genome Atlas Research Network Electronic address edsc, cancer genome atlas research N. Comprehensive and integrated genomic characterization of adult soft tissue sarcomas. Cell. 2017;171(4):950–965.e928. doi: 10.1016/j.cell.2017.10.014. - DOI - PMC - PubMed
    1. Kovac M., Blattmann C., Ribi S., et al. Exome sequencing of osteosarcoma reveals mutation signatures reminiscent of BRCA deficiency. Nat Commun. 2015;6:8940. doi: 10.1038/ncomms9940. - DOI - PMC - PubMed