. 2024 May;23(5):100754.
doi: 10.1016/j.mcpro.2024.100754. Epub 2024 Mar 27.

Systematic Optimization of Automated Phosphopeptide Enrichment for High-Sensitivity Phosphoproteomics

Affiliations

Systematic Optimization of Automated Phosphopeptide Enrichment for High-Sensitivity Phosphoproteomics

Patricia Bortel et al. Mol Cell Proteomics. 2024 May.

Abstract

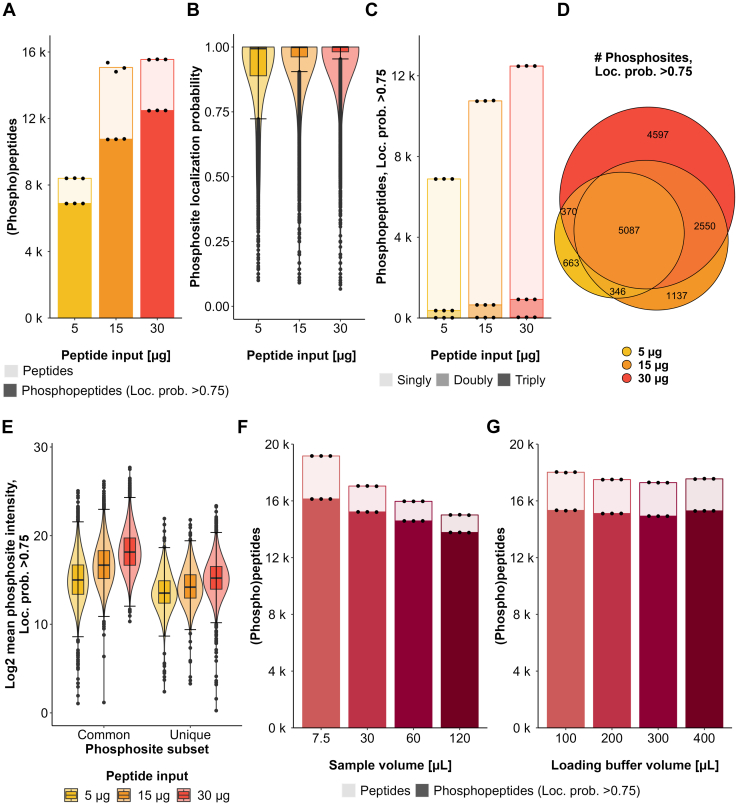
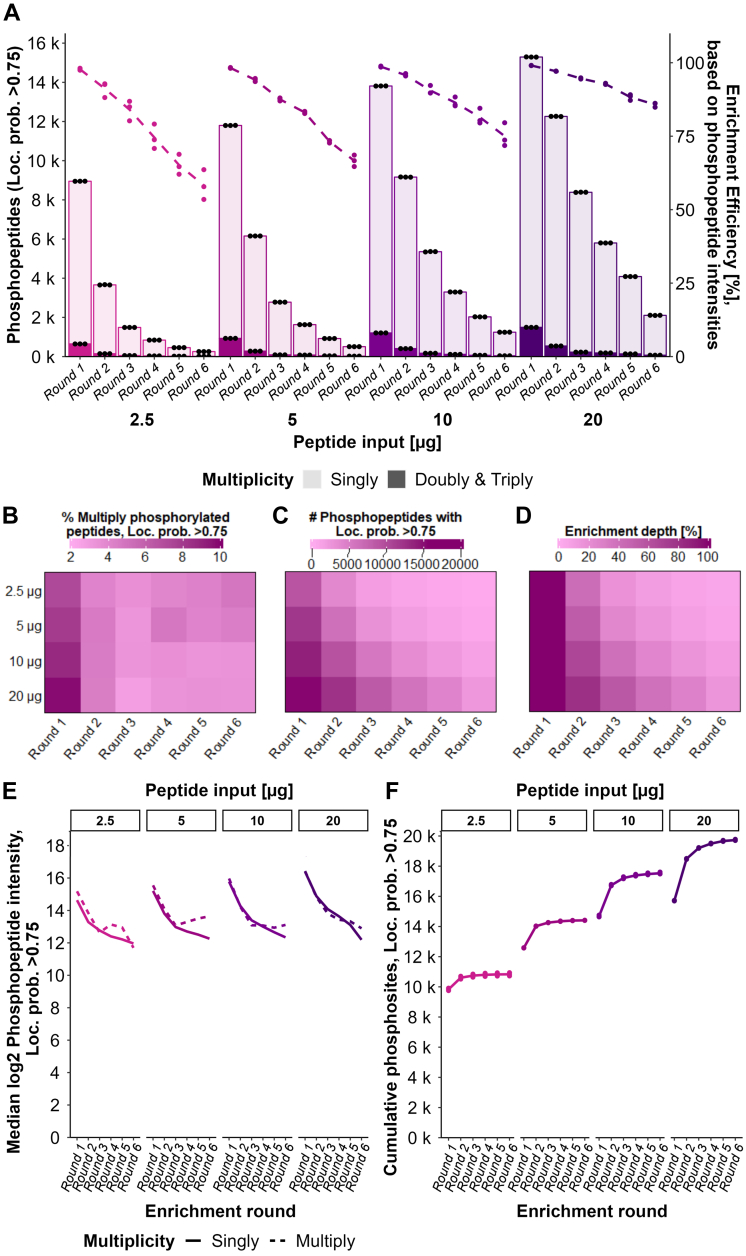
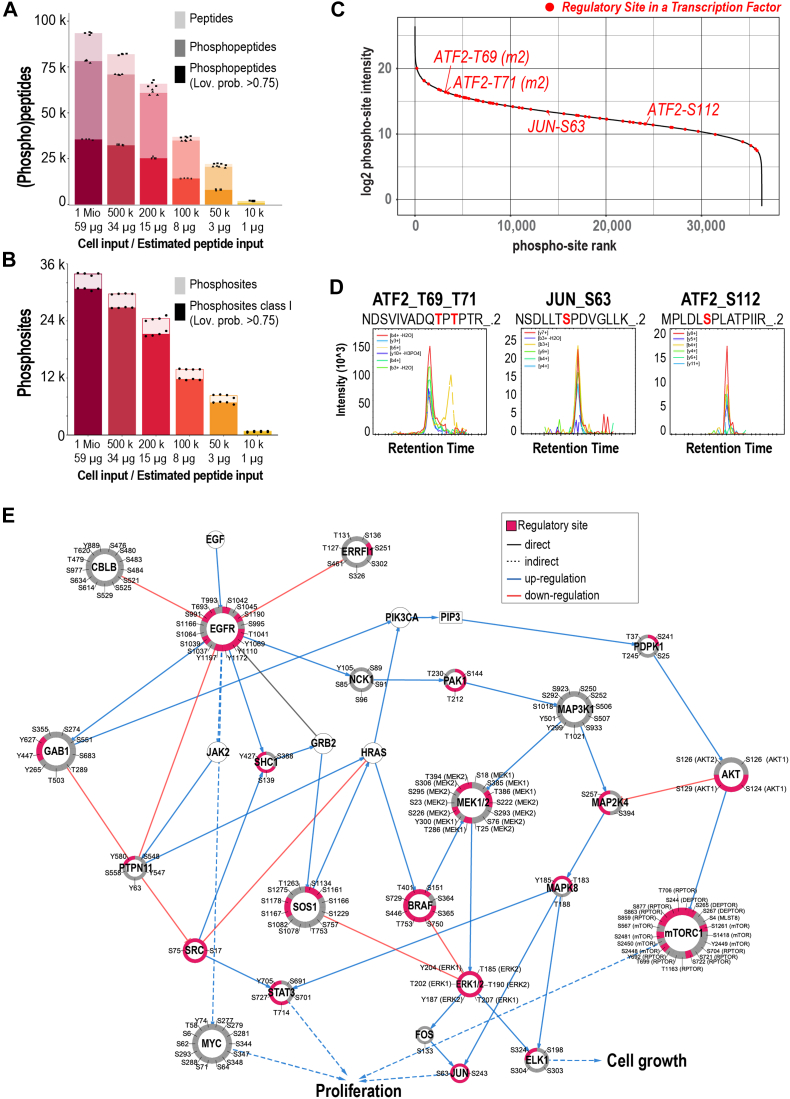
Improving coverage, robustness, and sensitivity is crucial for routine phosphoproteomics analysis by single-shot liquid chromatography-tandem mass spectrometry (LC-MS/MS) from minimal peptide inputs. Here, we systematically optimized key experimental parameters for automated on-bead phosphoproteomics sample preparation with a focus on low-input samples. Assessing the number of identified phosphopeptides, enrichment efficiency, site localization scores, and relative enrichment of multiply-phosphorylated peptides pinpointed critical variables influencing the resulting phosphoproteome. Optimizing glycolic acid concentration in the loading buffer, percentage of ammonium hydroxide in the elution buffer, peptide-to-beads ratio, binding time, sample, and loading buffer volumes allowed us to confidently identify >16,000 phosphopeptides in half-an-hour LC-MS/MS on an Orbitrap Exploris 480 using 30 μg of peptides as starting material. Furthermore, we evaluated how sequential enrichment can boost phosphoproteome coverage and showed that pooling fractions into a single LC-MS/MS analysis increased the depth. We also present an alternative phosphopeptide enrichment strategy based on stepwise addition of beads thereby boosting phosphoproteome coverage by 20%. Finally, we applied our optimized strategy to evaluate phosphoproteome depth with the Orbitrap Astral MS using a cell dilution series and were able to identify >32,000 phosphopeptides from 0.5 million HeLa cells in half-an-hour LC-MS/MS using narrow-window data-independent acquisition (nDIA).

Keywords: Orbitrap Astral; Orbitrap Exploris; automation; data independent acquisition; phosphoproteomics; sequential enrichment.


Conflict of interest statement

Conflict of interest The authors declare that they have no conflicts of interest with the contents of this article.

Figures

None
Graphical abstract
Fig. 1
Fig. 1
Experimental design.A, schematic overview of the phosphopeptide enrichment workflow and the evaluated experimental parameters. Evaluated parameters included the peptide input, the sample volume, the loading buffer volume, the proportion of glycolic acid in the loading buffer, the percentage of ammonium hydroxide in the elution buffer, the Zr-IMAC HP bead volume, and the sample-beads binding time. B, schematic overview of the sequential phosphopeptide enrichment workflow and the evaluated experimental parameters. Evaluated parameters included the peptide input amount of the sample, the number of sequential enrichment rounds and the way of retrieving the eluate by either reusing the elution buffer and obtaining a “Pooled” eluate or exchanging the elution buffer after each round and obtaining each enrichment round as single fraction for LC-MS/MS analysis. Modified sequential enrichment approaches included exchanging, reusing or increasing the Zr-IMAC HP bead volume.
Fig. 2
Fig. 2
Evaluation of experimental parameters during phosphopeptide enrichment.AD, barplots show the mean numbers of peptides (light color) and phosphopeptides with loc. prob. >0.75 (dark color) identified across three experimental replicates using different (A) molarities of glycolic in the loading buffer, (B) percentage of ammonium hydroxide in the elution buffer, (C) Zr-IMAC HP bead volumes or (D) sample-bead binding times. Each dot represents one experimental replicate. EH, Heatmaps show the influence of increasing molarity of glycolic acid in the loading buffer, percentage of ammonium hydroxide in the elution buffer, Zr-IMAC HP bead volume or sample-bead incubation time on (E) selectivity of the enrichment in terms of identified phosphorylated and non-phosphorylated peptides (F) number of identified phosphopeptides with loc. prob. >0.75 (G) percentage of multiply-phosphorylated peptides with loc. prob. >0.75 in the context of total identified phosphorylated peptides with loc. prob. >0.75 (H) median pI of phosphopeptides with loc. prob. >0.75. Stars refer to the highest value within the respective parameter column for (EG) and to the lowest value for (H). If not otherwise indicated, all values represent the mean of three experimental replicates. IL, barplots show the mean numbers of singly (light color), doubly (medium color), and triply (dark color) phosphorylated peptides with loc. prob. >0.75 identified across three experimental replicates using different (I) molarities of glycolic in the loading buffer, (J) percentage of ammonium hydroxide in the elution buffer, (K) Zr-IMAC HP bead volumes, or (L) sample-bead binding times. Each dot indicates one experimental replicate.
Fig. 3
Fig. 3
Evaluation of peptide input and sample/loading buffer volume effects.A, barplots show the mean number of peptides (light color) and phosphopeptides with loc. prob. >0.75 (dark color) identified across three experimental replicates using different peptide input amounts. Each dot represents one experimental replicate. B, violin plots show the range and distribution of the localization probability of phosphosites identified using different peptide input amounts. C, barplots show the mean numbers of singly (light color), doubly (medium color), and triply (dark color) phosphorylated peptides with loc. prob. >0.75 was identified across three experimental replicates using different peptide input amounts. Each dot represents one experimental replicate. D, the Venn diagram shows uniquely and commonly identified phosphosites with loc. prob. >0.75 among different peptide input amounts. E, Violin plots show the log2 mean intensities of uniquely and commonly identified phosphosites with loc. prob. >0.75 among different peptide input amounts. F, barplots show the mean numbers of peptides (light color) and phosphopeptides with loc. prob. >0.75 (dark color) identified across three experimental replicates using the same peptide input amount (30 μg) diluted in different sample volumes, mixed with the same volume of loading buffer (200 μl). Each dot represents one experimental replicate. G, barplots show the mean numbers of peptides (light color) and phosphopeptides with loc. prob. >0.75 (dark color) identified across three experimental replicates using the same peptide input amount (30 μg) diluted in the same sample volume (15 μl), mixed with different volumes of loading buffer. Each dot represents one experimental replicate.
Fig. 4
Fig. 4
Evaluation of an extensive 6-round sequential enrichment approach.A, barplots show the mean numbers of singly phosphorylated (light color) and multiply-phosphorylated (dark color) peptides with loc. prob. >0.75 (dark color) identified across three experimental replicates using different peptide input amounts for a sequential six-round enrichment. Each fraction (round) was obtained as eluate after the respective enrichment round and analyzed separately via LC-MS/MS. Each dot represents one experimental replicate. Line plots represent the mean enrichment efficiency across three experimental replicates in each round per peptide input amount based on phosphopeptide intensities in percentage. Each dot represents one experimental replicate. BD, Heatmaps show, for each peptide input amount and enrichment round, the (B) percentage of multiply-phosphorylated peptides with loc. prob. >0.75 in the context of the total number of identified phosphorylated peptides with loc. prob. >0.75 (C) number of identified phosphopeptides with loc. prob. >0.75 in the context of total identified phosphorylated peptides (D) enrichment depth in percentage in terms of number of identified phosphopeptides with loc. prob. >0.75 relative to round 1 of the respective peptide input amount. E, line plots show the medians of log2 mean intensities across replicates of singly and multiply-phosphorylated peptides with loc. prob. >0.75 identified in each enrichment round upon different peptide input amounts. F, line plots represent the mean number of cumulative phosphosites with loc. prob. >0.75 per peptide input amount and enrichment round across three experimental replicates. “Cumulative” refers to the addition of phosphosites that were not identified in the previous enrichment round(s). Each dot represents one experimental replicate.
Fig. 5
Fig. 5
Strategies for pooling sequential enrichment samples. A, barplots show the numbers of phosphopeptides with loc. prob. >0.75 (dark color), 3/3 valid intensity values among replicates (medium color) or with a CV <0.2 among replicate intensities (light color) identified in a two-round sequential enrichment approach using 2.5 μg (pink) or 5 μg (purple) peptide input amount. Each dot represents one replicate. Each fraction (round) was either obtained as eluate after the respective enrichment round and analyzed separately via LC-MS/MS (“Round 1” and “Round 2”) or obtained as a pooled eluate by reusing the elution buffer from the first enrichment round (“Pooled”). “Cumulative” refers to the cumulation of unique phosphopeptide IDs identified in the separate fractions (“Round 1” & “Round 2”) during data analysis. B, boxplots show the log2 mean intensities of identified phosphopeptides with loc. prob. >0.75 per fraction and peptide input amount. C, density plots show the distribution of CVs across replicates of phosphopeptide (loc. prob. >0.75) intensities per fraction (columns) and peptide input (rows) after normalization. The labels within the density plots show the median CVs.
Fig. 6
Fig. 6
Refined sequential enrichment pooling approach with increasing Zr-IMAC HP bead volume. Barplots show the numbers of phosphopeptides with loc. prob. >0.75 was identified using a three-round sequential enrichment approach with increasing Zr-IMAC HP bead volume for different peptide input amounts. “Normal” represents a standard single-round enrichment with 5 μl beads. “Pooled” represents a sequential enrichment for three rounds with increasing bead volume (Round 1: 1 μl beads, Round 2: +1 μl beads, Round 3: +2 μl beads) and rounds pooled into the same elution buffer. “Round 1”, “Round 2” and “Round 3” represent the identifications in the respective separately collected and analyzed fractions. “Cumulative” refers to the cumulation of unique phosphopeptides identified in the separate fractions (“Round 1”, “Round 2”, “Round 3”) during data analysis.
Fig. 7
Fig. 7
Two-round sequential enrichment for analysis of a HeLa dilution series for LC-MS/MS analysis on an Orbitrap Astral Mass Spectrometer.A, barplots show the mean numbers of peptides (light color), phosphopeptides (medium color) and phosphopeptides with loc. prob. >0.75 (dark color) identified across four experimental replicates using different cell input amounts in a 2-round pooled sequential enrichment. Each dot represents one experimental replicate. B, barplots show the mean numbers of phosphosites (light color), and class I phosphosites (loc. prob. >0.75) (dark color) identified across four experimental replicates using different cell input amounts in a 2-round pooled sequential enrichment. Each dot represents one experimental replicate. C, rank plot based on log2 intensities of phosphosites identified in the 1 million HeLa cells phosphopeptide enrichment experiment. Known regulatory sites from transcription factors are highlighted in red. Representative sites plotted in panel (D) are labeled. D, Extracted Ion Chromatograms at MS2 fragment level of selected sites highlighted in panel (C). E, EGFR signaling pathway network obtained from SIGNORApp (40). The size of the nodes indicates the number of phosphosites identified in the 1 million HeLa cells phosphopeptide enrichment experiment, which are labeled in the outer ring. Each section of the outer ring (41) corresponds to a phosphorylation site. Pink sections indicate which phosphosite is known to be regulatory (51).
Fig. 8
Fig. 8
Response to EGF treatment as a quantification benchmark of phosphoproteome analysis on an Orbitap Astral.A, experimental design. 12 replicates of HeLa cells treated with EGF for 8 min were compared to 12 replicates of non-treated HeLa cells. Samples were analyzed in a nested manner using either 3, 6, 9 or 12 replicates of each condition. B, average number of class I phosphosites identified in Spectronaut using 3, 6, 9 or 12 replicates for the search. Striped columns reflect the number of phosphosites quantified in all replicates. C, average number of class I phosphosites identified in Spectronaut using 3, 6, 9 or 12 replicates for the search. Striped columns reflect the number of phosphosites quantified in at least 75% of the replicates used in the analysis. D, histograms of the coefficient of variation at the phosphosite level between replicates measured in the different analyses. At the top, allowing 3 or more valid values. At the top, allowing only values quantified in all replicates. At the bottom, allowing three or more valid values. Dashed vertical lines indicate the median value for the coefficient of variation. E, number of significantly regulated phosphosites plotted against the q-value for the analysis using 6 (light blue), 9 (brown) or 12 replicates (yellow). F, heatmap of relevant sites in the EGFR signaling pathway. First heatmap shows the relative intensities (plotted as z-score per site across replicates). Second heatmap shows the log2 fold changes (EGF versus Control) measured in the different experimental designs: 12 versus 12, 9 versus 9, 6 versus 6 or 3 versus 3 replicates. The third heatmap shows the -log10 of the q-value obtained from the two-sample t test performed using 12 versus 12, 9 versus 9, 6 versus 6 or 3 versus 3 replicates. G, Bar plots of the mean log2 intensity of relevant sites in the EGFR signaling pathway in control (light color) and EGF treated samples (dark color).

References

    1. Humphrey S.J., Karayel O., James D.E., Mann M. High-throughput and high-sensitivity phosphoproteomics with the EasyPhos platform. Nat. Protoc. 2018;13:1897–1916. - PubMed
    1. Olsen J.V., Mann M. Status of large-scale analysis of post-translational modifications by mass spectrometry. Mol. Cell. Proteomics. 2013;12:3444–3452. - PMC - PubMed
    1. Lundby A., Andersen M.N., Steffensen A.B., Horn H., Kelstrup C.D., Francavilla C., et al. In vivo phosphoproteomics analysis reveals the cardiac targets of β-adrenergic receptor signaling. Sci. Signal. 2013;6 - PubMed
    1. Villén J., Beausoleil S.A., Gerber S.A., Gygi S.P. Large-scale phosphorylation analysis of mouse liver. PNAS. 2007;104:1488–1493. - PMC - PubMed
    1. Olsen J.V., Blagoev B., Gnad F., Macek B., Kumar C., Mortensen P., et al. Global, in vivo, and site-specific phosphorylation dynamics in signaling networks. Cell. 2006;127:635–648. - PubMed

LinkOut - more resources