

An optimized high-throughput SARS-CoV-2 dual reporter trans-complementation system for antiviral screening in vitro and in vivo
- PMID: 38548102
- PMCID: PMC11280264
- DOI: 10.1016/j.virs.2024.03.009
An optimized high-throughput SARS-CoV-2 dual reporter trans-complementation system for antiviral screening in vitro and in vivo
Abstract
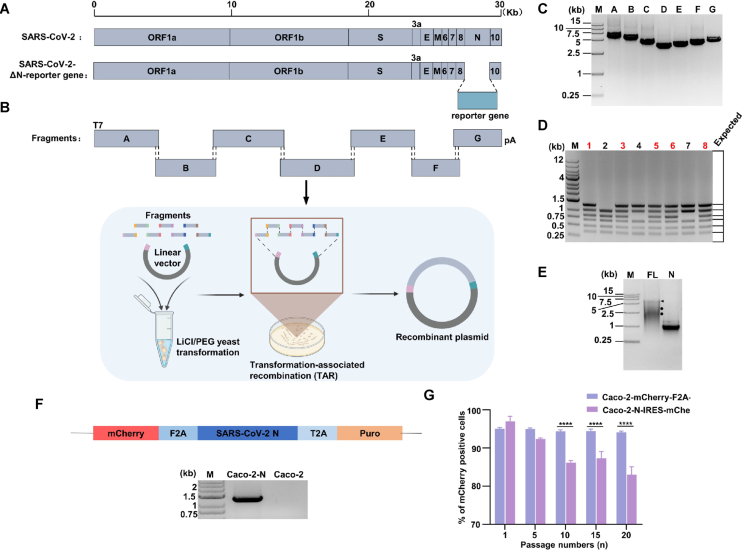
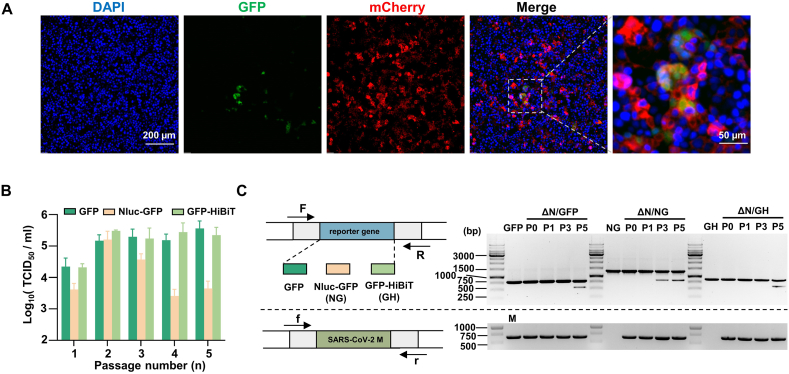
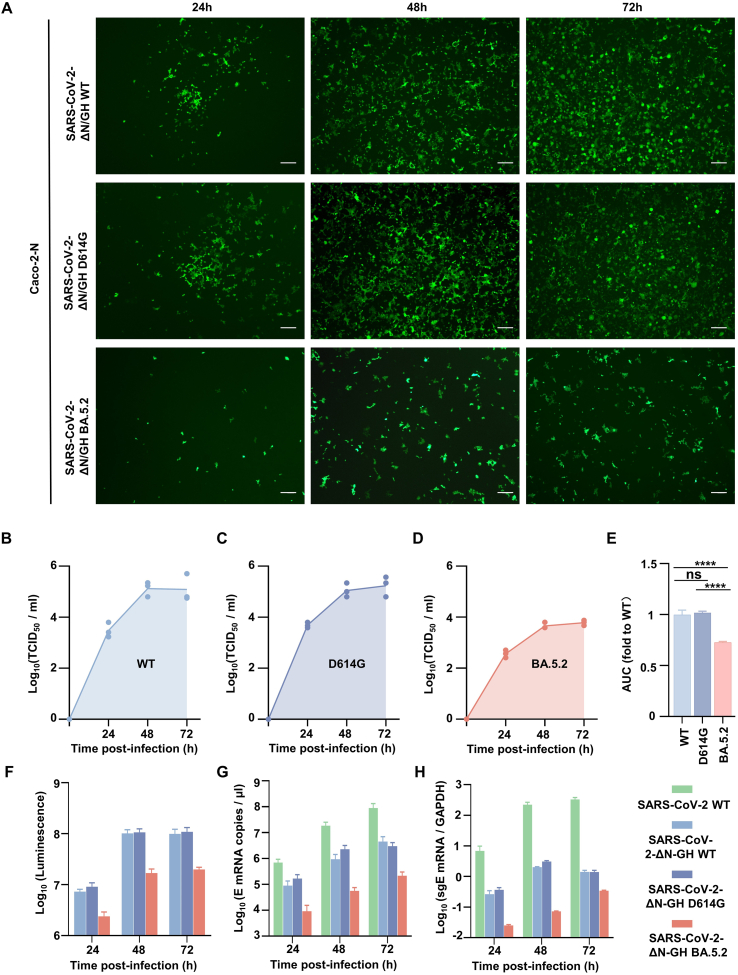
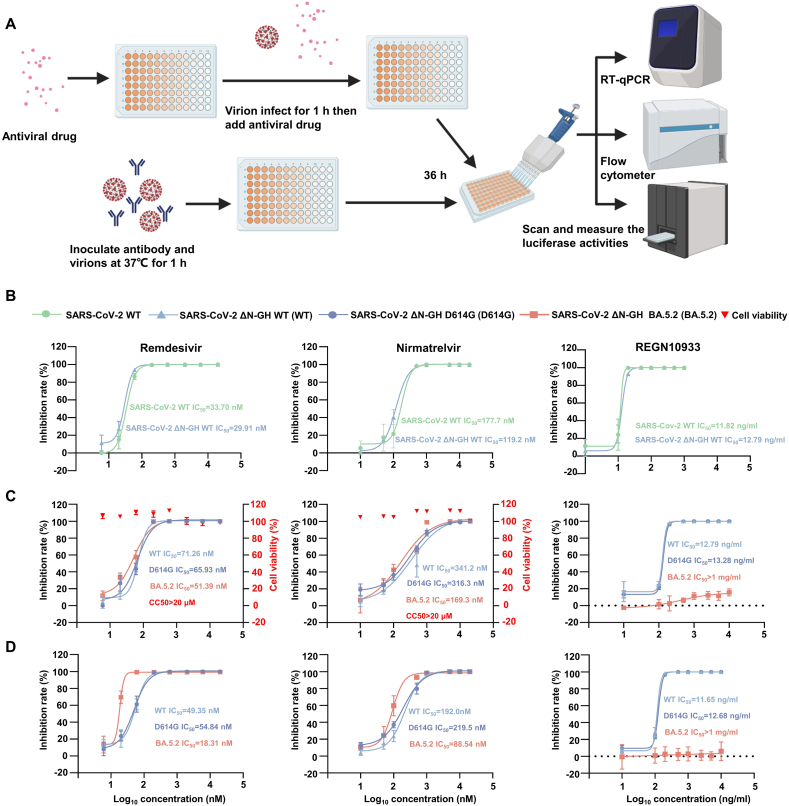
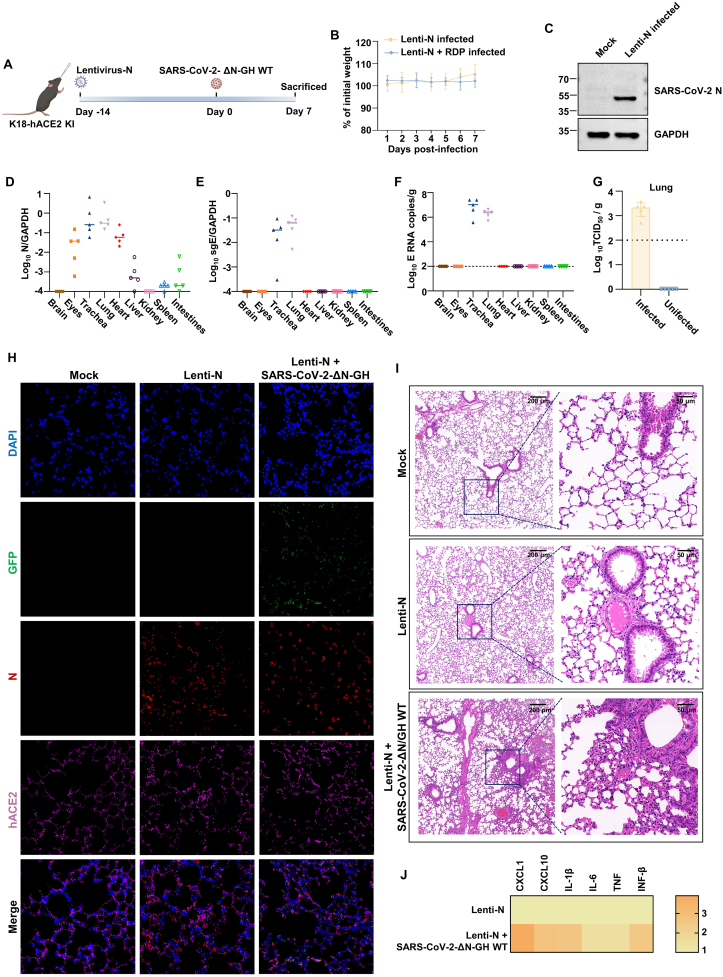
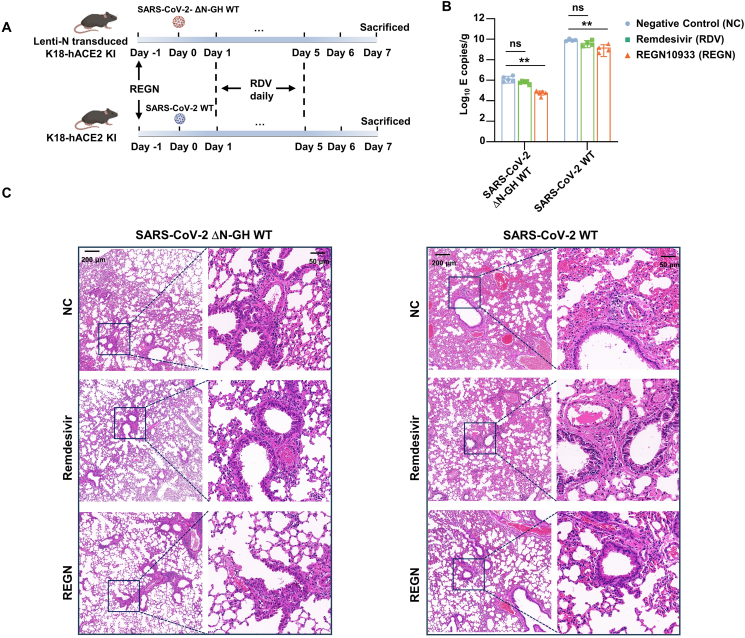
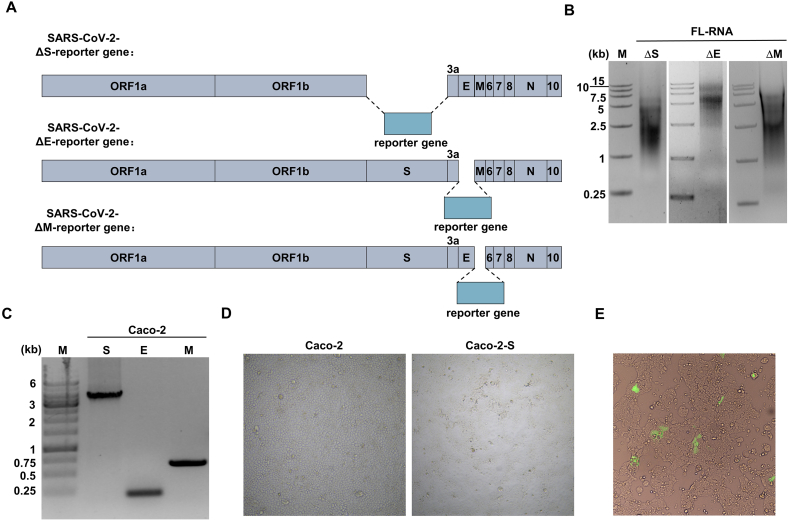
The severe acute respiratory syndrome coronavirus 2 (SARS-CoV-2) is still epidemic around the world. The manipulation of SARS-CoV-2 is restricted to biosafety level 3 laboratories (BSL-3). In this study, we developed a SARS-CoV-2 ΔN-GFP-HiBiT replicon delivery particles (RDPs) encoding a dual reporter gene, GFP-HiBiT, capable of producing both GFP signal and luciferase activities. Through optimal selection of the reporter gene, GFP-HiBiT demonstrated superior stability and convenience for antiviral evaluation. Additionally, we established a RDP infection mouse model by delivering the N gene into K18-hACE2 KI mouse through lentivirus. This mouse model supports RDP replication and can be utilized for in vivo antiviral evaluations. In summary, the RDP system serves as a valuable tool for efficient antiviral screening and studying the gene function of SARS-CoV-2. Importantly, this system can be manipulated in BSL-2 laboratories, decreasing the threshold of experimental requirements.
Keywords: Antiviral evaluation; BSL-2; Mouse model; RDP; SARS-CoV-2.
Copyright © 2024 The Authors. Publishing services by Elsevier B.V. All rights reserved.
Conflict of interest statement
Conflict of interest The authors declare that they have no conflicts of interest.
Figures
Similar articles
-
A BSL-2 compliant mouse model of SARS-CoV-2 infection for efficient and convenient antiviral evaluation.J Virol. 2024 Jul 23;98(7):e0050424. doi: 10.1128/jvi.00504-24. Epub 2024 Jun 20. J Virol. 2024. PMID: 38899934 Free PMC article.
-
Construction of a Noninfectious SARS-CoV-2 Replicon for Antiviral-Drug Testing and Gene Function Studies.J Virol. 2021 Aug 25;95(18):e0068721. doi: 10.1128/JVI.00687-21. Epub 2021 Aug 25. J Virol. 2021. PMID: 34191580 Free PMC article.
-
Generation of SARS-CoV-2 reporter replicon for high-throughput antiviral screening and testing.Proc Natl Acad Sci U S A. 2021 Apr 13;118(15):e2025866118. doi: 10.1073/pnas.2025866118. Proc Natl Acad Sci U S A. 2021. PMID: 33766889 Free PMC article.
-
Design and Application of Biosafe Coronavirus Engineering Systems without Virulence.Viruses. 2024 Apr 24;16(5):659. doi: 10.3390/v16050659. Viruses. 2024. PMID: 38793541 Free PMC article. Review.
-
A high-throughput drug screening strategy against coronaviruses.Int J Infect Dis. 2021 Feb;103:300-304. doi: 10.1016/j.ijid.2020.12.033. Epub 2020 Dec 14. Int J Infect Dis. 2021. PMID: 33333250 Free PMC article. Review.
Cited by
-
Epitranscriptomic m5C methylation of SARS-CoV-2 RNA regulates viral replication and the virulence of progeny viruses in the new infection.Sci Adv. 2024 Aug 9;10(32):eadn9519. doi: 10.1126/sciadv.adn9519. Epub 2024 Aug 7. Sci Adv. 2024. PMID: 39110796 Free PMC article.
-
PCSK9 potentiates innate immune response to RNA viruses by preventing AIP4-mediated polyubiquitination and degradation of VISA/MAVS.Proc Natl Acad Sci U S A. 2025 Feb 25;122(8):e2412206122. doi: 10.1073/pnas.2412206122. Epub 2025 Feb 18. Proc Natl Acad Sci U S A. 2025. PMID: 40233407
-
SARS-CoV-2 specific adaptations in N protein inhibit NF-κB activation and alter pathogenesis.J Cell Biol. 2025 Jan 6;224(1):e202404131. doi: 10.1083/jcb.202404131. Epub 2024 Dec 16. J Cell Biol. 2025. PMID: 39680116 Free PMC article.
-
Optimization and validation of a virus-like particle pseudotyped virus neutralization assay for SARS-CoV-2.MedComm (2020). 2024 Jun 14;5(6):e615. doi: 10.1002/mco2.615. eCollection 2024 Jun. MedComm (2020). 2024. PMID: 38881676 Free PMC article.
-
Natural evidence of coronaviral 2'-O-methyltransferase activity affecting viral pathogenesis via improved substrate RNA binding.Signal Transduct Target Ther. 2024 May 29;9(1):140. doi: 10.1038/s41392-024-01860-x. Signal Transduct Target Ther. 2024. PMID: 38811528 Free PMC article.
References
-
- Bao L., Deng W., Huang B., Gao H., Liu J., Ren L., Wei Q., Yu P., Xu Y., Qi F., Qu Y., Li F., Lv Q., Wang W., Xue J., Gong S., Liu M., Wang G., Wang S., Song Z., Zhao L., Liu P., Zhao L., Ye F., Wang H., Zhou W., Zhu N., Zhen W., Yu H., Zhang X., Guo L., Chen L., Wang C., Wang Y., Wang X., Xiao Y., Sun Q., Liu H., Zhu F., Ma C., Yan L., Yang M., Han J., Xu W., Tan W., Peng X., Jin Q., Wu G., Qin C. The pathogenicity of SARS-CoV-2 in hACE2 transgenic mice. Nature. 2020;583:830–833. - PubMed
-
- Chen L., Guan W.J., Qiu Z.E., Xu J.B., Bai X., Hou X.C., Sun J., Qu S., Huang Z.X., Lei T.L., Huang Z.Y., Zhao J., Zhu Y.X., Ye K.N., Lun Z.R., Zhou W.L., Zhong N.S., Zhang Y.L. SARS-CoV-2 nucleocapsid protein triggers hyperinflammation via protein-protein interaction-mediated intracellular Cl(-) accumulation in respiratory epithelium. Signal Transduct. Target. Ther. 2022;7:255. - PMC - PubMed
MeSH terms
Substances
LinkOut - more resources
Full Text Sources
Medical
Research Materials
Miscellaneous
