Elucidation of the Mechanisms of Inter-domain Coupling in the Monomeric State of Enzyme I by High-pressure NMR
- PMID: 38548260
- PMCID: PMC11042970
- DOI: 10.1016/j.jmb.2024.168553
Elucidation of the Mechanisms of Inter-domain Coupling in the Monomeric State of Enzyme I by High-pressure NMR
Abstract
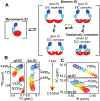
The catalytic cycle of Enzyme I (EI), a phosphotransferase enzyme responsible for converting phosphoenolpyruvate (PEP) into pyruvate, is characterized by a series of local and global conformational rearrangements. This multistep process includes a monomer-to-dimer transition, followed by an open-to-closed rearrangement of the dimeric complex upon PEP binding. In the present study, we investigate the thermodynamics of EI dimerization using a range of high-pressure solution NMR techniques complemented by SAXS experiments. 1H-15N TROSY and 1H-13C methyl TROSY NMR spectra combined with 15N relaxation measurements revealed that a native-like engineered variant of full-length EI fully dissociates into stable monomeric state above 1.5 kbar. Conformational ensembles of EI monomeric state were generated via a recently developed protocol combining coarse-grained molecular simulations with experimental backbone residual dipolar coupling measurements. Analysis of the structural ensembles provided detailed insights into the molecular mechanisms driving formation of the catalytically competent dimeric state, and reveals that each step of EI catalytical cycle is associated with a significant reduction in either inter- or intra-domain conformational entropy. Altogether, this study completes a large body work conducted by our group on EI and establishes a comprehensive structural and dynamical description of the catalytic cycle of this prototypical multidomain, oligomeric enzyme.
Keywords: Enzyme I; NMR relaxation; high-pressure NMR; phosphotransferase system; protein dynamics.
Copyright © 2024 Elsevier Ltd. All rights reserved.
Conflict of interest statement
Declaration of competing interest The authors declare that they have no known competing financial interests or personal relationships that could have appeared to influence the work reported in this paper.
Figures


Similar articles
-
Structure elucidation of the elusive Enzyme I monomer reveals the molecular mechanisms linking oligomerization and enzymatic activity.Proc Natl Acad Sci U S A. 2021 May 18;118(20):e2100298118. doi: 10.1073/pnas.2100298118. Proc Natl Acad Sci U S A. 2021. PMID: 33975952 Free PMC article.
-
Dynamic equilibrium between closed and partially closed states of the bacterial Enzyme I unveiled by solution NMR and X-ray scattering.Proc Natl Acad Sci U S A. 2015 Sep 15;112(37):11565-70. doi: 10.1073/pnas.1515366112. Epub 2015 Aug 24. Proc Natl Acad Sci U S A. 2015. PMID: 26305976 Free PMC article.
-
Structure of phosphorylated enzyme I, the phosphoenolpyruvate:sugar phosphotransferase system sugar translocation signal protein.Proc Natl Acad Sci U S A. 2006 Oct 31;103(44):16218-23. doi: 10.1073/pnas.0607587103. Epub 2006 Oct 19. Proc Natl Acad Sci U S A. 2006. PMID: 17053069 Free PMC article.
-
Molecular Dynamics Simulations Combined with Nuclear Magnetic Resonance and/or Small-Angle X-ray Scattering Data for Characterizing Intrinsically Disordered Protein Conformational Ensembles.J Chem Inf Model. 2019 May 28;59(5):1743-1758. doi: 10.1021/acs.jcim.8b00928. Epub 2019 Mar 18. J Chem Inf Model. 2019. PMID: 30840442 Review.
-
Enzyme I: the gateway to the bacterial phosphoenolpyruvate:sugar phosphotransferase system.Arch Biochem Biophys. 2002 Jan 15;397(2):273-8. doi: 10.1006/abbi.2001.2603. Arch Biochem Biophys. 2002. PMID: 11795882 Review.
References
Publication types
MeSH terms
Substances
Grants and funding
LinkOut - more resources
Full Text Sources
Miscellaneous

