

T cell activation markers CD38 and HLA-DR indicative of non-seroconversion in anti-CD20-treated patients with multiple sclerosis following SARS-CoV-2 mRNA vaccination
- PMID: 38548324
- PMCID: PMC11347213
- DOI: 10.1136/jnnp-2023-332224
T cell activation markers CD38 and HLA-DR indicative of non-seroconversion in anti-CD20-treated patients with multiple sclerosis following SARS-CoV-2 mRNA vaccination
Abstract
Background: Messenger RNA (mRNA) vaccines provide robust protection against SARS-CoV-2 in healthy individuals. However, immunity after vaccination of patients with multiple sclerosis (MS) treated with ocrelizumab (OCR), a B cell-depleting anti-CD20 monoclonal antibody, is not yet fully understood.
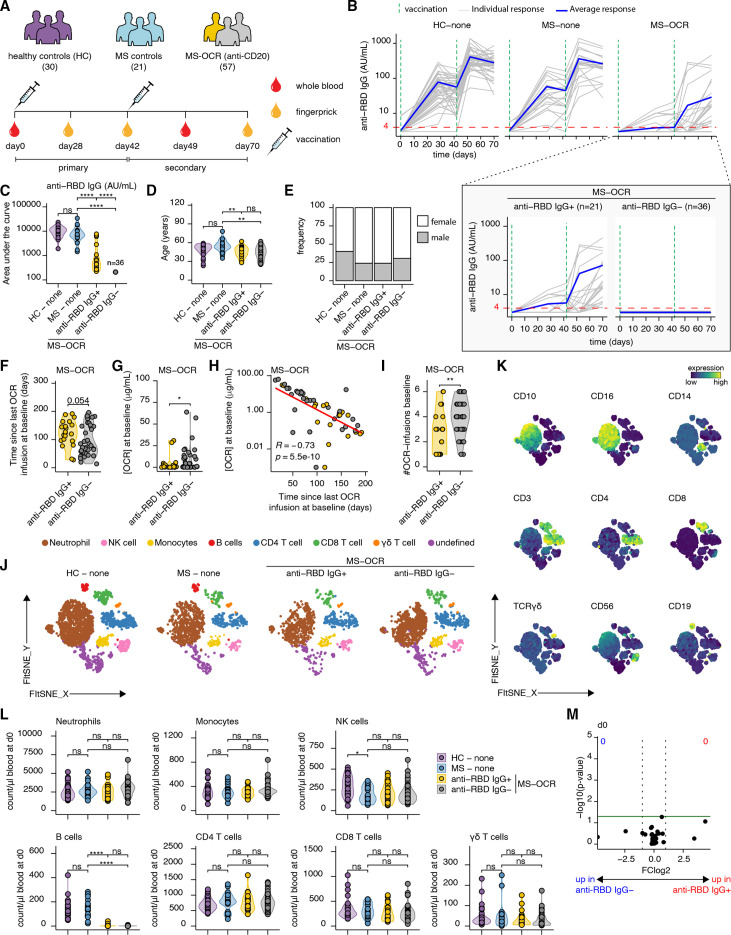
Methods: In this study, deep immune profiling techniques were employed to investigate the immune response induced by SARS-CoV-2 mRNA vaccines in untreated patients with MS (n=21), OCR-treated patients with MS (n=57) and healthy individuals (n=30).
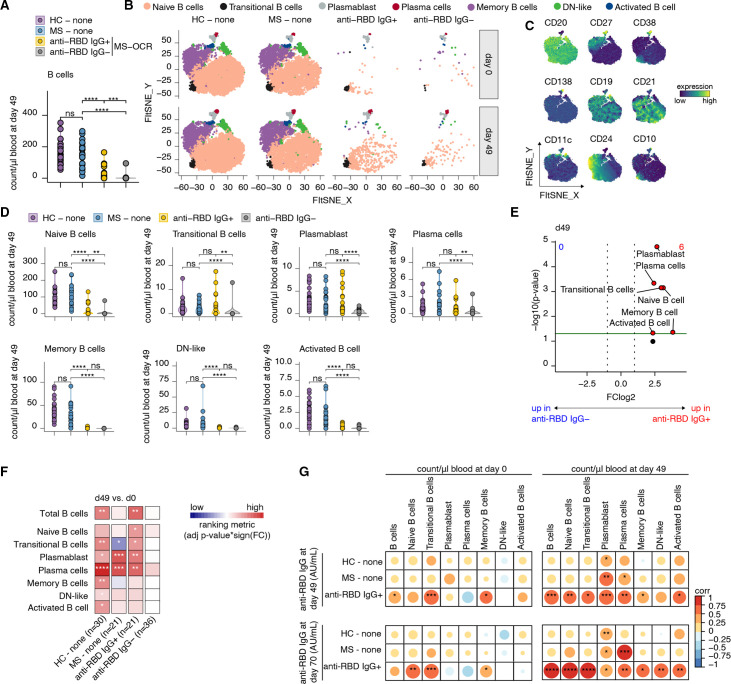
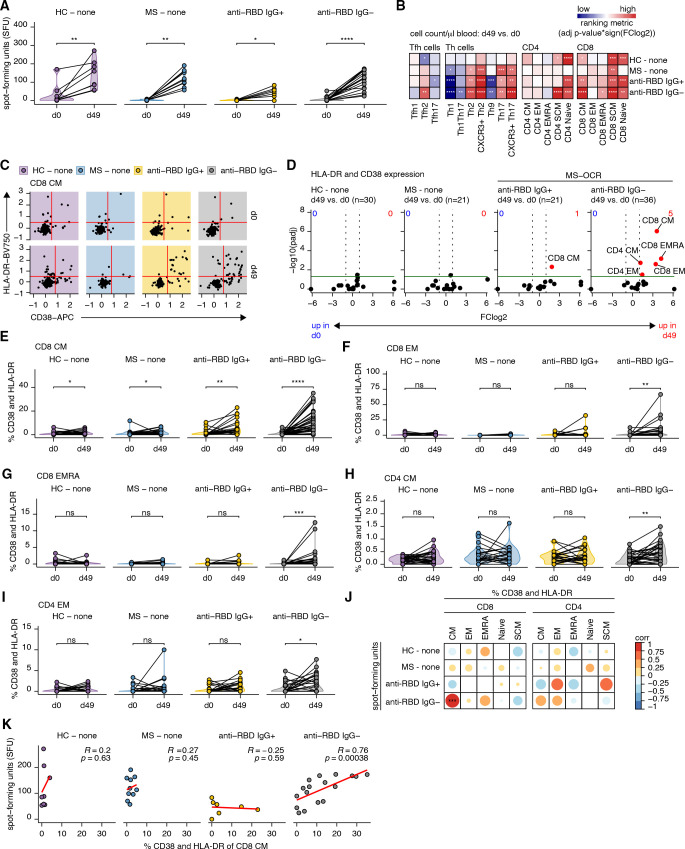
Results: Among OCR-treated patients with MS, 63% did not produce detectable levels of antibodies (non-seroconverted), and those who did have lower spike receptor-binding domain-specific IgG responses compared with healthy individuals and untreated patients with MS. Before vaccination, no discernible immunological differences were observed between non-seroconverted and seroconverted OCR-treated patients with MS. However, non-seroconverted patients received overall more OCR infusions, had shorter intervals since their last OCR infusion and displayed higher OCR serum concentrations at the time of their initial vaccination. Following two vaccinations, non-seroconverted patients displayed smaller B cell compartments but instead exhibited more robust activation of general CD4+ and CD8+ T cell compartments, as indicated by upregulation of CD38 and HLA-DR surface expression, when compared with seroconverted patients.
Conclusion: These findings highlight the importance of optimising treatment regimens when scheduling SARS-CoV-2 vaccination for OCR-treated patients with MS to maximise their humoral and cellular immune responses. This study provides valuable insights for optimising vaccination strategies in OCR-treated patients with MS, including the identification of CD38 and HLA-DR as potential markers to explore vaccine efficacy in non-seroconverting OCR-treated patients with MS.
Keywords: COVID-19; MULTIPLE SCLEROSIS.
© Author(s) (or their employer(s)) 2024. Re-use permitted under CC BY. Published by BMJ.
Conflict of interest statement
Competing interests: JK received research grants for multicentre investigator-initiated trials (DOT-MS trial, ClinicalTrials.gov Identifier: NCT04260711 (ZonMw) and BLOOMS trial (ZonMw and Treatmeds), ClinicalTrials.gov Identifier: NCT05296161); received consulting fees from F Hoffmann-La Roche, Biogen, Teva, Merck, Novartis and Sanofi/Genzyme (all payments to institution); reports speaker relationships with F Hoffmann-La Roche, Biogen, Immunic, Teva, Merck, Novartis and Sanofi/Genzyme (all payments to institution); and adjudication committee of MS clinical trial of Immunic (payments to institution only).
Figures
Similar articles
-
Immunity following SARS-CoV-2 vaccination in autoimmune neurological disorders treated with rituximab or ocrelizumab.Front Immunol. 2023 Jun 16;14:1149629. doi: 10.3389/fimmu.2023.1149629. eCollection 2023. Front Immunol. 2023. PMID: 37398654 Free PMC article.
-
Humoral and cellular immune response from first to fourth SARS-CoV-2 mRNA vaccination in anti-CD20-treated multiple sclerosis patients-a longitudinal cohort study.Front Immunol. 2024 Sep 5;15:1432348. doi: 10.3389/fimmu.2024.1432348. eCollection 2024. Front Immunol. 2024. PMID: 39301017 Free PMC article.
-
Six-month humoral response to mRNA SARS-CoV-2 vaccination in patients with multiple sclerosis treated with ocrelizumab and fingolimod.Mult Scler Relat Disord. 2022 Apr;60:103724. doi: 10.1016/j.msard.2022.103724. Epub 2022 Mar 4. Mult Scler Relat Disord. 2022. PMID: 35272145 Free PMC article.
-
Chronic Immune Activation and CD4+ T Cell Lymphopenia in Healthy African Individuals: Perspectives for SARS-CoV-2 Vaccine Efficacy.Front Immunol. 2021 Jun 17;12:693269. doi: 10.3389/fimmu.2021.693269. eCollection 2021. Front Immunol. 2021. PMID: 34220854 Free PMC article. Review.
-
Anti-CD20 monoclonal antibodies in multiple sclerosis: Rethinking the current treatment strategy.Rev Neurol (Paris). 2024 Dec;180(10):1047-1058. doi: 10.1016/j.neurol.2023.12.013. Epub 2024 Apr 9. Rev Neurol (Paris). 2024. PMID: 38599976 Review.
Cited by
-
Unveiling the role of NAD glycohydrolase CD38 in aging and age-related diseases: insights from bibliometric analysis and comprehensive review.Front Immunol. 2025 Jun 2;16:1579924. doi: 10.3389/fimmu.2025.1579924. eCollection 2025. Front Immunol. 2025. PMID: 40529366 Free PMC article.
-
Longevity of antibody responses is associated with distinct antigen-specific B cell subsets early after infection.Front Immunol. 2024 Dec 17;15:1505719. doi: 10.3389/fimmu.2024.1505719. eCollection 2024. Front Immunol. 2024. PMID: 39742271 Free PMC article.
-
Extensive T-Cell Profiling Following SARS-CoV-2 mRNA Vaccination in Multiple Sclerosis Patients Treated with DMTs.Pathogens. 2025 Feb 27;14(3):235. doi: 10.3390/pathogens14030235. Pathogens. 2025. PMID: 40137720 Free PMC article.
-
Vaccine-Induced Humoral and Cellular Response to SARS-CoV-2 in Multiple Sclerosis Patients on Ocrelizumab.Vaccines (Basel). 2025 Apr 30;13(5):488. doi: 10.3390/vaccines13050488. Vaccines (Basel). 2025. PMID: 40432100 Free PMC article.
References
MeSH terms
Substances
LinkOut - more resources
Full Text Sources
Medical
Research Materials
Miscellaneous