. 2024 Mar 28;15(1):2723.
doi: 10.1038/s41467-024-46725-7.

Structure and function of Semaphorin-5A glycosaminoglycan interactions

Affiliations

Structure and function of Semaphorin-5A glycosaminoglycan interactions

Gergely N Nagy et al. Nat Commun. .

Abstract

Integration of extracellular signals by neurons is pivotal for brain development, plasticity, and repair. Axon guidance relies on receptor-ligand interactions crosstalking with extracellular matrix components. Semaphorin-5A (Sema5A) is a bifunctional guidance cue exerting attractive and inhibitory effects on neuronal growth through the interaction with heparan sulfate (HS) and chondroitin sulfate (CS) glycosaminoglycans (GAGs), respectively. Sema5A harbors seven thrombospondin type-1 repeats (TSR1-7) important for GAG binding, however the underlying molecular basis and functions in vivo remain enigmatic. Here we dissect the structural basis for Sema5A:GAG specificity and demonstrate the functional significance of this interaction in vivo. Using x-ray crystallography, we reveal a dimeric fold variation for TSR4 that accommodates GAG interactions. TSR4 co-crystal structures identify binding residues validated by site-directed mutagenesis. In vitro and cell-based assays uncover specific GAG epitopes necessary for TSR association. We demonstrate that HS-GAG binding is preferred over CS-GAG and mediates Sema5A oligomerization. In vivo, Sema5A:GAG interactions are necessary for Sema5A function and regulate Plexin-A2 dependent dentate progenitor cell migration. Our study rationalizes Sema5A associated developmental and neurological disorders and provides mechanistic insights into how multifaceted guidance functions of a single transmembrane cue are regulated by proteoglycans.


Conflict of interest statement

The authors declare no competing interests.

Figures
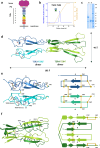
Fig. 1
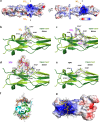
Fig. 1. Sema5A TSR3-4 is a disulfide-linked dimer with a unique 3D domain-swapped fold.
a Sema5A architecture. Sema, sema domain; PSI, plexin-semaphorin-integrin domain; TSR, thrombospondin-1 type repeat/domain. b Sema5ATSR3-4 binds to a heparin column and elutes at ∼500 mM NaCl, 10 mM HEPES pH 7.5 (46 mS/cm). mAU: milli absorbance units. c non-reducing (N) and reducing (R) SDS-PAGE analysis indicates an unexpected disulfide-linked dimer form. kDa: kilodaltons. Representative data is shown from 3 biological replicates. d Ribbon representation of the Sema5ATSR3-4-NO3 structure. Color code: Chain A TSR3, blue; TSR4, dark green; Chain B TSR3, cyan; TSR4, light green. Inter-protomer disulfides are shown as sticks, and C-mannosyl modifications are colored by the element, carbon: white. e, f Cartoon and topology depiction of the TSR3 and TSR4 domain folds, respectively. N and C terminal ends of polypeptide chains are indicated by letters in italics. Inter- and intra-domain disulfides are shown as sticks (left) and lines (right). Trp-Arg ladders from both domains are shown as sticks. Source data are provided as a Source Data file.
Fig. 2
Fig. 2. Structural characterization of the Sema5A GAG site.
a Electrostatic surface potential for the Sema5ATSR3-4-SO4, calculated by the Adaptive Poisson-Boltzmann Solver (ABPS) and visualized on a red (−4 kbT/ec) to blue (+4 kbT/ec) color range. Each of the two positively charged cavities (marked with asterisks) formed by TSR4 dimer accommodates a sulfate ion (sticks). Snapshot of the GAG site within TSR4; (b), Sema5ATSR3-4-SO4, (c), Sema5ATSR3-4-NO3, (d), Sema5ATSR3-4-SOS, (e), Sema5ATSR3-4-apo. Residues are shown as sticks and the refined 2Fo-Fc electron density map is shown at 1.0 root mean square deviation contour level. H-bonds are indicated as dashed lines. f Cross-section view of TSR4 domain from Sema5ATSR3-4-NO3 rigid body docked with a heparin dp4 IdoA(2S)-GlcNS(6S)-IdoA(2S)-GlcNS(6S) tetrasaccharide using ClusPro. Docked ligand poses representing the largest and second-largest clusters are shown as sticks, color code: yellow and orange carbons, respectively. Further 11 docked dp4 poses are shown as black lines. g Docked dp4 pose representing the largest cluster is accommodated in the GAG binding site of Sema5A. The TSR4 dimer is represented by its electrostatic surface potential calculated by ABPS and visualized on a red (−4 kbT/ec) to blue (+4 kbT/ec) color range. Source data are provided as a Source Data file.
Fig. 3
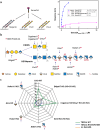
Fig. 3. Dissecting the specificity of Sema5A interactions with GAGs.
a BLI binding analysis to characterize the Sema5A interaction with heparin, CS-E, and CS-A. A schematic of the experiment and the calculated apparent dissociation constant (KD) values are shown. b A subset of the genes controlling HS or CS chain elongation and modifications that were engineered with KO (red star) in CHO cells and used in this study. c Sema5ATSR3-4 binding to genetically engineered CHO cell lines generated by KO of genes encoding GAG biosynthesis enzymes. The radar chart shows the relative mean fluorescence intensity (MFI) from flow cytometry (WT cells: 100) after genetic KO of the indicated genes. HS and CS disaccharide composition for each cell line is described in refs. ,. Source data are provided as a Source Data file.
Fig. 4
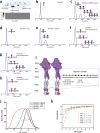
Fig. 4. Analysis of Sema5A: GAG interactions and oligomerization.
a Graphic schematics of principles of mass photometry analysis. Mass photometry with mass distributions of Sema5A and GAG chains. (b) Sema5Asema-TSR1-7 alone, (c) Sema5Asema-TSR1-7 mixed with heparin (1:4 stoichiometric ratio), (d) Sema5Asema-TSR1-7 mixed with CS-E (1:4) (e) Sema5Asema-TSR1-7 mixed with HS (1:4) derived from CHO cells without CS (CSGalNAcT1/2/Chsy1 KO (CS KO)), (f) Sema5Asema-TSR1-7 mixed with HS (1:4) derived from CHO cells with HS3ST1 KI and without CS, (g) Sema5Asema-TSR1-7 mixed with HS (1:4) derived from CHO cells with HS3ST5 KI and without CS; (h) Sema5Asema-TSR1-7 mixed with HS (1:4) derived from CHO cells with NDST2 KI and without CS, Contrast measurements were converted to mass using calibration standards of known proteins. i Illustration of Sema5A multimerization by heparan sulfate. A chimera Sema5Asema-TSR1-4 model is shown from the combination of a dimer human Sema5Asema-TSR1-2 model created by Alphafold2 (magenta surface) and Sema5ATSR3-4-NO3 crystal structure (visualized as Fig. 2a). The arrangement of the Sema5A dimers in a parallel fashion designates the minimum distance requirement necessary for multimerization. Illustration is created with BioRender.com. j MALS analysis of Sema5Asema-TSR1-7 multimerization with GAG preparations. k ITC binding isotherms (normalized heats versus molar ratio) for the interactions of size-defined heparins ranging dp4-dp20 to Sema5Asema-TSR1-7. Source data are provided as a Source Data file.
Fig. 5
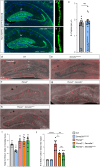
Fig. 5. The Sema5A GAG interaction regulates stem cell distribution in the dentate in a Plxna2 dependent manner.
a, b Coronal brain sections through the P30 hippocampus of Sema5a+/+;Thy1-EGFPm and Sema5aGAG/GAG;Thy1-EGFPm mice, showing EGFP-labeled granule cells and their projections. a’, b’ Higher magnification images of GC dendrites from the middle one-third of the dentate molecular layer, the corresponding areas are highlighted with dotted lines in (a, b). c Quantification of GC dendritic spine density (n = 3 mice per genotype, with 5 dendritic segments analysed per mouse). Coronal brain sections through the dorsal DG of P14 (d) WT (n = 4), (e) Sema5aGAG/GAG (n = 4), (f) Plxna2+/- (n = 5), (g) Plxna2+/-;Sema5a+/- (n = 4) and (h) Plxna2+/-;Sema5aGAG/+ (n = 6) mice, stained with anti-BrdU. In (d), the border between the SGZ and the deep hilus (H) is marked with a dotted line. i Quantification of total number of BrdU+ cells in the DG per tissue section. Two-tailed unpaired Student’s t test, *p = 0.0119. j Quantification of BrdU+ cells in deep hilar region within the DG. Data are presented as mean ± SEM. One-way ANOVA multiple comparisons, *p = 0.0107, **p = 0.0017 and ****p < 0.0001. ns, not significantly. DG, dentate gyrus; GC granule cell, H Hilar region, ML molecular layer, SGZ subgranular zone. Scale bar: 200 μm in (a, b, dh); 5 μm in (a’, b’). Source data are provided as a Source Data file.

References

    1. Kolodkin AL, Matthes DJ, Goodman CS. The semaphorin genes encode a family of transmembrane and secreted growth cone guidance molecules. Cell. 1993;75:1389–1399. doi: 10.1016/0092-8674(93)90625-Z. - DOI - PubMed
    1. Luo Y, Raible D, Raper JA. Collapsin: a protein in brain that induces the collapse and paralysis of neuronal growth cones. Cell. 1993;75:217–227. doi: 10.1016/0092-8674(93)80064-L. - DOI - PubMed
    1. Hung RJ, Terman JR. Extracellular inhibitors, repellents, and semaphorin/plexin/MICAL-mediated actin filament disassembly. Cytoskeleton. 2011;68:415–433. doi: 10.1002/cm.20527. - DOI - PMC - PubMed
    1. Casazza A, Fazzari P, Tamagnone L. Semaphorin signals in cell adhesion and cell migration: functional role and molecular mechanisms. Adv. Exp. Med. Biol. 2007;600:90–108. doi: 10.1007/978-0-387-70956-7_8. - DOI - PubMed
    1. Castellani V, Rougon G. Control of semaphorin signaling. Curr. Opin. Neurobiol. 2002;12:532–541. doi: 10.1016/S0959-4388(02)00357-4. - DOI - PubMed

MeSH terms